
Please follow to @MacroStrats
@MacroStrats_2
please follow to https://x.com/MacroStrats

The crash of Chipotle $CMG is a reflection of middle-class recession. Remember the Klarna and Doordash credit plan of 20-month payments for burritos, and the subsequent "collateralized debt burritos" ? Funny meme by the way. So are we in a subprime burrito crisis?

Bullish for gold GS now sees gold at about $4,900/oz by Dec 2026, above the prior $4,300 and futures. Central banks are in their longest buying spree on record, with 2025 running near 1,000–1,500 tons. Official demand plus macro uncertainty keeps a firm floor for gold.


The S&P 500’s top 10 now make up close to 40% of the index, dominated by Apple, Nvidia, Microsoft, Amazon, Alphabet and a few others. Earlier decades were more mixed (energy, industrials, consumer). Today’s market is far more concentrated and tilted to intangible-asset tech.

Earnings expectations show a stop-go cycle. 2022 rolled over, 2023 sank toward zero then stabilized, 2024 hovered near 9–11%, and 2025 fell midyear before reaccelerating. Markets trade on revisions, not just level, so watch whether 2025 upgrades broaden beyond the mega caps.

Higher taxes, different mix. At lower incomes the “optimal” portfolio leans on taxable bonds and broad equities. As income rises, the model shifts a big slice of fixed income into tax-exempt munis (up to ~35% at the top bracket) and trims taxable credit.

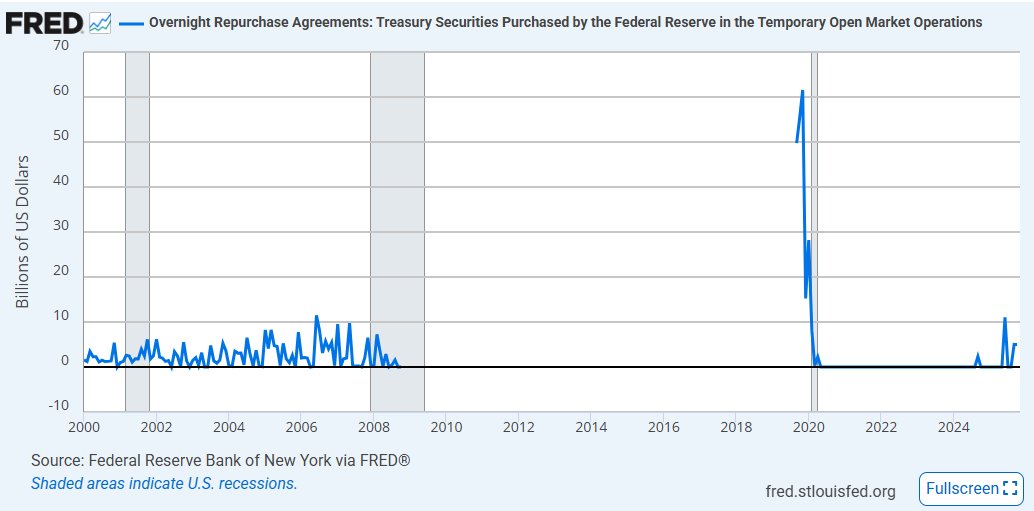
Banks/Funds are demanding more liquidity and it draining fast, what is alarming. But lets extend the graph, we are nowhere near the Oct 2019 SOFR spike that forced 50-60B per day and almost a collapse of the Money Market. Tighter, not stressed.

Dear public, we are in a rare situation: hiring plans have basically returned to their pre-COVID level. It is as if time had not passed. Recent layoff announcements: 1.@UPS: 48,000 employees 2.@amazon: Up to 30,000 employees 3.@intel: 24,000 employees 4.@Nestle: 16,000…

Micro is driving returns. The 3-month average correlation among S&P 500 stocks is ~9%, the lowest in nearly a decade. Low correlation means high dispersion, which favors stock picking, factor tilts, pair trades, and tax-loss harvesting over pure index exposure.

REITs with data centers shift the efficient frontier up: for the same risk, returns are higher. Portfolios with roughly 40–70% data centers dominate mixes without them. At the sector level, data centers and industrial lead while office and retail lag.

So, at the At Nvidia’s AI conference in Washington DC, Jensen announced collaborations with the U.S. Department of Energy and industry partners to build out America’s AI infrastructure, an AI Factory Research Center in Virginia. The market went crazy.

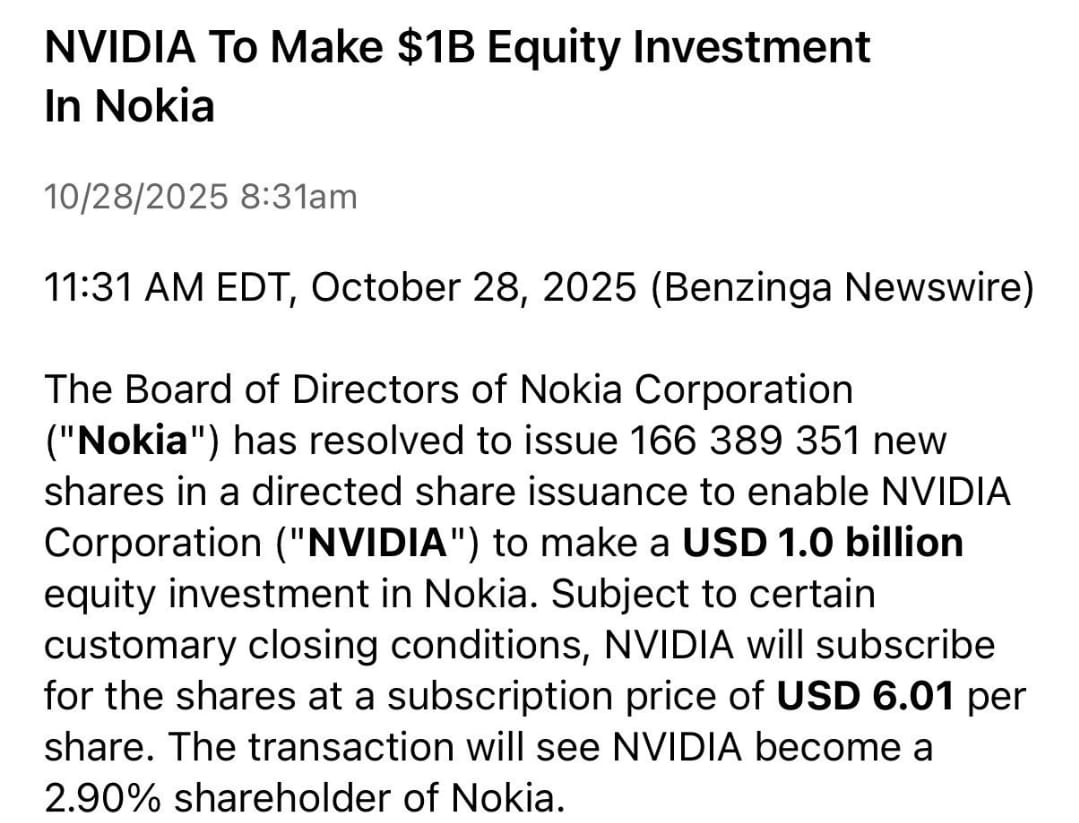
What? $NVDA: Jensen Huang is practically a corporate necromancer. He resurrects entire companies. $NOK, the stock of Nokia, a company I know but thought was dead, is up 17% as of 10/28/2025. 😂
Layoff announcements cluster in logistics, tech, consulting, autos, and spill over into retail and media. The pattern points to companies prioritizing efficiency and automation over expansion. Net read: a cooling labor market, not a collapse.

Liquidity feels tighter as ONRRP is largely drained and QT keeps cutting reserves. With buffer gone, new bill supply and settlement dates pull cash more directly from bank reserves. Seasonality around quarterly tax dates and October bill issuance explains most of it. Normal.

Fed cuts don’t have a uniform impact; it depends on the backdrop. Right now GDP growth is steady, high income consumption is resilient, and AI infrastructure capex is lifting investment. On that basis, the latest cut should be bullish for equities, unless recession risks rise.

What that hell is going on with liquidity? @zerohedge showed a graph that crashed FinX. I will show my version starting at 2018. Yes, liquidity is draining. Money market funds have shifted out of the Fed’s overnight reverse repo into T-bills, so new bill supply now pulls cash…


United States Trends
- 1. Packers 89.9K posts
- 2. Eagles 118K posts
- 3. Jordan Love 13.8K posts
- 4. #WWERaw 119K posts
- 5. Matt LaFleur 7,432 posts
- 6. AJ Brown 6,258 posts
- 7. $MONTA 1,422 posts
- 8. Patullo 11.6K posts
- 9. Smitty 5,283 posts
- 10. Jaelan Phillips 6,667 posts
- 11. #GoPackGo 7,613 posts
- 12. McManus 3,859 posts
- 13. Sirianni 4,586 posts
- 14. Grayson Allen 2,945 posts
- 15. Cavs 10.2K posts
- 16. #MondayNightFootball 1,898 posts
- 17. Pistons 14.4K posts
- 18. Devonta Smith 5,444 posts
- 19. Wiggins 11.4K posts
- 20. John Cena 96.5K posts
Something went wrong.
Something went wrong.