
คุณอาจชื่นชอบ


All assets go down when interest rates rise as fast as in 2022: stocks, bonds, real estate, gold, even #Bitcoin But the decline will not last forever and probably reverses suddenly. What do you think the trigger for the next pump will be?


The quoted $XRP tweet nailed the price action for 5 months. The market speaks if you listen, just turn down the guru noise.


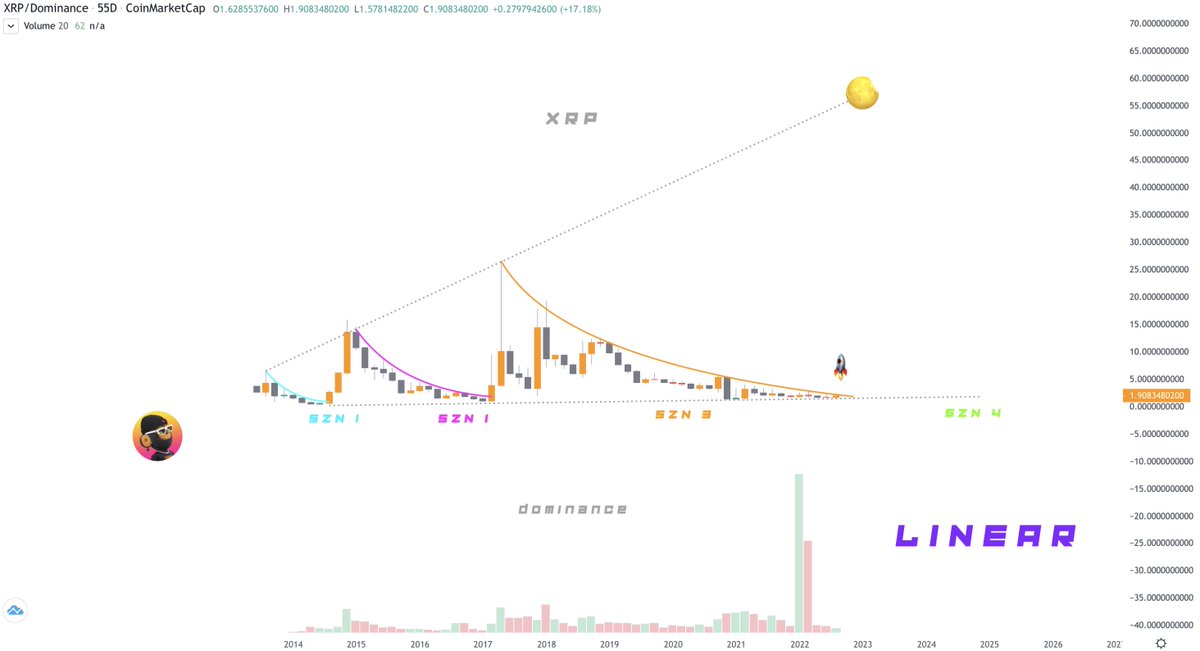
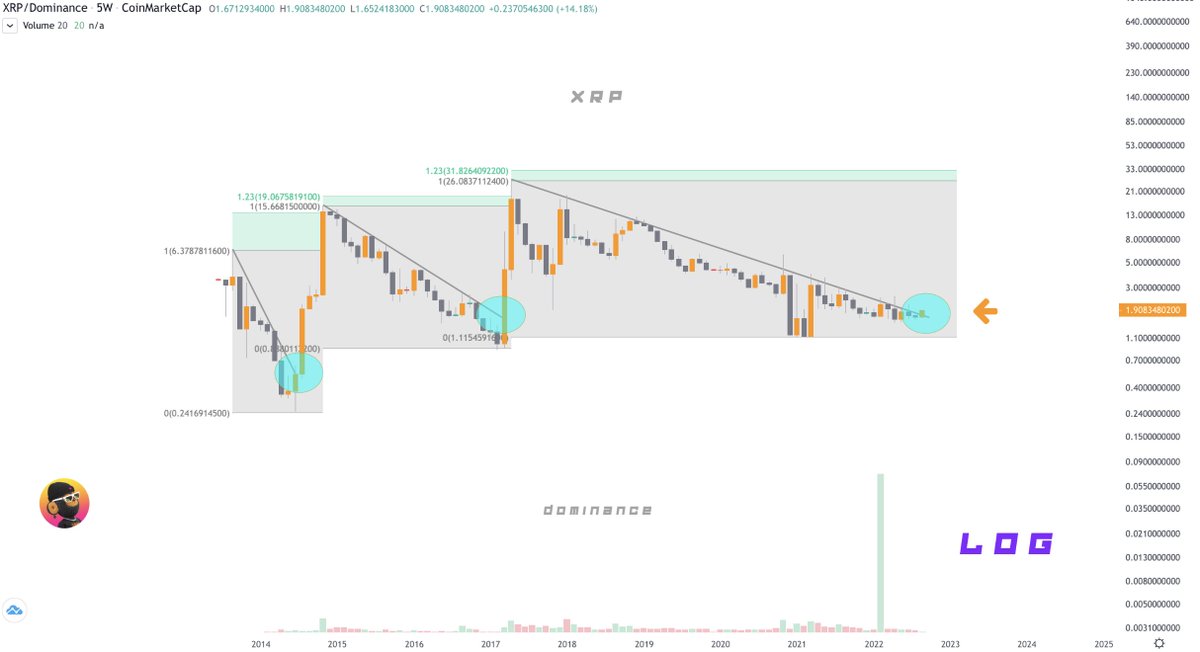
OMG $XRP ( $BTC, $ETH...) flippening really happening..? 😂😭 linear + logarithmic xrp dominance is pushing hard..
People ask if S2F model is still valid. I think it is. We can go technical on autocorrelation & cointegration, but key is IMO that BTC price is not more/less off than in 2011, 2013, 2017. IMO S2F model is valid and I expect a bounce back above S2F model value before 2024 halving.


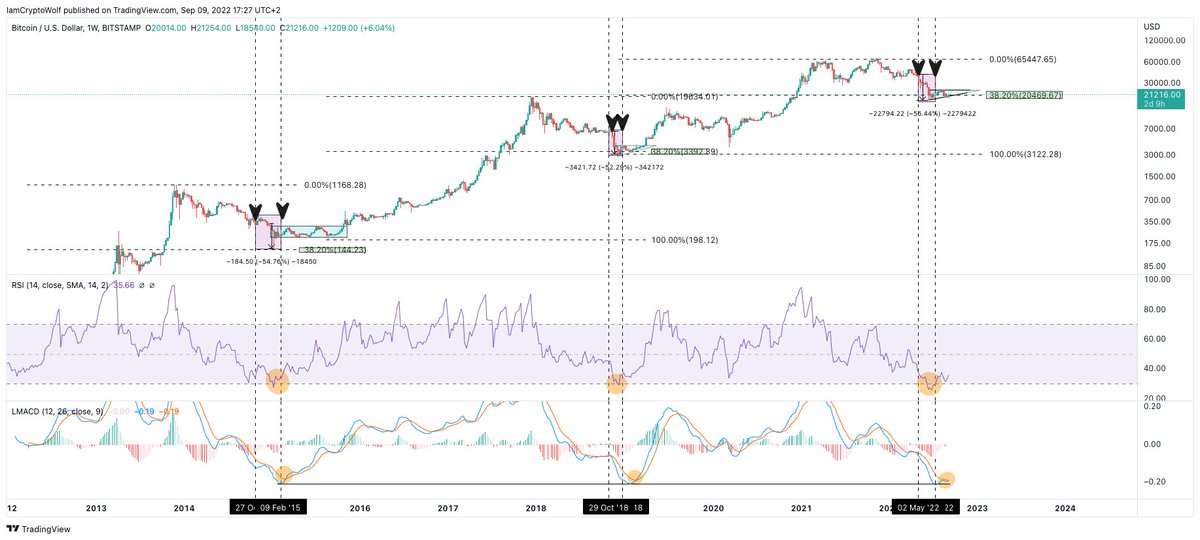
$BTC bottom is IN, last parameter to be met is the weekly MACD crossover. This would be a 3rd confirmation (together with MA's crossover, RSI) that we are in an 3+ months accumulation phase.

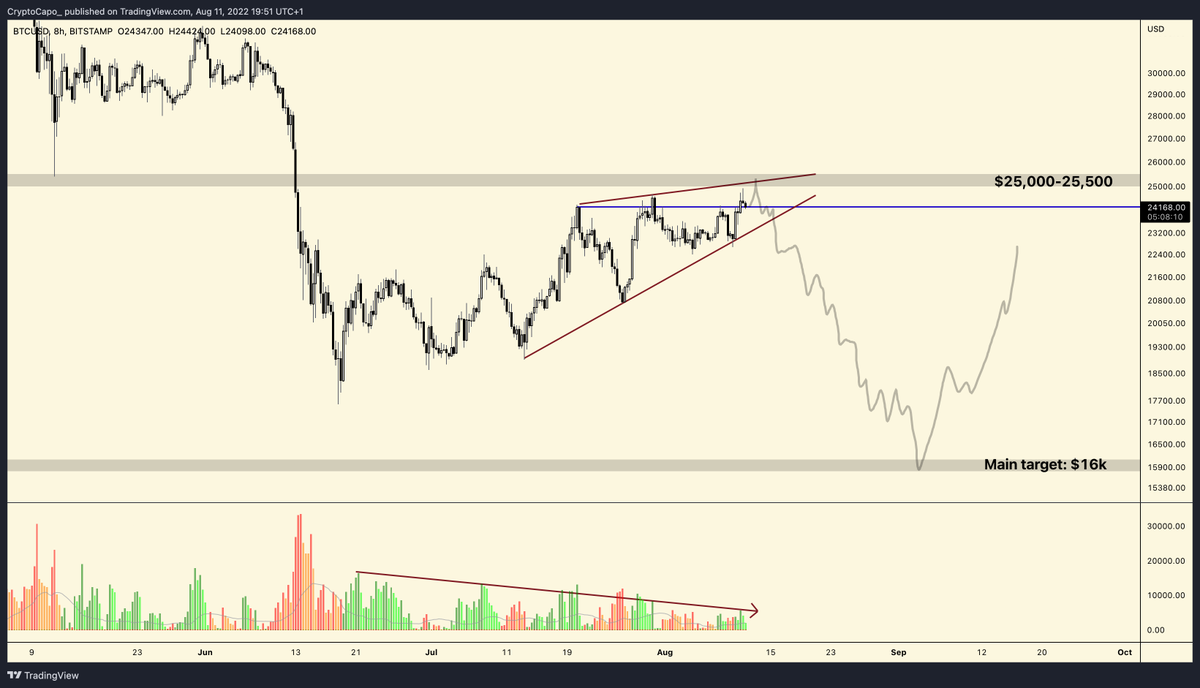
$BTC Volume is dying. Channels are not impulses but corrections. Most people expecting 28k or higher, but the big level is 25000-25500.
Same thing happening now. Worth a read. I will not post any more here until the bearish scenario is confirmed or invalidated. Good luck and stay safe.
It's the same story over and over again. 2018: Called for $3k-4k $BTC when price was $7500. It ranged between 6k and 9.5k for 7 months and then reached the final target. I had very few followers then and you could already see the hate.


$BTC I marked you previous BTC bear market bottoms. I want to see accumulation coming into 2023, I'm very sure we won't see V shape recovery out of this situation, money printer is off this time. #Bitcoin #SP500 #cryptocurrecy #daytrading FOMC #Metaverse #Play2Earn #ETH #Ethereum


FACTS

Rather than providing regulatory clarity through rulemaking, the SEC is bullying crypto markets by filing unproven allegations masquerading as regulation. In my latest op-ed, I outline the urgent need for sensible crypto legislation from Washington. bit.ly/3PXtbRF
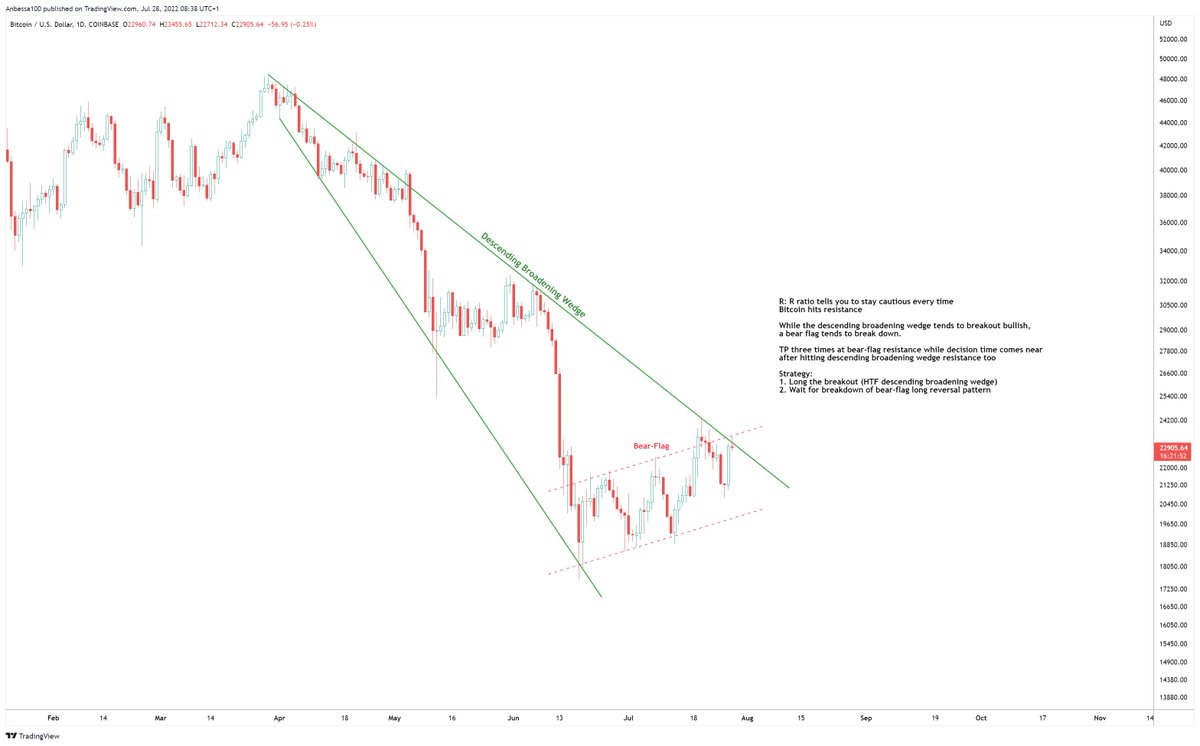
#Bitcoin Update 🔹TP at $23,6k 💯🎯 🔹Hit $20750 after -12%, bounced (divergence)✔️ ->trying to reclaim descending trendline (former support) HTF pattern is still a bear-flag which tends to breakdown -> r:r ratio in favor of yellow projection if breakdown $20750 (SL @ entry)


Observe if #Bitcoin can draw a reversal pattern above $20750 now, or look for the yellow projection to play out. Lions are ambush predators. They lie in wait.
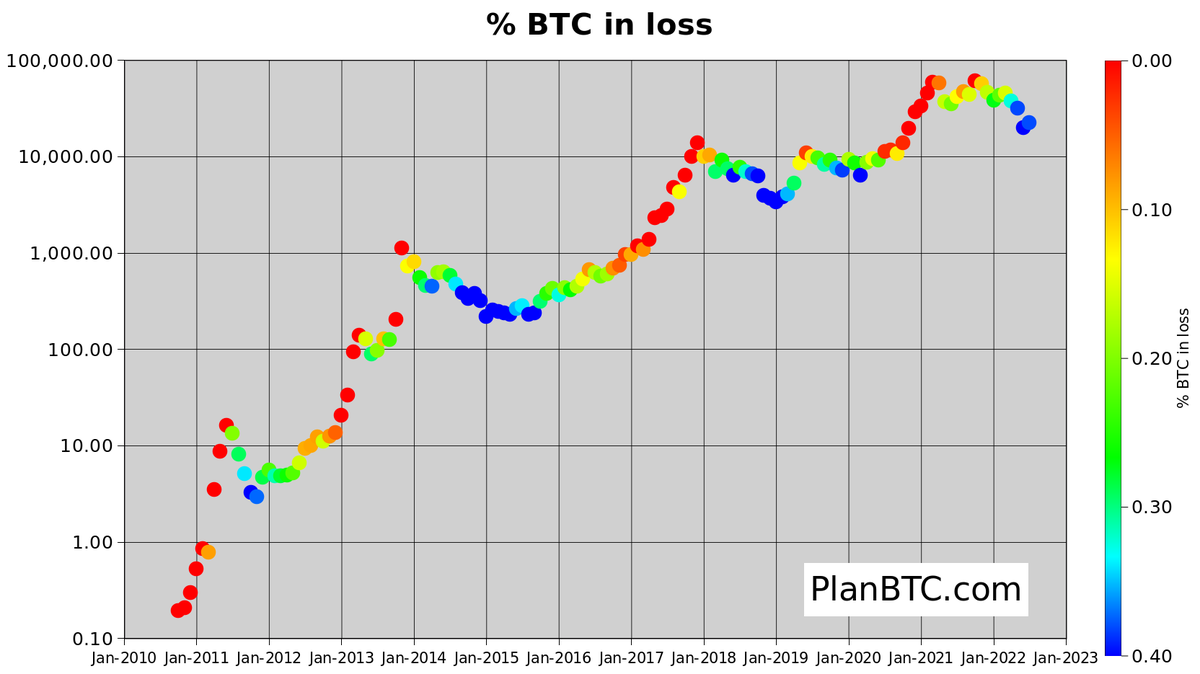
~40% of all 19M bitcoins are in loss (blue). Historically blue is a great "accumulation zone". How long blue? - Could be 1 month (Covid2020) - or 2 months (2011) - 6 months (2018/19) - 9 months (2014/15) Time will tell. Currently at 3 blue dots. Are you going to wait until green?


Interestingly enough, Top Goon X weekly momentum crossed into the midline. Anytime we cross momentum zones we usually see a counter trend bounce. Usually we see continuation of trend after it fully crosses below the zone I added a 3 day #BTC chart on the right for an example


#Ripple can be successful if it is able to replace the SWIFT payment network. If it could replace credit card network then it’ll achieve what Satoshi wanted. It has to come out of the legal battle first. 👉 Fact: Satoshi referred Ripple in his email.
June 2022 was the first #bitcoin monthly close below 200 week moving average (200WMA) ever. Now we are seeing a nice bounce back from the lowest levels. Would not surprise me if BTC closes July above 200WMA ($22K) again.


United States เทรนด์
- 1. Clay Higgins 24.6K posts
- 2. Scotland 79.5K posts
- 3. Grisham 4,195 posts
- 4. Peggy 7,255 posts
- 5. Cashman 1,214 posts
- 6. Saudi 259K posts
- 7. Dominguez 3,264 posts
- 8. Bellinger 2,601 posts
- 9. Nicki 129K posts
- 10. Mary Bruce 6,128 posts
- 11. #UNBarbie 16.6K posts
- 12. Khashoggi 56.8K posts
- 13. Gemini 3 52.2K posts
- 14. Tierney 13K posts
- 15. Dearborn 54.5K posts
- 16. Shota 9,927 posts
- 17. The House 561K posts
- 18. Gleyber Torres 1,561 posts
- 19. Woodruff 1,482 posts
- 20. Sedition 6,677 posts
คุณอาจชื่นชอบ
-
 Maatje
@koldergeist -
 x60311
@x60311 -
 YT
YT
@Lttyang -
 Stefan W.
@WeenaTrading -
 VurtFeathers
@VurtTrader -
 Marcel🇳🇱
@Marcel_Koman -
 Ben Michell
@benmichell93 -
 Potti.hl
@potti_cs -
 Zio Huntress
@Sol_sistaa -
 Stu S
Stu S
@eroticarlo -
 James ‘Ghost’ St. Patrick
@GhostCrypto6_ -
 Matilda Moon
@CryptoMatic21 -
 VinVega
@vinethgiveth -
 Umair Hussain
@omihussain -
 Cavoski
@19cava94
Something went wrong.
Something went wrong.