#captionthechart ผลการค้นหา

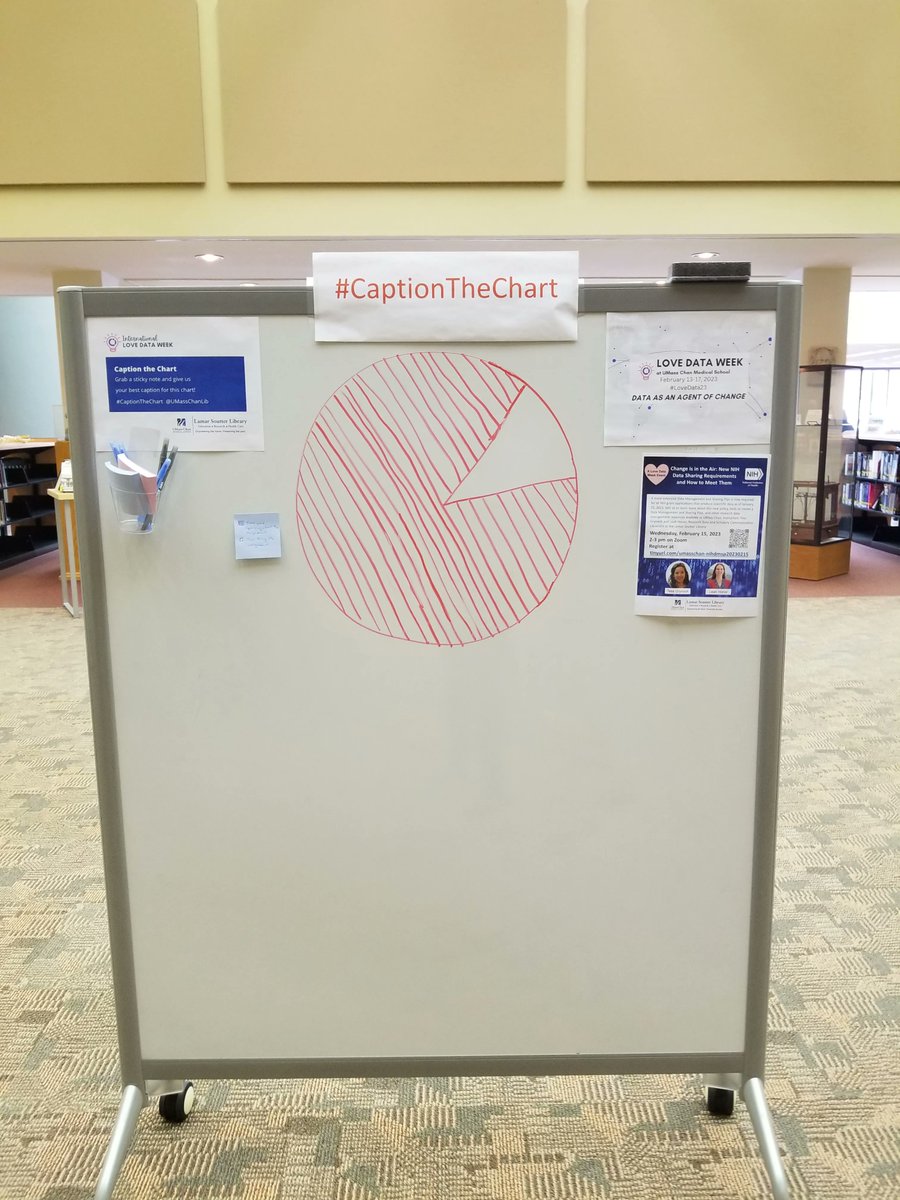
Today's #CaptionTheChart is on display now at the library's front entrance. Come give us your best caption or tweet your caption to us. #LoveData23 @UMassChan @UMassChanGSBS @UMassMedPostDoc @umassmemorial

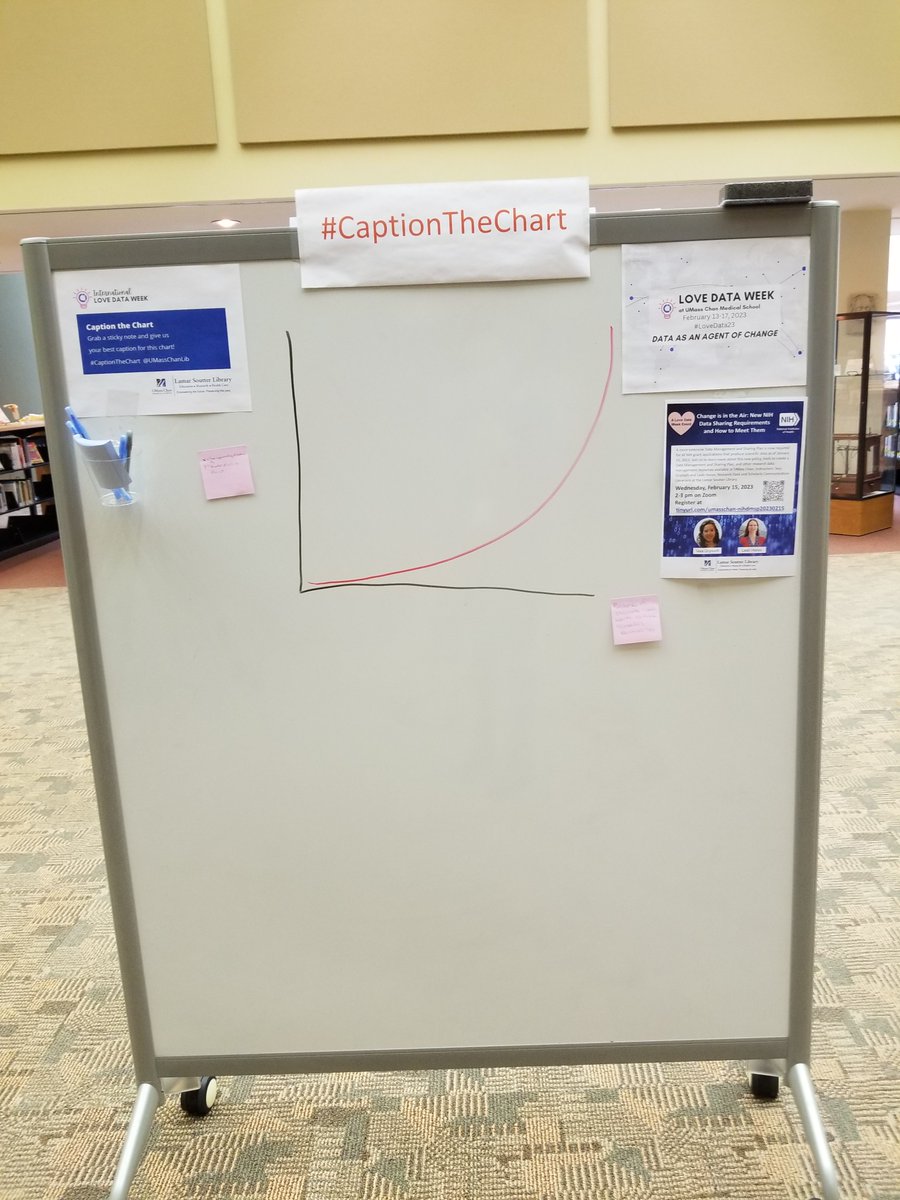
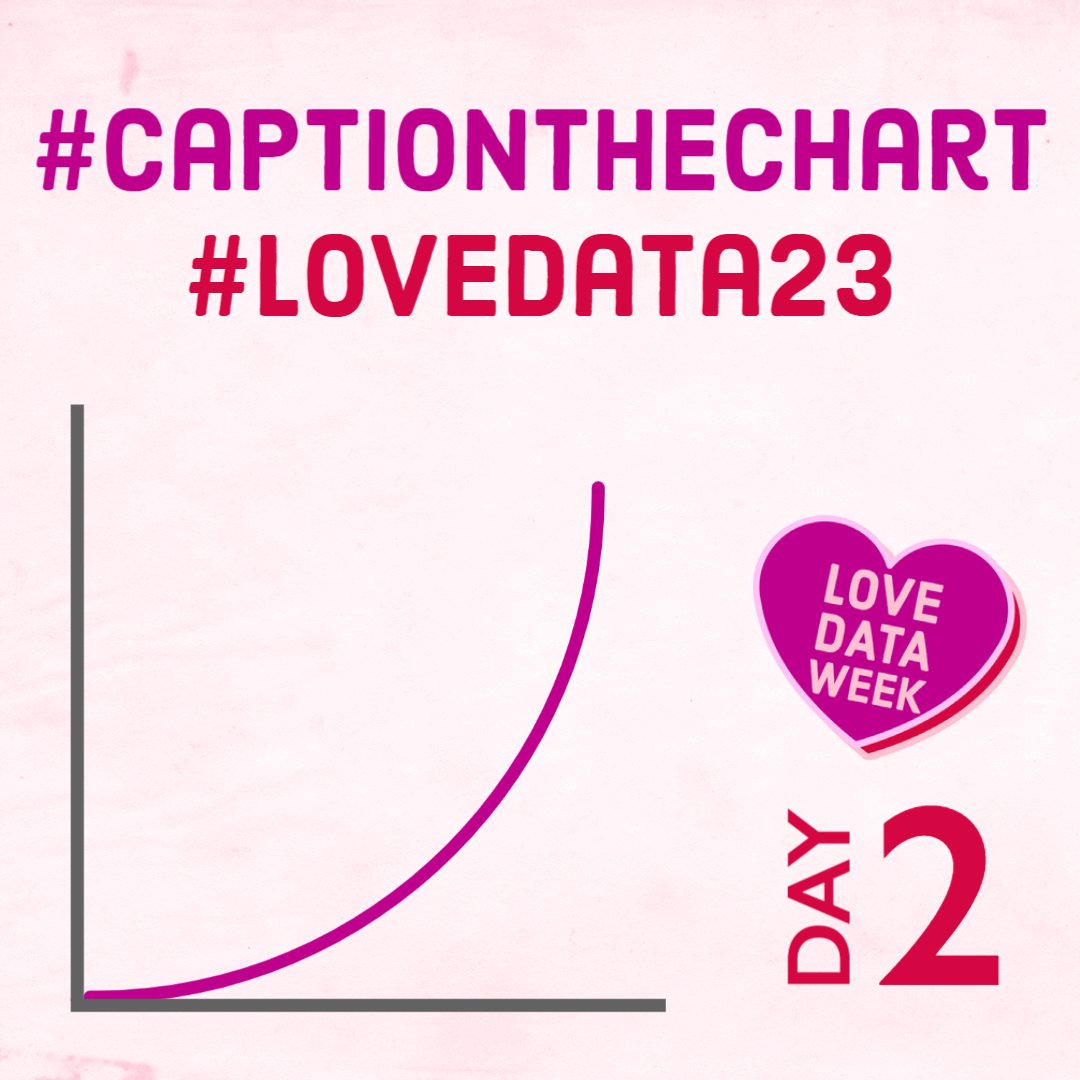
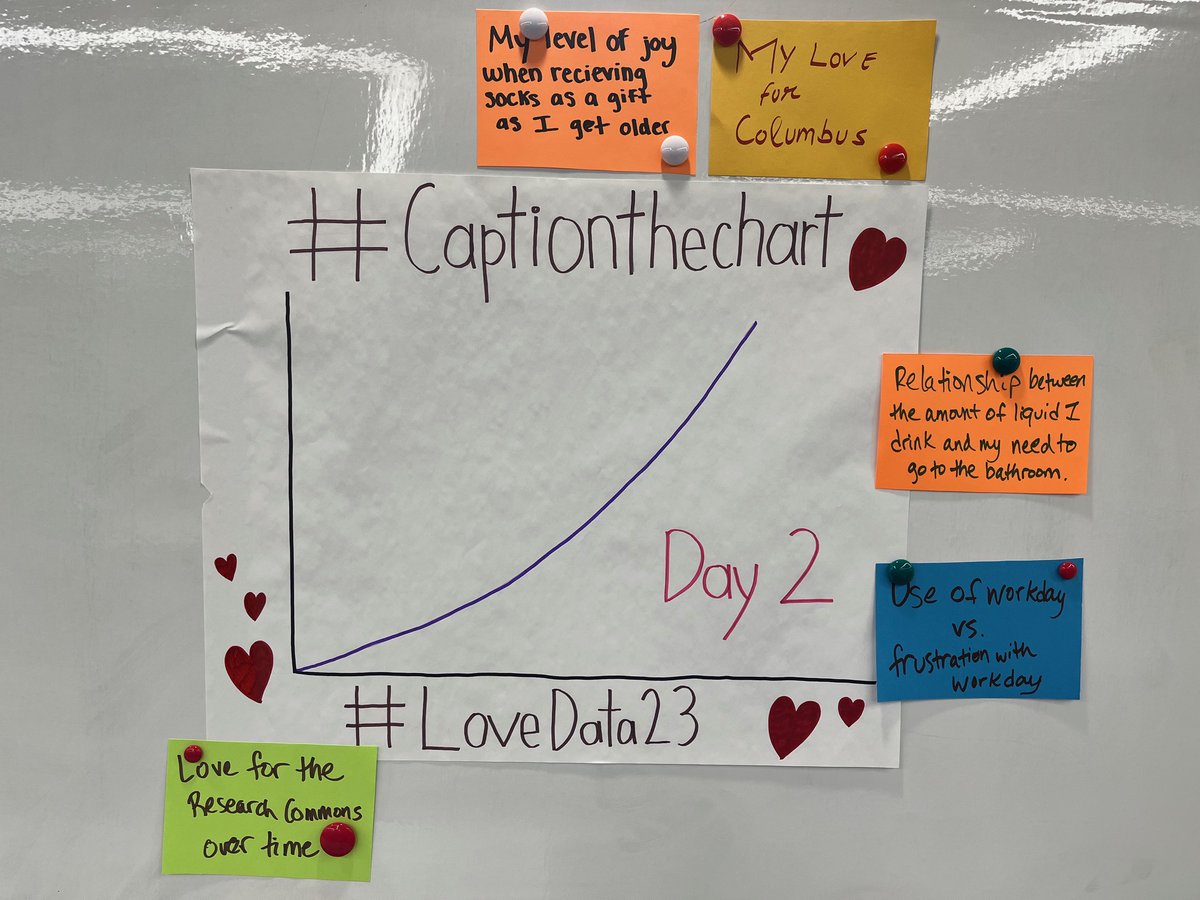
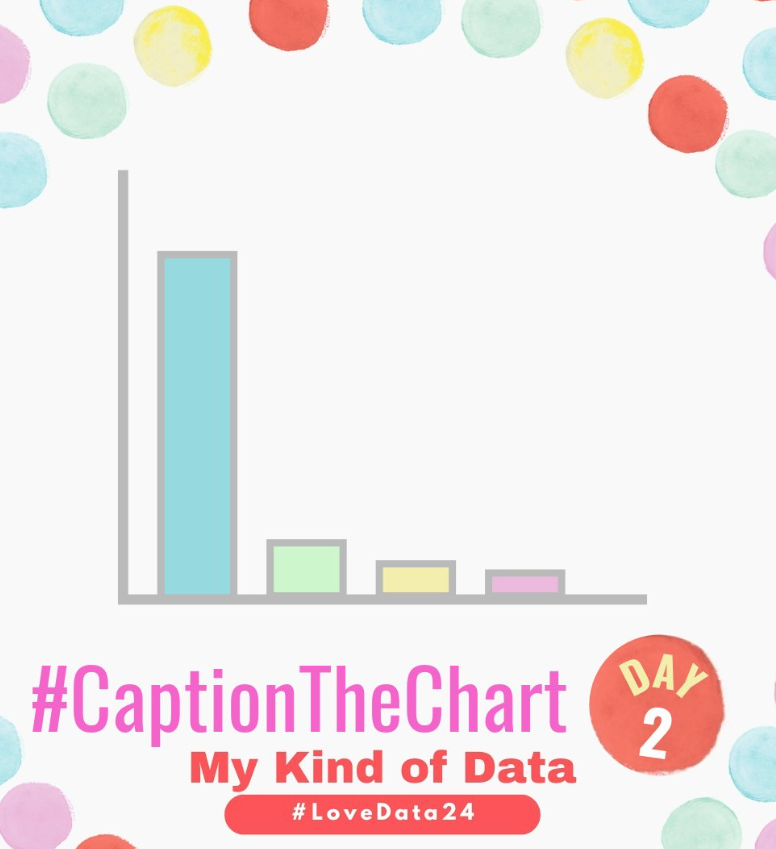
A new chart is up for day 2 of #CaptionTheChart. Stop by the library or reply to give us your best caption. @UMassChan @UMassChanGSBS @UMassMedPostDoc @umassmemorial #LoveData23
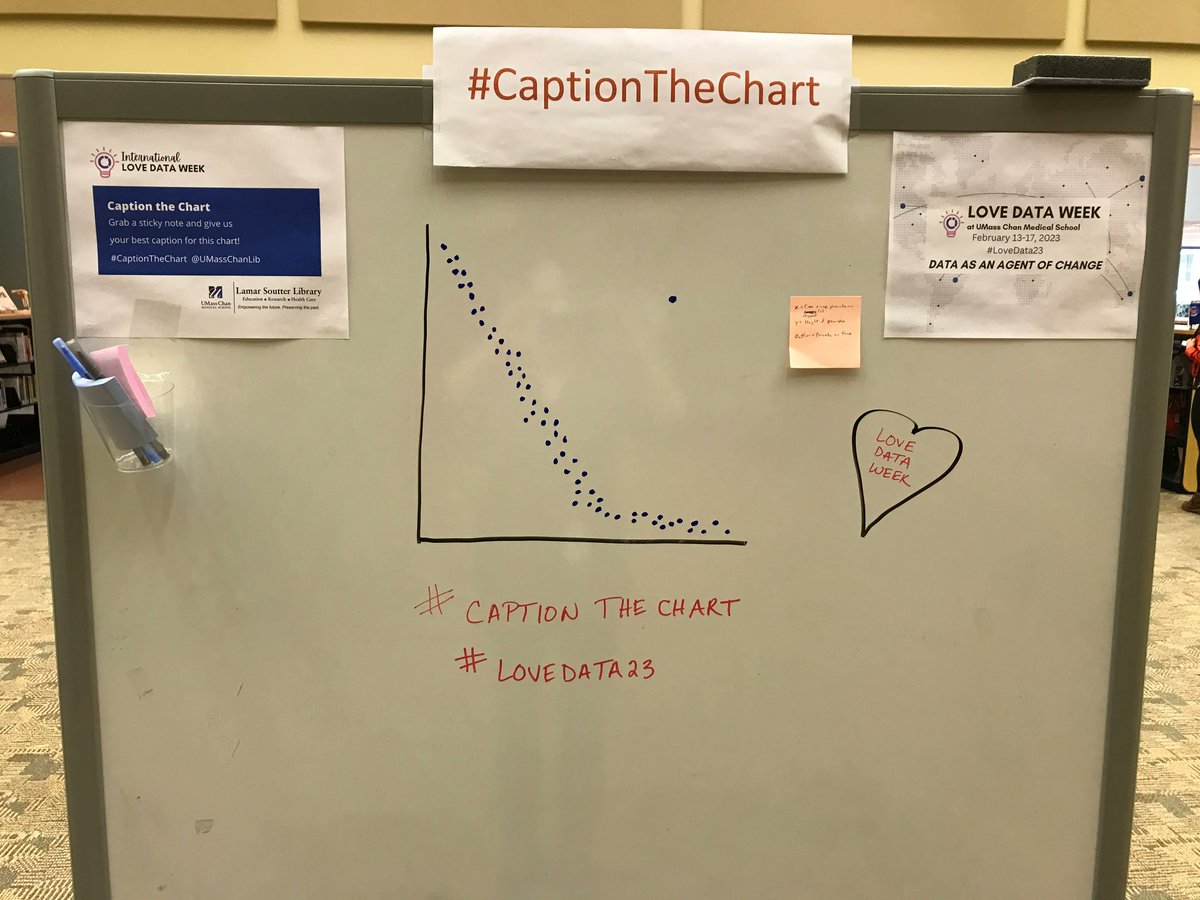
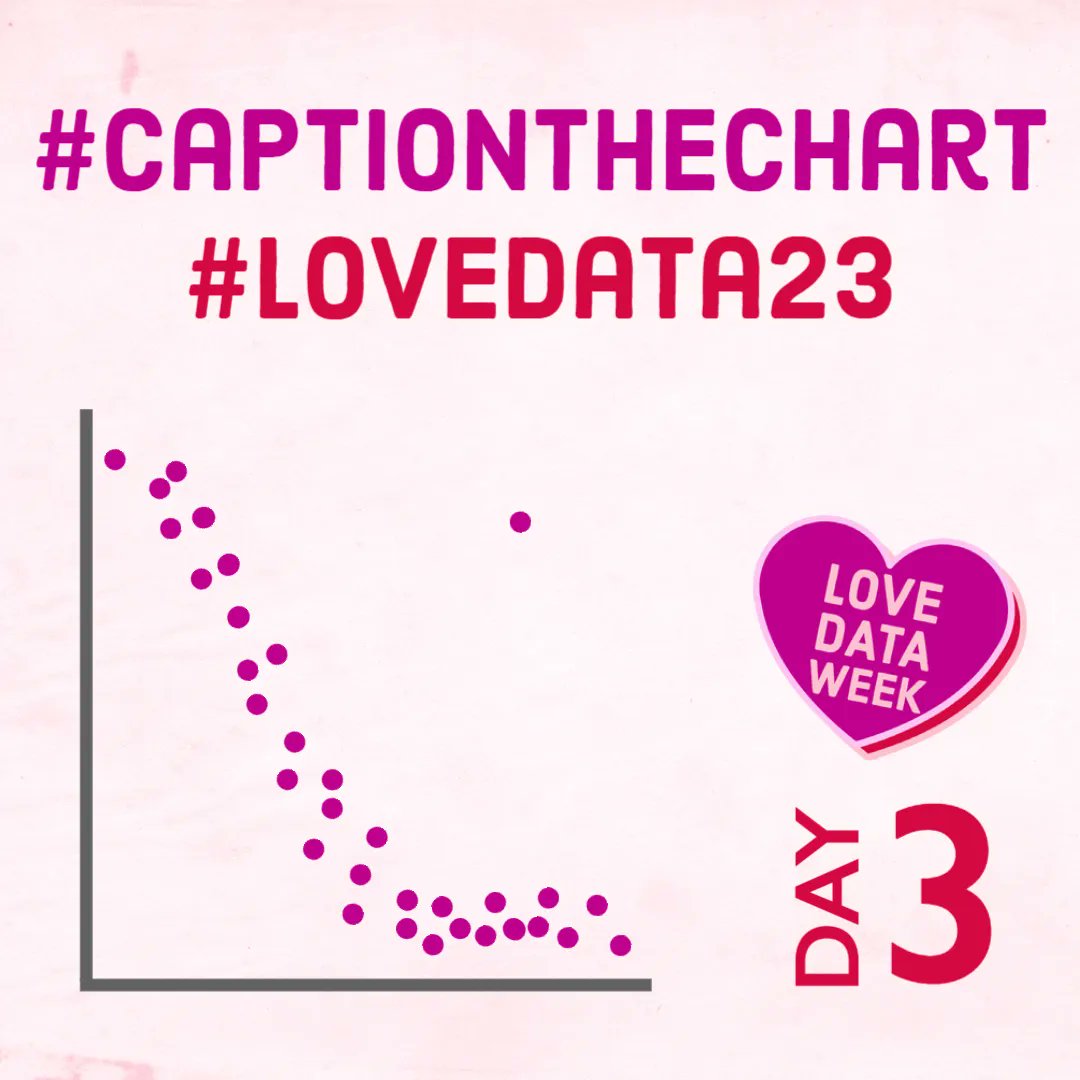
After our brief change of pace, we're back with Day 3 of #CaptionTheChart. Give us your best caption for this scatterplot with an outlier @UMassChan @umassmemorial @UMassChanGSBS @umassmemorial #LoveData23
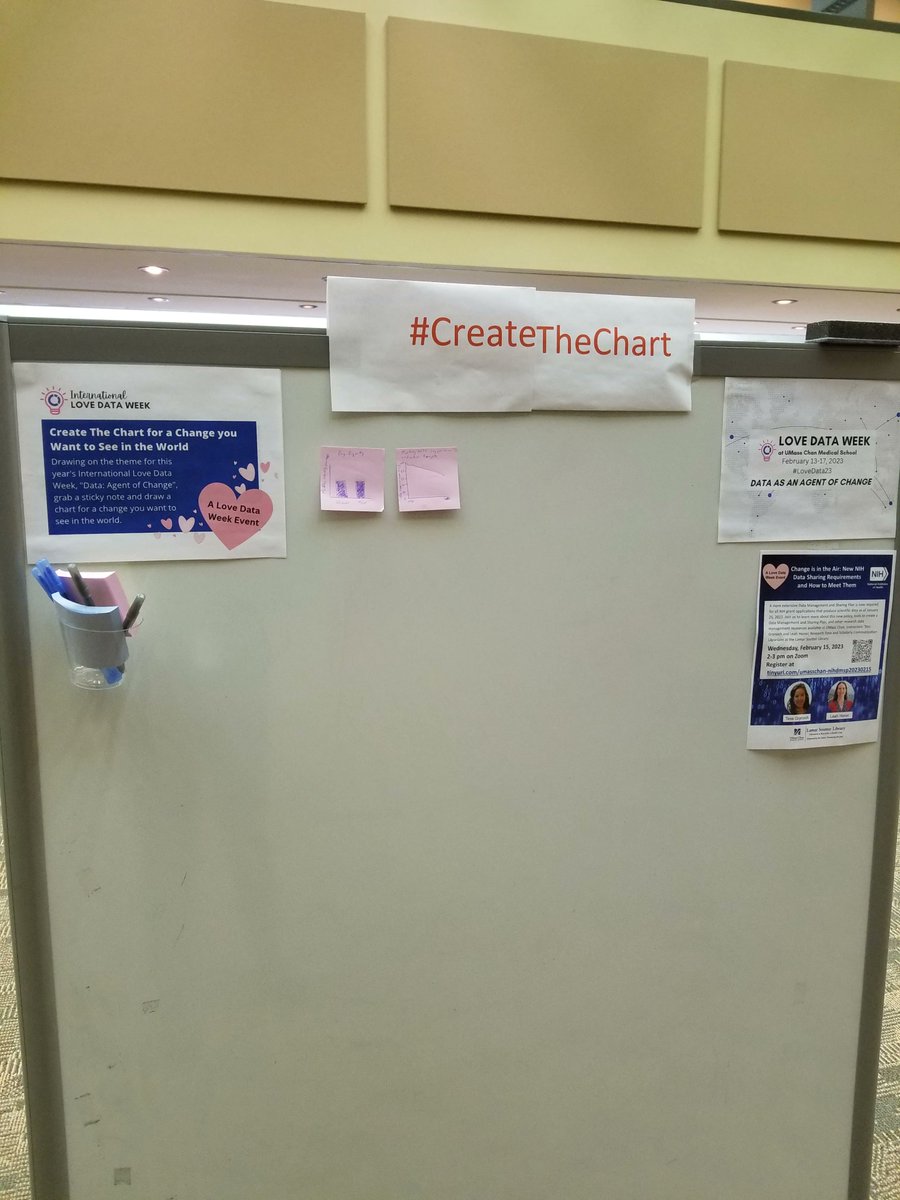
We're switching things up today, so instead of #CaptionTheChart we're drawing on the #LoveData23 theme, "Data: Agent of Change", and inviting you to #CreateTheChart of a change you want to see in the world. Post your chart on our whiteboard or reply with your chart. @UMassChan


It's the last day to #CaptiontheChart for #LoveData23. Stop by the Research Commons and add yours today!

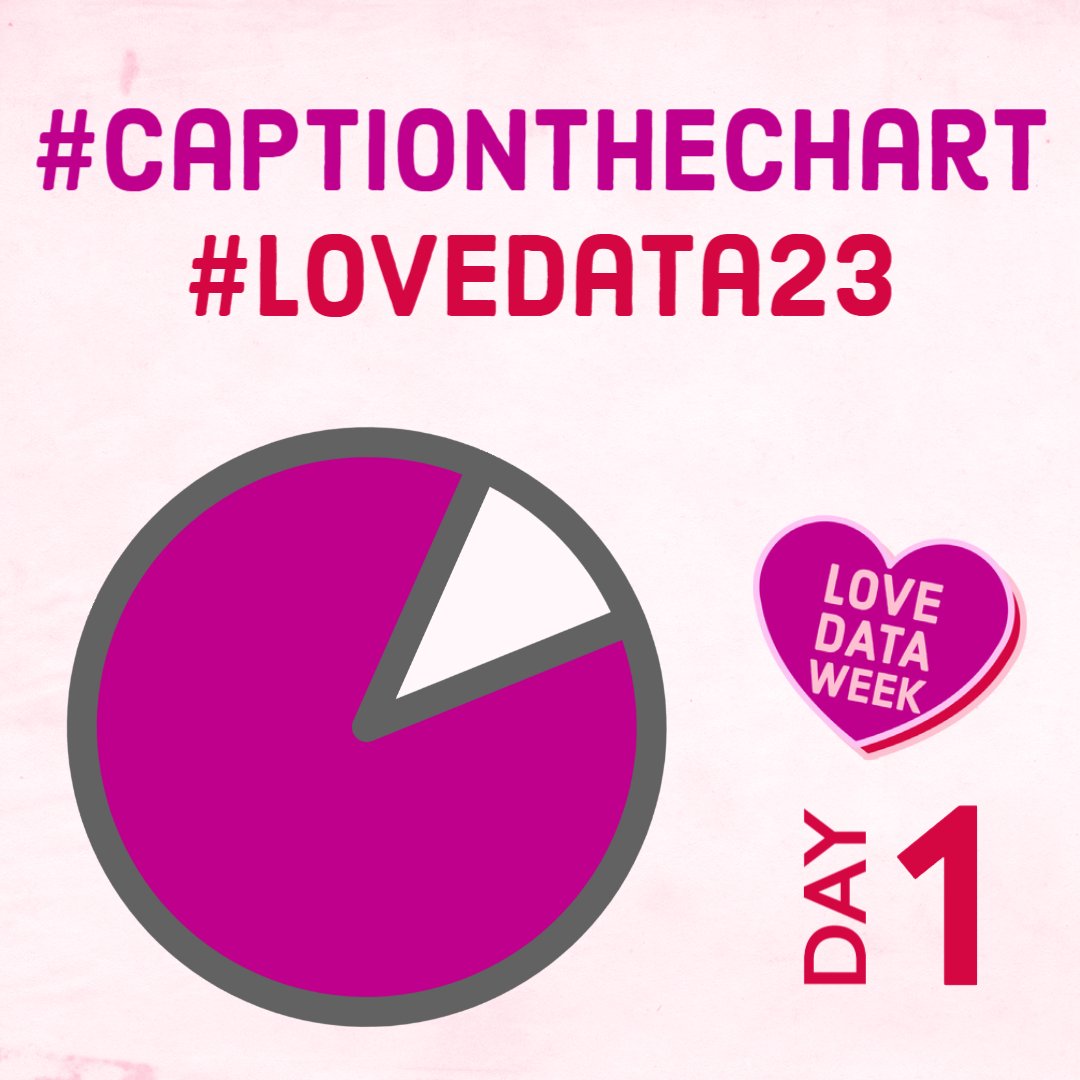
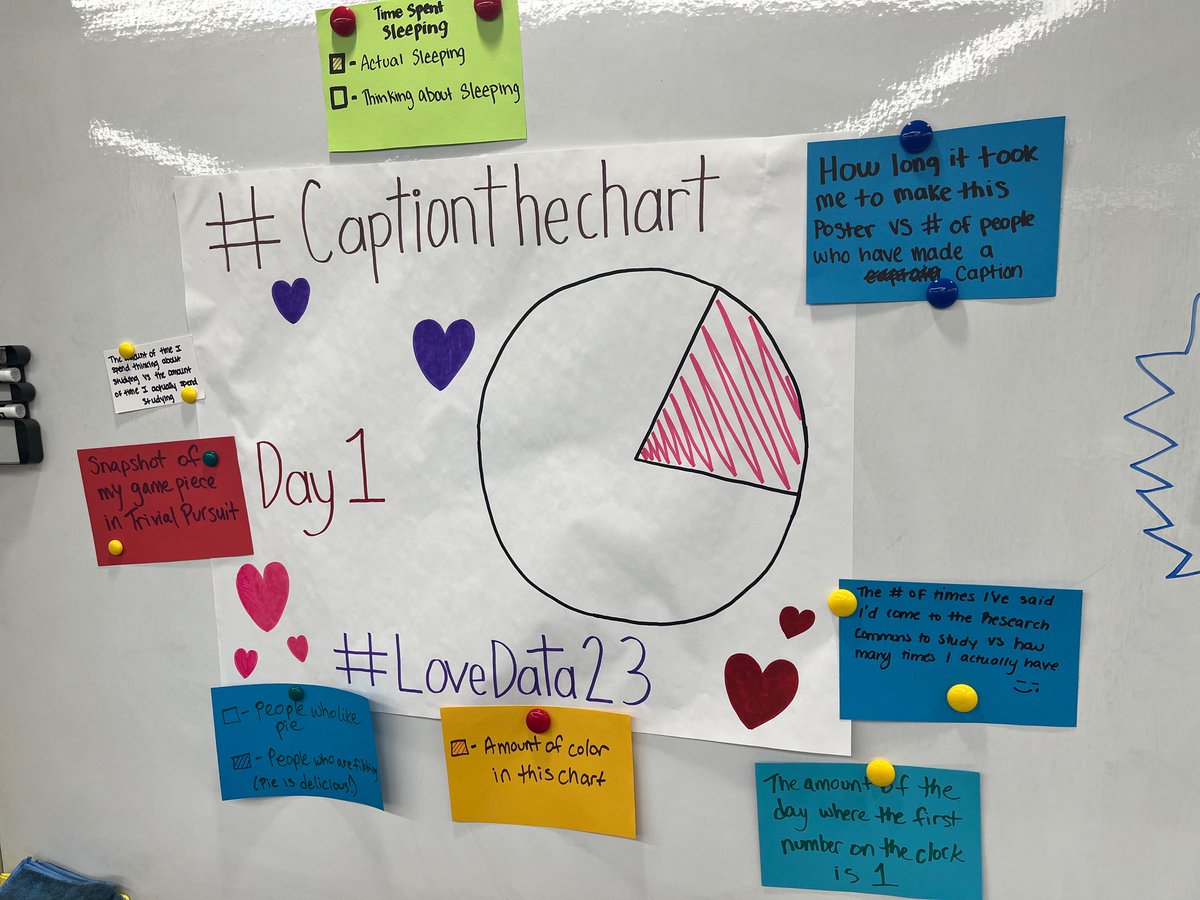
Kick off #LoveData23 with the #CaptionTheChart Challenge! See an example caption in the comments to get you started :) How would you caption the chart? Reply or share your captions with #CaptionTheChart

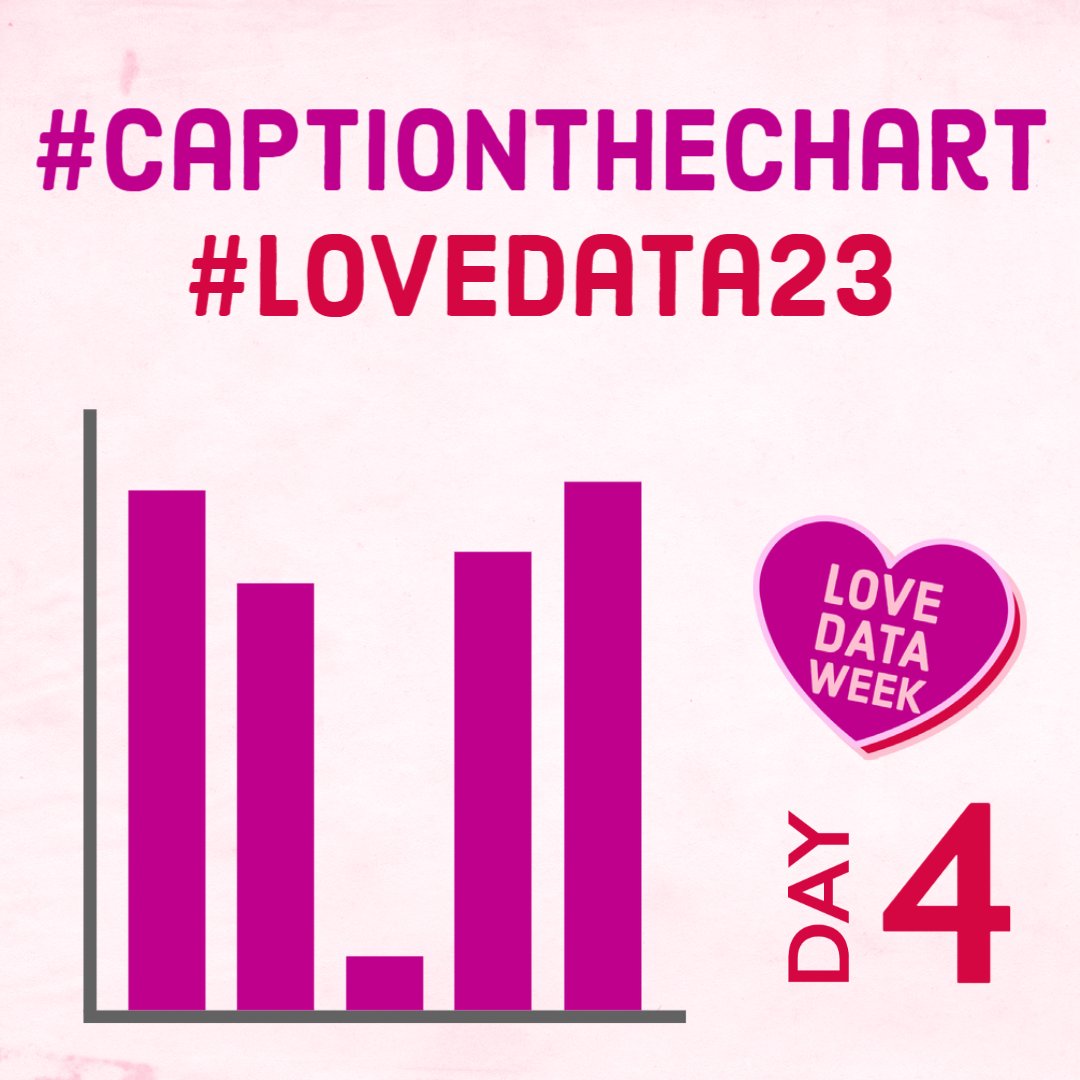
It is Day 4 of the Love Data Week #CaptionTheChart Challenge! How would you caption this chart? See our example caption in this thread. Reply or share your captions with #CaptionTheChart hashtag #LoveData23 #CaptionThis #DataViz

Happy #LoveData23 week! I hope you take some time to reflect on the importance of data ranging from collection to reporting! #CAPTIONTHECHART Time with Data: Cleaning (85%) vs Conducting Analysis (15%) Each day I will post some of my fav data things... Fav data source @ICPSR

Anyone else have a fun caption for today's #CaptionTheChart Challenge? #LoveData23
Time spent creating/cleaning/curating data (big piece) and time spent analyzing data (small piece) #LoveData23
It is Day 2 of the Love Data Week #CaptionTheChart Challenge! How would you caption this chart? Do agree with our example caption? "My level of excitement when receiving socks as a gift, as I age (i.e. overtime)." #LoveData23 #Data #ChartMemes #LoveDataWeek
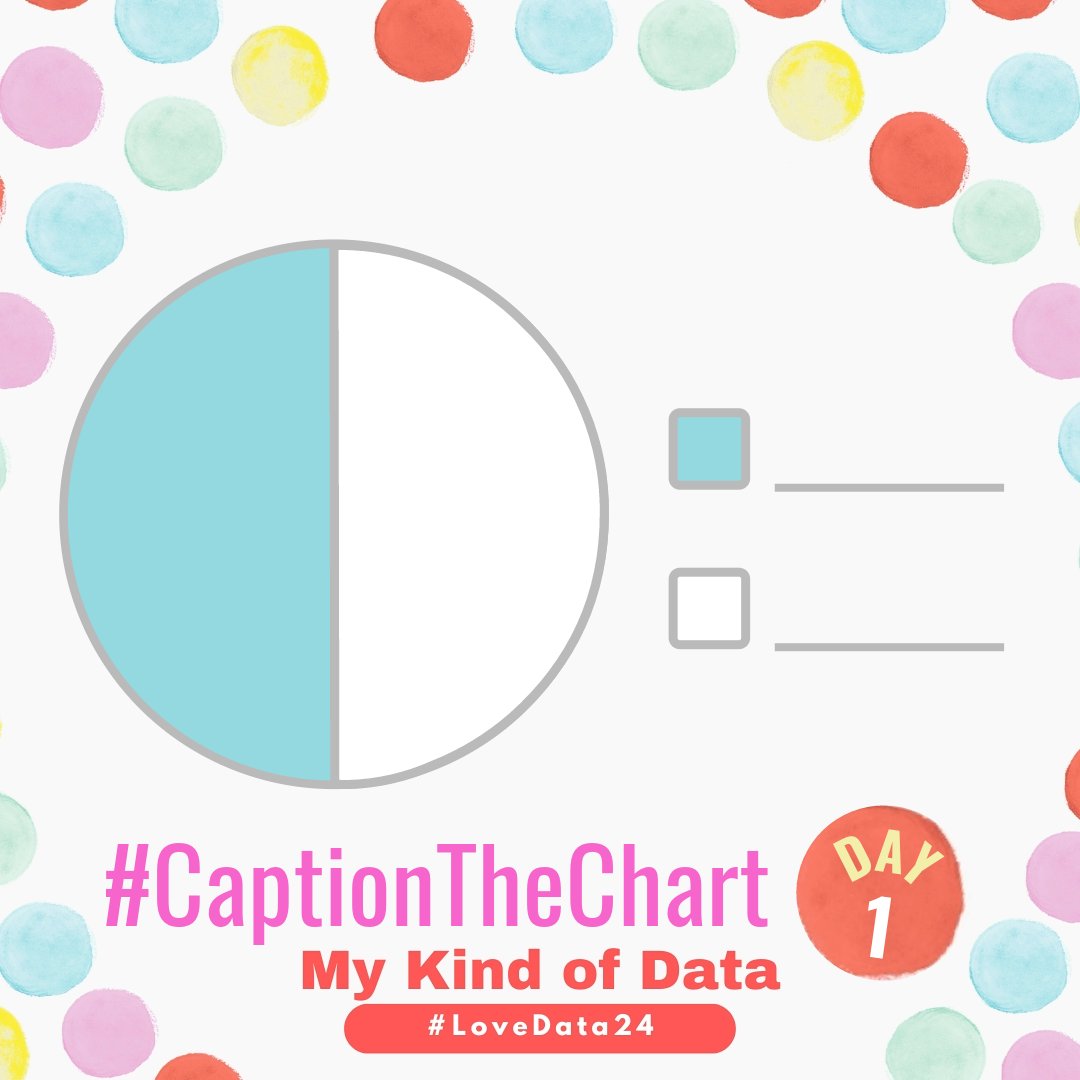
Kick off International Love Data Week with the #CaptionTheChart Challenge! See an example caption in the comments to get you started :) How would you caption the chart? Reply or share your captions with #CaptionTheChart #LoveData24 #LoveDataWeek #piechartmemes #CaptionThis


Kick off @LoveDataWeek with the #CaptionTheChart Challenge! For me this #piechart shows my feelings when someone brings me my fave chocolates: 50 percent EXCITEMENT - “yummy they are so delicious! 😍” 50 percent ACKNOWLEDGING - “oh dear there goes the diet for another week!🤷♀️


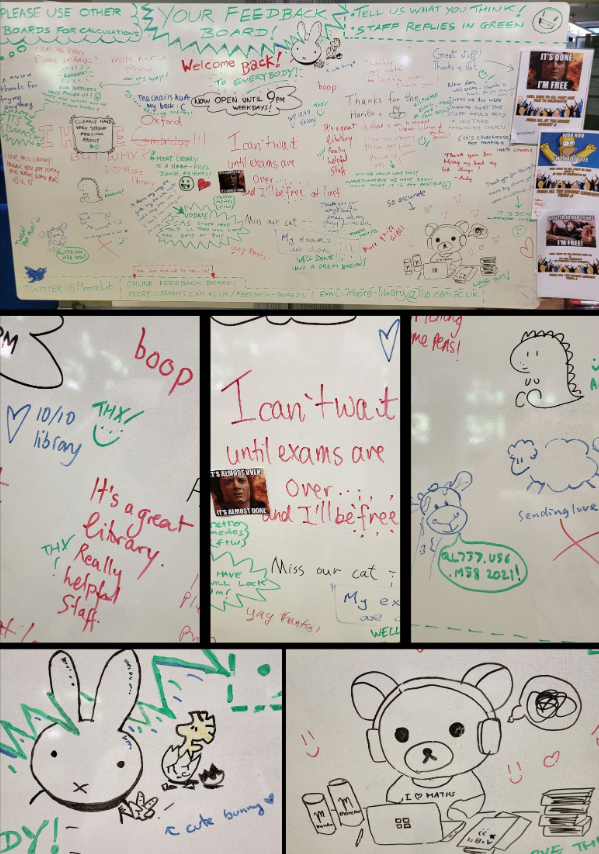
It's our #LoveDataWeek #captionthechart challenge! This chart could be an answer to the question "How orderly and/or logical were the @MooreLib Feedback boards during Academic year 2022-2023" #ChartMemes #LoveDataWeek #captionthis
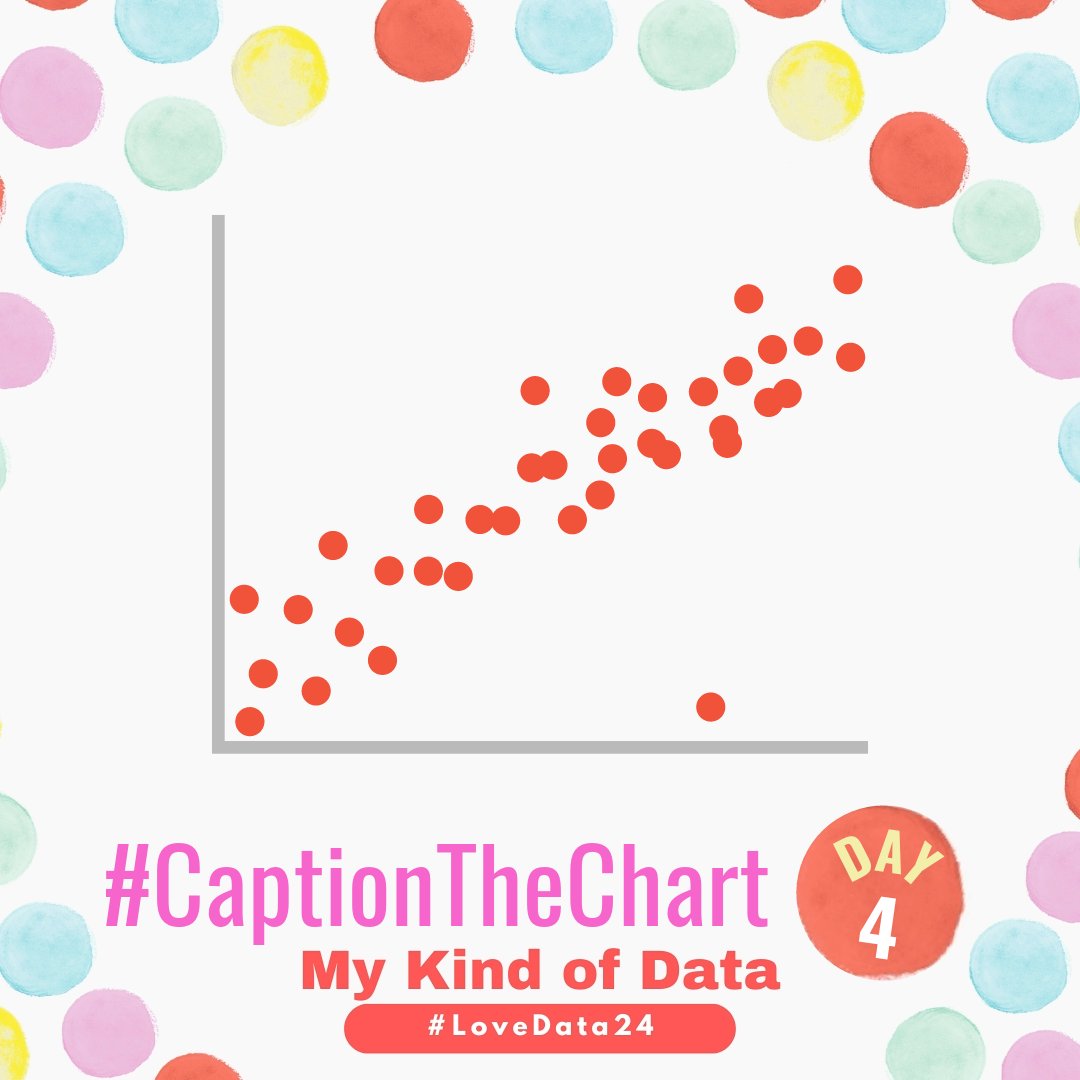
It is the last day of the Love Data Week #CaptionTheChart Challenge! How would you caption this chart? Be sure to share your caption with #captionthechart or in the comments 📈❤️ #LoveData24 #Data #ChartMemes #LoveDataWeek #caption #captionthis #scatterplot #dataviz
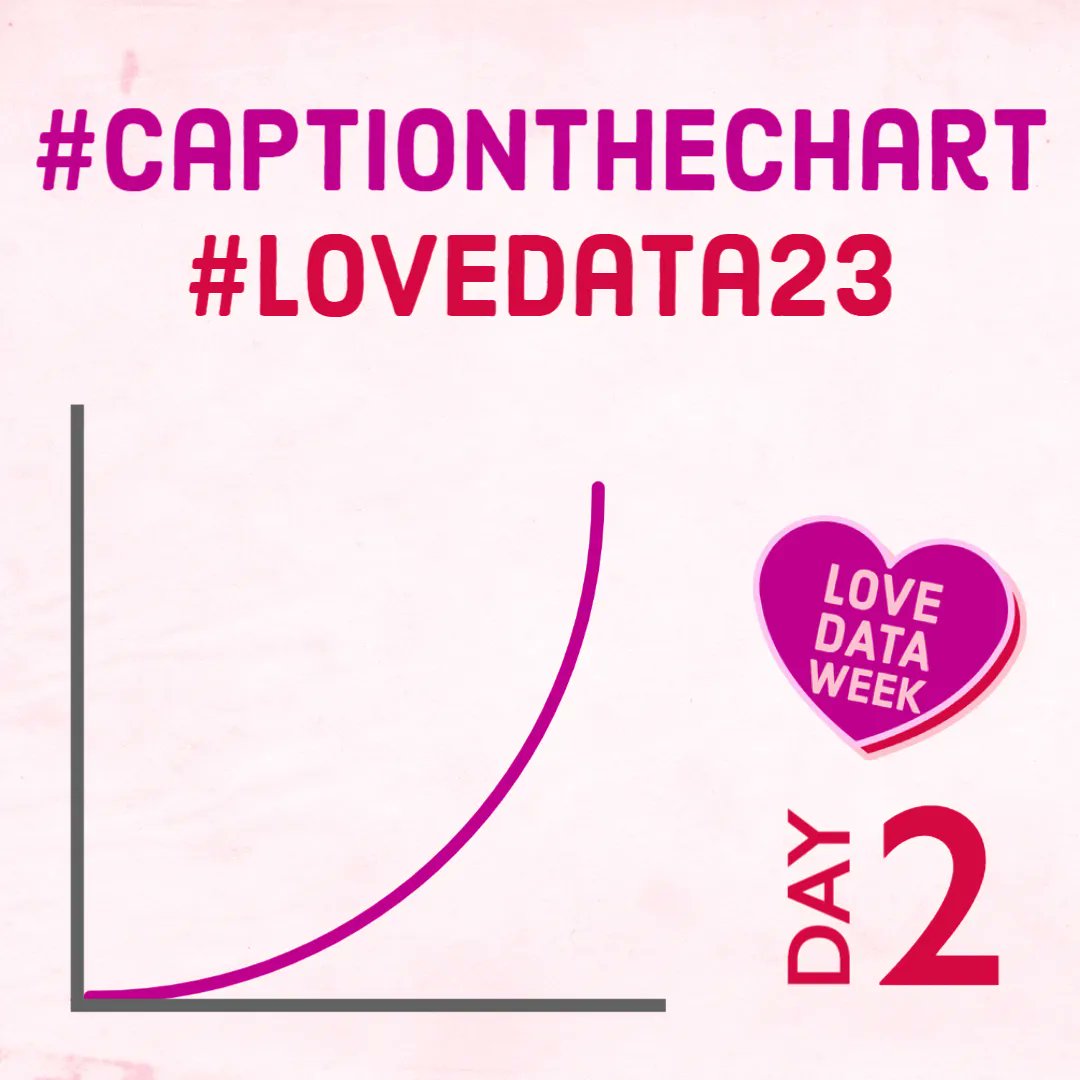
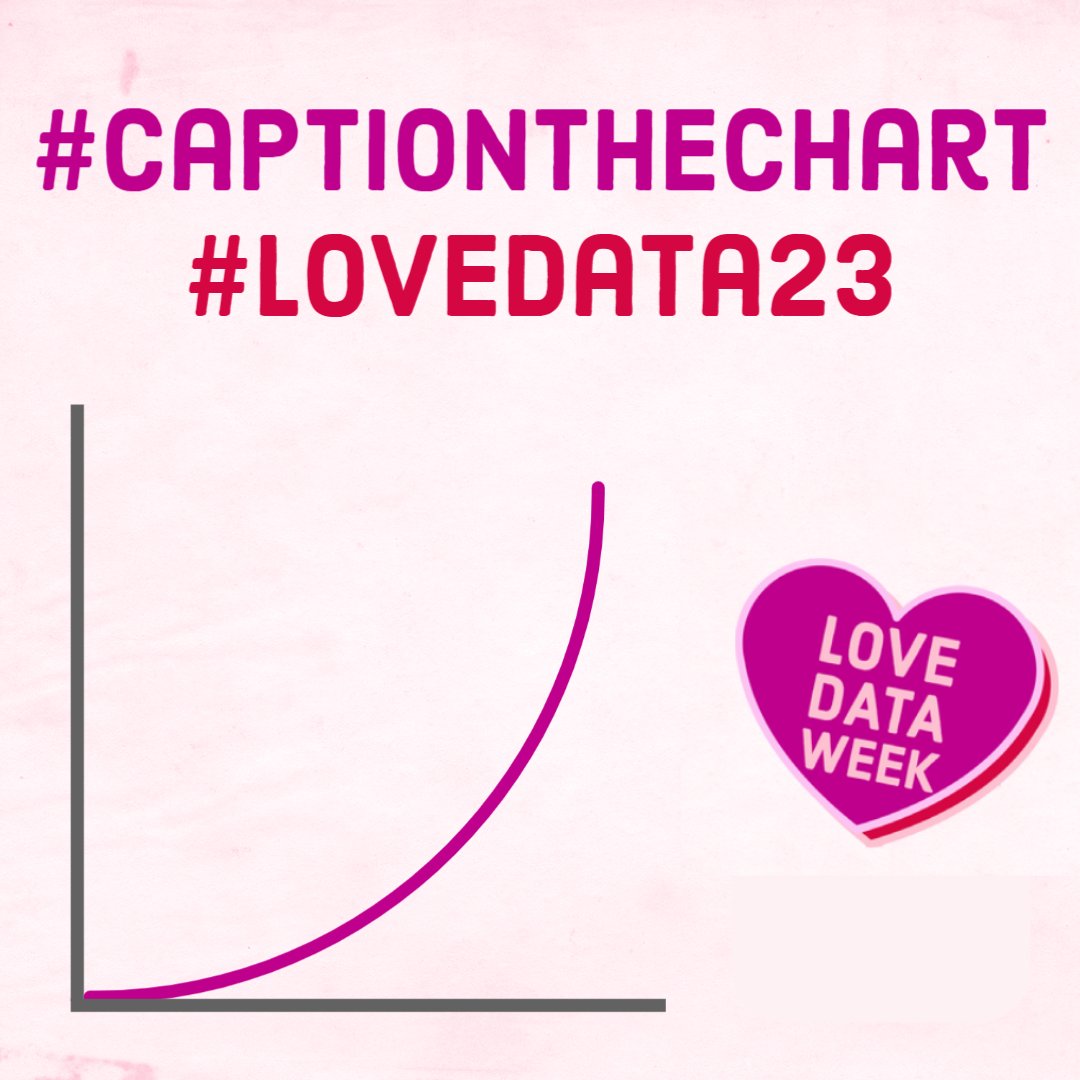
It's International Love Data Week, and we're playing the Caption the Chart challenge. How would you caption this exponential line chart? Submit your ideas in the comments! A roundup of data resources >> ow.ly/X08050MRcoa #CaptionTheChart #LoveData23 #DataLovingMarketer

My caption: An oxymoron. 50% bitter and 50% sweet. #CaptionTheChart #LoveData24
Kick off International Love Data Week with the #CaptionTheChart Challenge! See an example caption in the comments to get you started :) How would you caption the chart? Reply or share your captions with #CaptionTheChart #LoveData24 #LoveDataWeek #piechartmemes #CaptionThis

Happy #lovedataweek everyone! Stop by the library to check out our #captionthechart activities throughout the week! Check out our blog for more information! buff.ly/3pMqvfK #UNDproud #chesterfritzlibrary

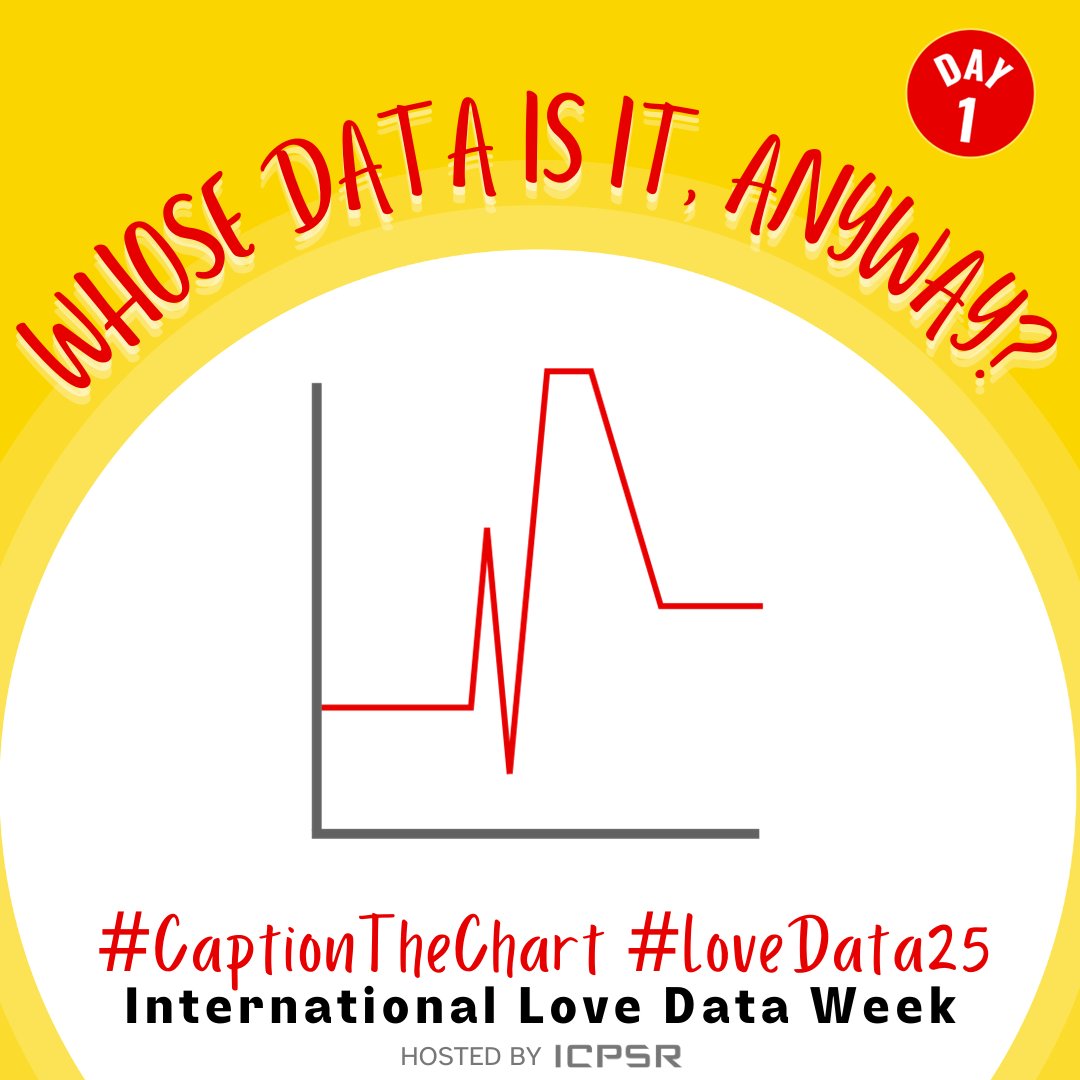
It is Love Data Week at WKU Libraries! Charts and graphs can have various meanings, even if they look the same. Take a look at today's line chart and give us a caption for it. What do you think it could represent? #WKU #LoveData25 #CaptionTheChart
No rest for snow shovelers in Montréal. Homeowners removing snow from tempo roofs on weekends after walking paths, stairs, and driving lanes are cleared. Sun offers some respite during the week. X axis = Days of the week. Y axis = Hours removing snow. #CaptionTheChart #LoveData25
It is Love Data Week at WKU Libraries! Charts and graphs can have various meanings, even if they look the same. Take a look at today's line chart and give us a caption for it. What do you think it could represent? #WKU #LoveData25 #CaptionTheChart
It is Love Data Week at WKU Libraries! Charts and graphs can have various meanings, even if they look the same. Take a look at today's line chart and give us a caption for it. What do you think it could represent? #WKU #LoveData25 #CaptionTheChart

It is the last day of the Love Data Week #CaptionTheChart Challenge! How would you caption this chart? Be sure to share your caption with #captionthechart or in the comments ❤️ #LoveData24 #Data #ChartMemes #LoveDataWeek #caption #captionthis #scatterplot #dataviz

It is the last day of the Love Data Week #CaptionTheChart Challenge! How would you caption this chart? Be sure to share your caption with #captionthechart or in the comments 📈❤️ #LoveData24 #Data #ChartMemes #LoveDataWeek #caption #captionthis #scatterplot #dataviz
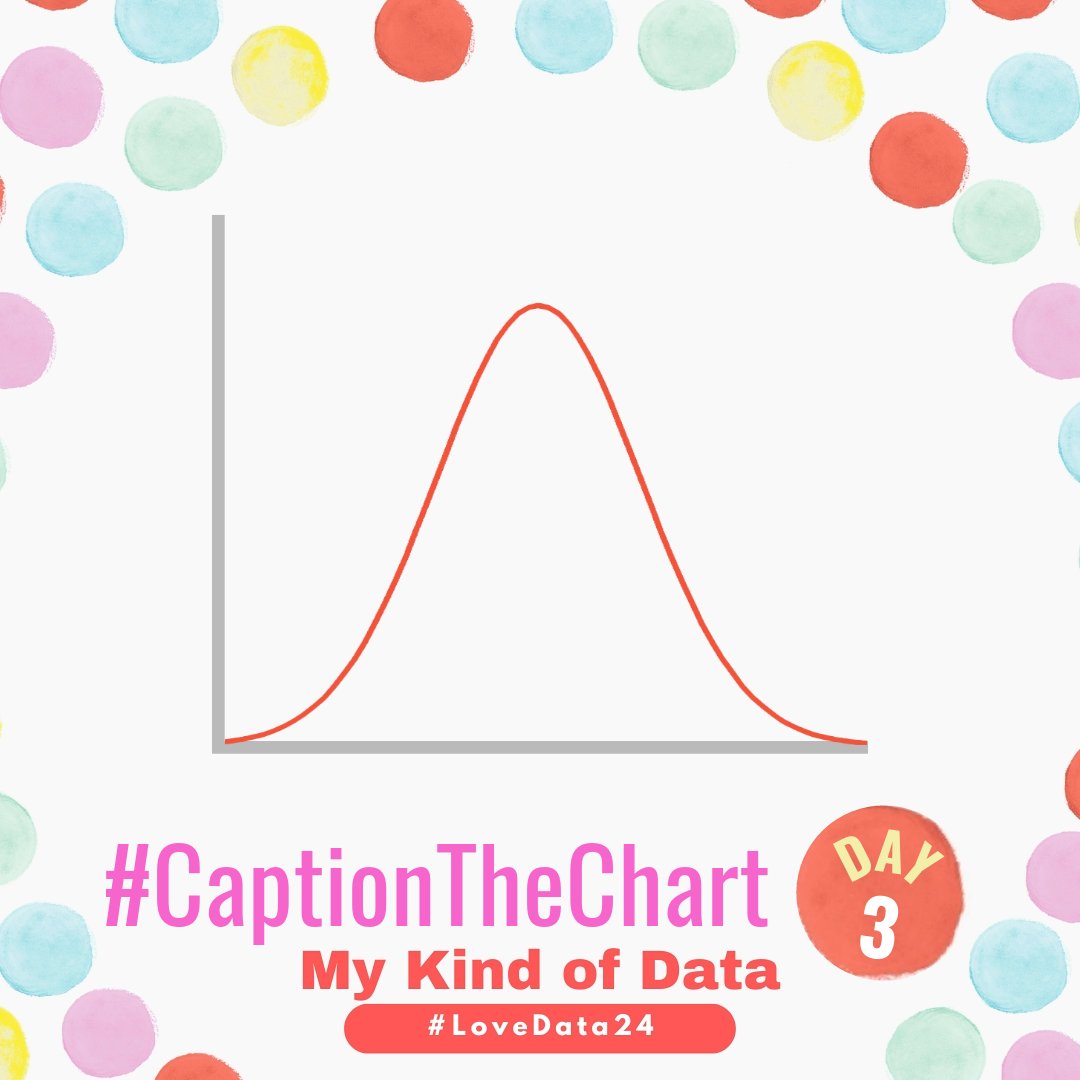
It is Day 3 of the Love Data Week #CaptionTheChart Challenge! How would you caption this chart? Be sure to share your caption with #captionthechart or in the comments ❤️ #LoveData24 #Data #ChartMemes #LoveDataWeek

It is Day 3 of the Love Data Week #CaptionTheChart Challenge! How would you caption this chart? Be sure to share your caption with #captionthechart or in the comments ❤️ #LoveData24 #Data #ChartMemes #LoveDataWeek #captionthis
It's our #LoveDataWeek #captionthechart challenge! This chart could be an answer to the question "How orderly and/or logical were the @MooreLib Feedback boards during Academic year 2022-2023" #ChartMemes #LoveDataWeek #captionthis
Do agree with our example caption? My belief that I would become an archaeologist and find dinosaur bones in my own backyard! Bar 1: Elementary school, Bar 2: Middle School, Bar 3: High School, Bar 4: College #CaptionTheChart #LoveData24 #ChartMemes #LoveDataWeek #captionthis
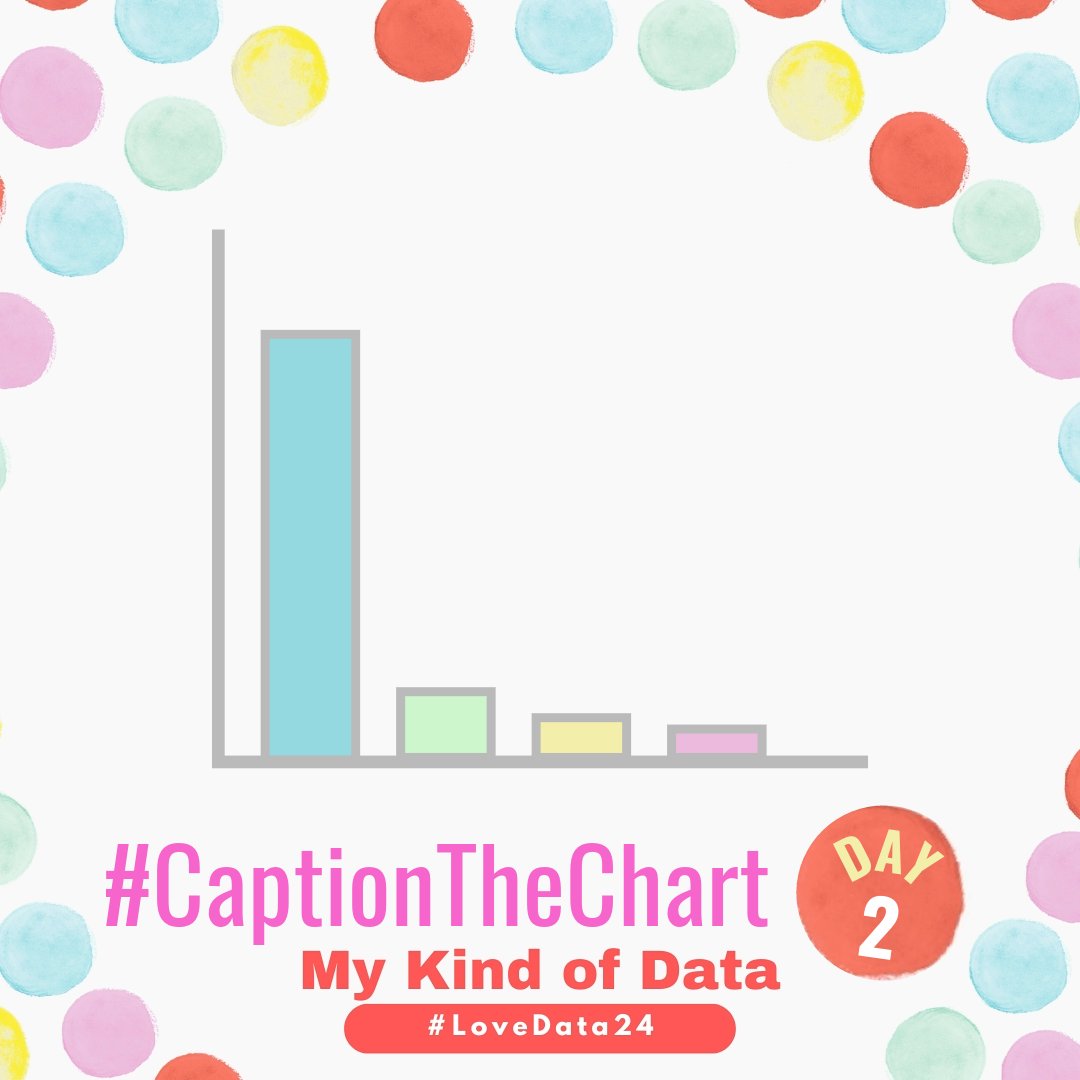
It is Day 2 of the Love Data Week #CaptionTheChart Challenge! How would you caption this chart? Example caption in comments. Be sure to share your caption with #captionthechart or in the comments ❤️ #LoveData24 #Data #ChartMemes #LoveDataWeek
Do agree with our example caption? My belief that I would become an archaeologist and find dinosaur bones in my own backyard! Bar 1: Elementary school, Bar 2: Middle School, Bar 3: High School, Bar 4: College #CaptionTheChart #LoveData24 #ChartMemes #LoveDataWeek #captionthis
It is Day 2 of the Love Data Week #CaptionTheChart Challenge! How would you caption this chart? Example caption in comments. Be sure to share your caption with #captionthechart or in the comments ❤️ #LoveData24 #Data #ChartMemes #LoveDataWeek

My caption: An oxymoron. 50% bitter and 50% sweet. #CaptionTheChart #LoveData24
Kick off International Love Data Week with the #CaptionTheChart Challenge! See an example caption in the comments to get you started :) How would you caption the chart? Reply or share your captions with #CaptionTheChart #LoveData24 #LoveDataWeek #piechartmemes #CaptionThis
Kick off @LoveDataWeek with the #CaptionTheChart Challenge! For me this #piechart shows my feelings when someone brings me my fave chocolates: 50 percent EXCITEMENT - “yummy they are so delicious! 😍” 50 percent ACKNOWLEDGING - “oh dear there goes the diet for another week!🤷♀️
Happy #lovedataweek everyone! Stop by the library to check out our #captionthechart activities throughout the week! Check out our blog for more information! buff.ly/3pMqvfK #UNDproud #chesterfritzlibrary
My feelings when someone brings me my fave chocolates: 50 percent EXCITEMENT - “yummy they are so delicious! 😍” 50 percent ACKNOWLEDGING - “oh dear there goes the diet for another week 📷” #CaptionTheChart #LoveData24 #PieChart
How confident I felt about either team winning the Super Bowl during the 4th quarter/OT. #CaptionTheChart #lovedata24 #superbowl #overtime
Kick off International Love Data Week with the #CaptionTheChart Challenge! See an example caption in the comments to get you started :) How would you caption the chart? Reply or share your captions with #CaptionTheChart #LoveData24 #LoveDataWeek #piechartmemes #CaptionThis
when it starts to snow: 50 percent EXCITEMENT - “it is so beautiful! 😍” 50 percent ANNOYANCE - “ugghh I don’t want to shovel 😫” #CaptionTheChart #LoveData24 #PieChart
Kick off @LoveDataWeek with the #CaptionTheChart Challenge! How would you caption the chart? Reply or share your captions with #CaptionTheChart #LoveData24 See an example caption in the comments to get you started :) #LoveDataWeek #piechartmemes #piechart #CaptionThis
My feelings when it starts to snow: 50 percent EXCITEMENT - “it is so beautiful! 😍” 50 percent ANNOYANCE - “ugghh I don’t want to shovel 😫” #CaptionTheChart #LoveData24 #PieChart
Kick off International Love Data Week with the #CaptionTheChart Challenge! See an example caption in the comments to get you started :) How would you caption the chart? Reply or share your captions with #CaptionTheChart #LoveData24 #LoveDataWeek #piechartmemes #CaptionThis
A new chart is up for day 2 of #CaptionTheChart. Stop by the library or reply to give us your best caption. @UMassChan @UMassChanGSBS @UMassMedPostDoc @umassmemorial #LoveData23
Today's #CaptionTheChart is on display now at the library's front entrance. Come give us your best caption or tweet your caption to us. #LoveData23 @UMassChan @UMassChanGSBS @UMassMedPostDoc @umassmemorial
After our brief change of pace, we're back with Day 3 of #CaptionTheChart. Give us your best caption for this scatterplot with an outlier @UMassChan @umassmemorial @UMassChanGSBS @umassmemorial #LoveData23
We're switching things up today, so instead of #CaptionTheChart we're drawing on the #LoveData23 theme, "Data: Agent of Change", and inviting you to #CreateTheChart of a change you want to see in the world. Post your chart on our whiteboard or reply with your chart. @UMassChan
It's International Love Data Week, and we're playing the Caption the Chart challenge. How would you caption this exponential line chart? Submit your ideas in the comments! A roundup of data resources >> ow.ly/X08050MRcoa #CaptionTheChart #LoveData23 #DataLovingMarketer
It's the last day to #CaptiontheChart for #LoveData23. Stop by the Research Commons and add yours today!
It is Love Data Week at WKU Libraries! Charts and graphs can have various meanings, even if they look the same. Take a look at today's line chart and give us a caption for it. What do you think it could represent? #WKU #LoveData25 #CaptionTheChart
Happy #lovedataweek everyone! Stop by the library to check out our #captionthechart activities throughout the week! Check out our blog for more information! buff.ly/3pMqvfK #UNDproud #chesterfritzlibrary
Happy #LoveData23 week! I hope you take some time to reflect on the importance of data ranging from collection to reporting! #CAPTIONTHECHART Time with Data: Cleaning (85%) vs Conducting Analysis (15%) Each day I will post some of my fav data things... Fav data source @ICPSR
Kick off @LoveDataWeek with the #CaptionTheChart Challenge! For me this #piechart shows my feelings when someone brings me my fave chocolates: 50 percent EXCITEMENT - “yummy they are so delicious! 😍” 50 percent ACKNOWLEDGING - “oh dear there goes the diet for another week!🤷♀️
Kick off #LoveData23 with the #CaptionTheChart Challenge! See an example caption in the comments to get you started :) How would you caption the chart? Reply or share your captions with #CaptionTheChart
Anyone else have a fun caption for today's #CaptionTheChart Challenge? #LoveData23
Time spent creating/cleaning/curating data (big piece) and time spent analyzing data (small piece) #LoveData23
It is the last day of the Love Data Week #CaptionTheChart Challenge! How would you caption this chart? Be sure to share your caption with #captionthechart or in the comments ❤️ #LoveData24 #Data #ChartMemes #LoveDataWeek #caption #captionthis #scatterplot #dataviz
It's our #LoveDataWeek #captionthechart challenge! This chart could be an answer to the question "How orderly and/or logical were the @MooreLib Feedback boards during Academic year 2022-2023" #ChartMemes #LoveDataWeek #captionthis
It is Day 2 of the Love Data Week #CaptionTheChart Challenge! How would you caption this chart? Do agree with our example caption? "My level of excitement when receiving socks as a gift, as I age (i.e. overtime)." #LoveData23 #Data #ChartMemes #LoveDataWeek
It is Day 4 of the Love Data Week #CaptionTheChart Challenge! How would you caption this chart? See our example caption in this thread. Reply or share your captions with #CaptionTheChart hashtag #LoveData23 #CaptionThis #DataViz
It is the last day of the Love Data Week #CaptionTheChart Challenge! How would you caption this chart? Be sure to share your caption with #captionthechart or in the comments 📈❤️ #LoveData24 #Data #ChartMemes #LoveDataWeek #caption #captionthis #scatterplot #dataviz
Kick off International Love Data Week with the #CaptionTheChart Challenge! See an example caption in the comments to get you started :) How would you caption the chart? Reply or share your captions with #CaptionTheChart #LoveData24 #LoveDataWeek #piechartmemes #CaptionThis
It is Day 2 of the Love Data Week #CaptionTheChart Challenge! How would you caption this chart? Do agree with our example caption? "My level of excitement when receiving socks as a gift, as I age (i.e. over time)." #LoveData23 #Data #LoveDataWeek #exponential #captionthis

Something went wrong.
Something went wrong.
United States Trends
- 1. #GivingTuesday 25.5K posts
- 2. #twitchrecap 7,061 posts
- 3. Larry 39.6K posts
- 4. Costco 50.9K posts
- 5. #AppleMusicReplay 9,320 posts
- 6. So 79% 1,550 posts
- 7. Cabinet 57.7K posts
- 8. Jared Curtis 2,811 posts
- 9. #DragRace 5,907 posts
- 10. NextNRG Inc. 3,102 posts
- 11. #SleighYourHolidayGiveaway N/A
- 12. Susan Dell 6,442 posts
- 13. Carton 29.3K posts
- 14. Sabrina Carpenter 29.6K posts
- 15. Lucario 28.5K posts
- 16. WFAN N/A
- 17. King Von 1,851 posts
- 18. Punk and AJ 2,950 posts
- 19. Tiki 2,896 posts
- 20. BT and Sal N/A