#complexheatmap search results

PyComplexHeatmap: A Python package to visualize multimodal genomics data onlinelibrary.wiley.com/doi/full/10.10… #Bioinformatics #Python #ComplexHeatmap #Heatmap #visualization #DataScience @wileymicrobio @wileyinresearch @WileyBiomedical


Working on interactive #ComplexHeatmap 😎. Now it includes annotations for the sub-heatmap and keeps the decoration on heatmap cells.


Legends are automatically adjusted according to the device size when resizing the device. Long-standing problem solved! Thanks to grDevices::recordGraphics() function! just discovered today. #ComplexHeatmap

We linked data-driven spatial domains, and cell type population back to established anatomy of the tissue with spatial registration 🔗 with tools from #spatialLIBD #Rstats @Bioconductor and built some extra complex #ComplexHeatmap 🫶 @jokergoo_gu


with the helps of #ggtree, we are able to align subplots properly. Alternative way to #complexHeatmap, #Gviz and #karyoploter for visualizing several associated datasets. yulab-smu.github.io/treedata-book/…

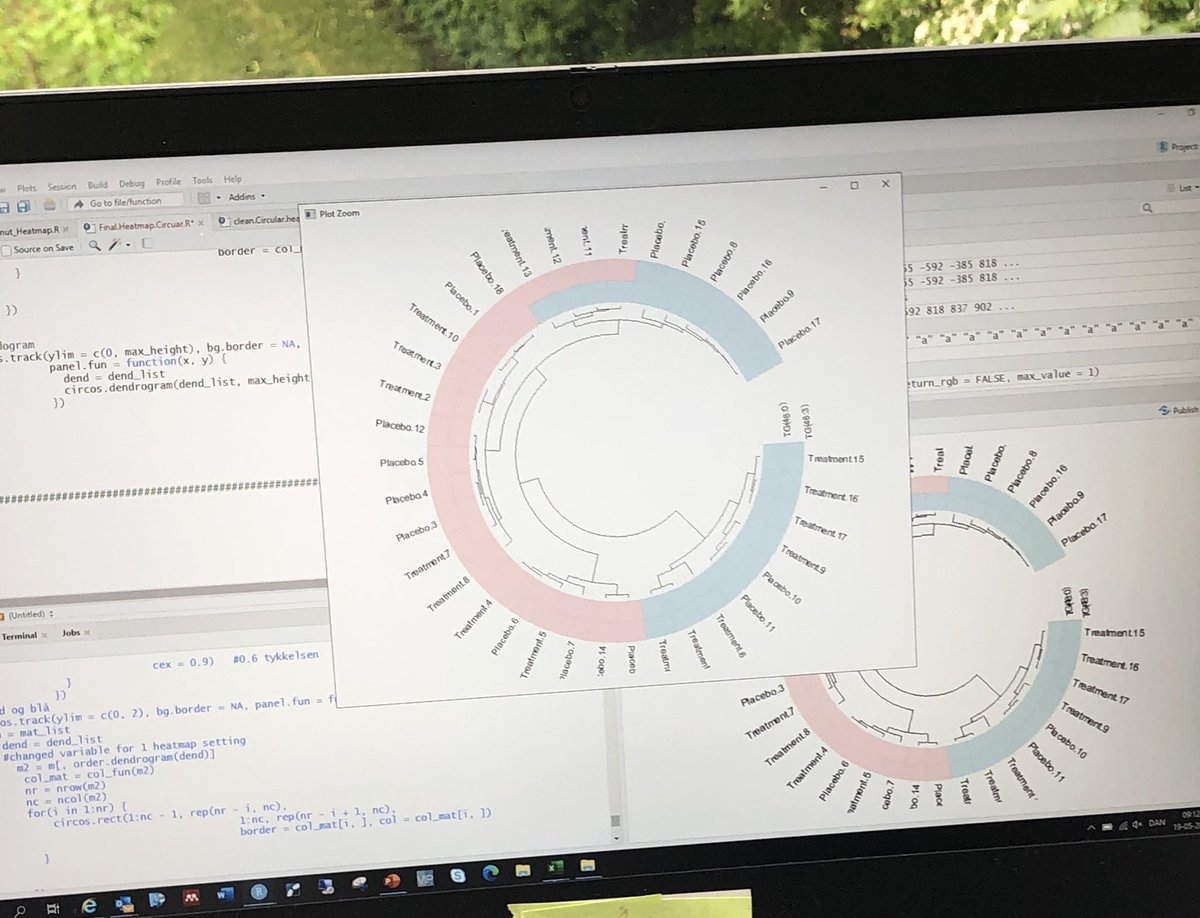
#ComplexHeatmap with 🍩 shape as my PI @DrLegidoQuigley requested! It only took me ♾ hours figuring out how to create it❕👩🏻💻⏳🌘 #WomenInDataScience #rstats #R #phdvoice #MassSpec #lipidomics #FavoriteFigure #womenintech🤍💙


I knew the new R version will come with new issues 😰. This is a heatmap with the new and the previous version of R dividing in clades a heatmap. Any suggestion to correct this issue? #RStats #ComplexHeatmap


Upcoming work. Although the web has a huge metabolomics flavor, I will add content about amplicon metagenomics (16s). For example, how to produce these plots. #ComplexHeatmap (6/6)

In #ComplexHeatmap, a HeatmapAnnotation object can be thought as a virtual data frame, thus, you can subset annotations, like `anno[, c(name1, name2)]`. This feature might be helpful when developing Shiny apps where users can select a subset of annotations for heatmaps.
![jokergoo_gu's tweet image. In #ComplexHeatmap, a HeatmapAnnotation object can be thought as a virtual data frame, thus, you can subset annotations, like `anno[, c(name1, name2)]`.
This feature might be helpful when developing Shiny apps where users can select a subset of annotations for heatmaps.](https://pbs.twimg.com/media/FN1w1j4XoBE9EDE.jpg)

PyComplexHeatmap: A Python package to visualize multimodal genomics data @iMetaScience onlinelibrary.wiley.com/doi/10.1002/im… #Bioinformatics #Python #ComplexHeatmap #Heatmap #visualization #DataScience @wileymicrobio @wileyinresearch @WileyBiomedical


Looking to create a Complex Heatmap using Python? Look no further than PyComplexHeatmap, a handy tool available at:github.com/DingWB/PyCompl…. Now you don't have to switch between Python and R for machine learning or single-cell data analysis projects.


The next exciting new feature of #ComplexHeatmap: bivariate color maps 🚀🚀. The plots below demonstrate two modes of integrating red and blue color palettes into 2D. I feel I need to learn more about color science.

Shared an exciting heatmap with my collaborators but it turned out the result was wrong because the order of matrix columns and the annotations were not the same. This error is difficult to catch. Now in #ComplexHeatmap, it checks row/col names of all matrices and annotations.

Add a new argument `beside` in `anno_barplot()` as well as in related functions. E.g. in oncoPrint. #ComplexHeatmap

#Complexheatmap visualization #rstudio #Bioconductor doi.org/10.1002/imt2.43 @iMetaScience @jokergoo_gu @wileymicrobio
The current features of #ComplexHeatmap. New paper from @iMetaScience journal, This work reflects Dr. Gu @jokergoo_gu superb contributions to the field of computational biology / medical analysis. #meded #bioinfomatics #DataAnalytics #omics onlinelibrary.wiley.com/doi/10.1002/im…


I am incredibly impressed with #ComplexHeatmap by @jokergoo. It works efficiently with my matrix of 45 x 57106 cells which would have taken forever in other packages. It took less than 30 seconds to generate this. github.com/jokergoo/Compl…


PyComplexHeatmap: A Python package to visualize multimodal genomics data @iMetaScience onlinelibrary.wiley.com/doi/10.1002/im… #Bioinformatics #Python #ComplexHeatmap #Heatmap #visualization #DataScience @wileymicrobio @wileyinresearch @WileyBiomedical
Looking to create a Complex Heatmap using Python? Look no further than PyComplexHeatmap, a handy tool available at:github.com/DingWB/PyCompl…. Now you don't have to switch between Python and R for machine learning or single-cell data analysis projects.
PyComplexHeatmap: A Python package to visualize multimodal genomics data onlinelibrary.wiley.com/doi/full/10.10… #Bioinformatics #Python #ComplexHeatmap #Heatmap #visualization #DataScience @wileymicrobio @wileyinresearch @WileyBiomedical
We linked data-driven spatial domains, and cell type population back to established anatomy of the tissue with spatial registration 🔗 with tools from #spatialLIBD #Rstats @Bioconductor and built some extra complex #ComplexHeatmap 🫶 @jokergoo_gu

The current features of #ComplexHeatmap. New paper from @iMetaScience journal, This work reflects Dr. Gu @jokergoo_gu superb contributions to the field of computational biology / medical analysis. #meded #bioinfomatics #DataAnalytics #omics onlinelibrary.wiley.com/doi/10.1002/im…
#Complexheatmap visualization #rstudio #Bioconductor doi.org/10.1002/imt2.43 @iMetaScience @jokergoo_gu @wileymicrobio

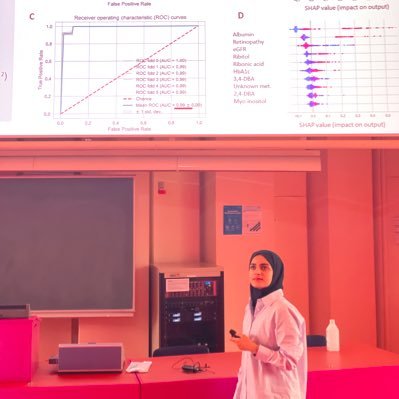
For heatmaps I usually use seaborn (in Python), but for more advanced heatmaps I absolutely recommend #complexheatmap (in R). We will share code upon publication, but there are good tutorials for both packages.
Seems like #ComplexHeatmap by @jokergoo_gu is getting lots of love at #BoG22 though I'm not 💯% sure It'd be great if people used "pkg::function()" footnotes on slides ;) #RStats @Bioconductor bioconductor.org/packages/Compl… jokergoo.github.io/ComplexHeatmap…

In #ComplexHeatmap, a HeatmapAnnotation object can be thought as a virtual data frame, thus, you can subset annotations, like `anno[, c(name1, name2)]`. This feature might be helpful when developing Shiny apps where users can select a subset of annotations for heatmaps.
The next exciting new feature of #ComplexHeatmap: bivariate color maps 🚀🚀. The plots below demonstrate two modes of integrating red and blue color palettes into 2D. I feel I need to learn more about color science.
Add a new argument `beside` in `anno_barplot()` as well as in related functions. E.g. in oncoPrint. #ComplexHeatmap
Shared an exciting heatmap with my collaborators but it turned out the result was wrong because the order of matrix columns and the annotations were not the same. This error is difficult to catch. Now in #ComplexHeatmap, it checks row/col names of all matrices and annotations.
I am using a anno_block with rotated labels in #ComplexHeatmap, but labels are overflowing vertically and just/locate is only moving them horizontally..anyone has a solution? #rstats @jokergoo_gu
Working on interactive #ComplexHeatmap 😎. Now it includes annotations for the sub-heatmap and keeps the decoration on heatmap cells.
Some nice features in #ComplexHeatmap seem not supported in Rstudio's interactive graphics panel, especially with the Retina display. Schader!
PyComplexHeatmap: A Python package to visualize multimodal genomics data onlinelibrary.wiley.com/doi/full/10.10… #Bioinformatics #Python #ComplexHeatmap #Heatmap #visualization #DataScience @wileymicrobio @wileyinresearch @WileyBiomedical
We linked data-driven spatial domains, and cell type population back to established anatomy of the tissue with spatial registration 🔗 with tools from #spatialLIBD #Rstats @Bioconductor and built some extra complex #ComplexHeatmap 🫶 @jokergoo_gu
PyComplexHeatmap: A Python package to visualize multimodal genomics data @iMetaScience onlinelibrary.wiley.com/doi/10.1002/im… #Bioinformatics #Python #ComplexHeatmap #Heatmap #visualization #DataScience @wileymicrobio @wileyinresearch @WileyBiomedical
Looking to create a Complex Heatmap using Python? Look no further than PyComplexHeatmap, a handy tool available at:github.com/DingWB/PyCompl…. Now you don't have to switch between Python and R for machine learning or single-cell data analysis projects.
Legends are automatically adjusted according to the device size when resizing the device. Long-standing problem solved! Thanks to grDevices::recordGraphics() function! just discovered today. #ComplexHeatmap
Working on interactive #ComplexHeatmap 😎. Now it includes annotations for the sub-heatmap and keeps the decoration on heatmap cells.
with the helps of #ggtree, we are able to align subplots properly. Alternative way to #complexHeatmap, #Gviz and #karyoploter for visualizing several associated datasets. yulab-smu.github.io/treedata-book/…
#ComplexHeatmap with 🍩 shape as my PI @DrLegidoQuigley requested! It only took me ♾ hours figuring out how to create it❕👩🏻💻⏳🌘 #WomenInDataScience #rstats #R #phdvoice #MassSpec #lipidomics #FavoriteFigure #womenintech🤍💙
I knew the new R version will come with new issues 😰. This is a heatmap with the new and the previous version of R dividing in clades a heatmap. Any suggestion to correct this issue? #RStats #ComplexHeatmap
I am incredibly impressed with #ComplexHeatmap by @jokergoo. It works efficiently with my matrix of 45 x 57106 cells which would have taken forever in other packages. It took less than 30 seconds to generate this. github.com/jokergoo/Compl…
Upcoming work. Although the web has a huge metabolomics flavor, I will add content about amplicon metagenomics (16s). For example, how to produce these plots. #ComplexHeatmap (6/6)
Shared an exciting heatmap with my collaborators but it turned out the result was wrong because the order of matrix columns and the annotations were not the same. This error is difficult to catch. Now in #ComplexHeatmap, it checks row/col names of all matrices and annotations.
In #ComplexHeatmap, a HeatmapAnnotation object can be thought as a virtual data frame, thus, you can subset annotations, like `anno[, c(name1, name2)]`. This feature might be helpful when developing Shiny apps where users can select a subset of annotations for heatmaps.
Add a new argument `beside` in `anno_barplot()` as well as in related functions. E.g. in oncoPrint. #ComplexHeatmap
Seems like #ComplexHeatmap by @jokergoo_gu is getting lots of love at #BoG22 though I'm not 💯% sure It'd be great if people used "pkg::function()" footnotes on slides ;) #RStats @Bioconductor bioconductor.org/packages/Compl… jokergoo.github.io/ComplexHeatmap…
The next exciting new feature of #ComplexHeatmap: bivariate color maps 🚀🚀. The plots below demonstrate two modes of integrating red and blue color palettes into 2D. I feel I need to learn more about color science.

Seconded! I discovered #ComplexHeatmap as a second-year grad student and it enabled me to do some cool things in the GIANT ExomeChip analyses of anthropometric traits. It's truly an awesome package. 


Something went wrong.
Something went wrong.
United States Trends
- 1. Chiefs 75.4K posts
- 2. Broncos 52.7K posts
- 3. Shedeur 38.2K posts
- 4. Browns 42.7K posts
- 5. Ravens 44.1K posts
- 6. Mahomes 20.3K posts
- 7. Rams 26.4K posts
- 8. Bo Nix 10.2K posts
- 9. Sam Darnold 11K posts
- 10. Gabriel 65.5K posts
- 11. #FlyEaglesFly 8,592 posts
- 12. Seahawks 25.6K posts
- 13. Lamar 20.4K posts
- 14. Goff 3,457 posts
- 15. Riley Moss 3,894 posts
- 16. Jordan Davis N/A
- 17. Myles Garrett 6,572 posts
- 18. Lane Johnson N/A
- 19. #OnePride 2,376 posts
- 20. Mark Andrews 4,912 posts