#dataanalytics search results

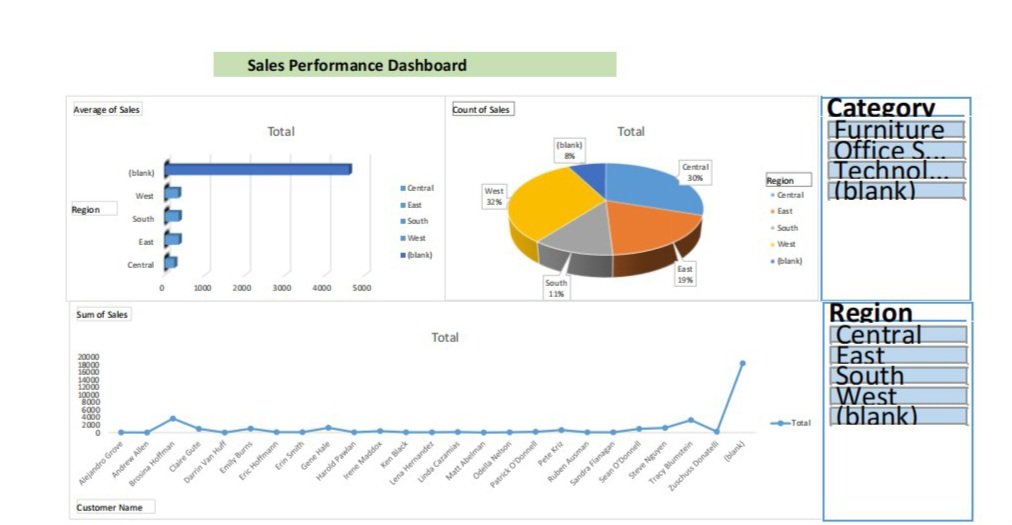
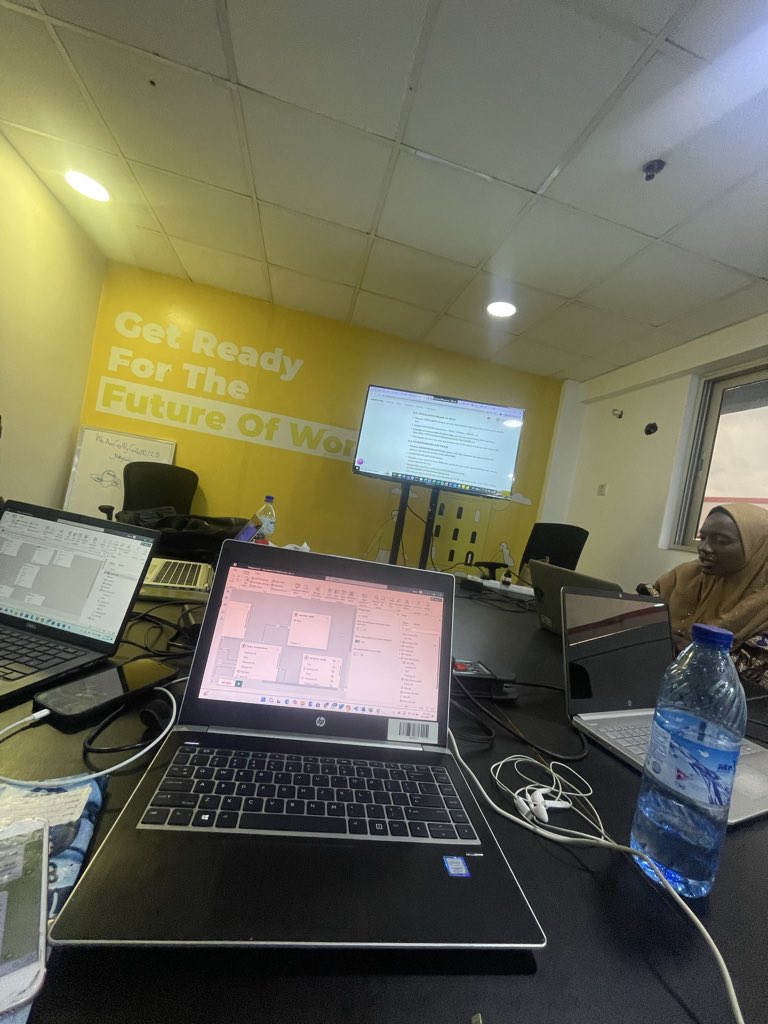
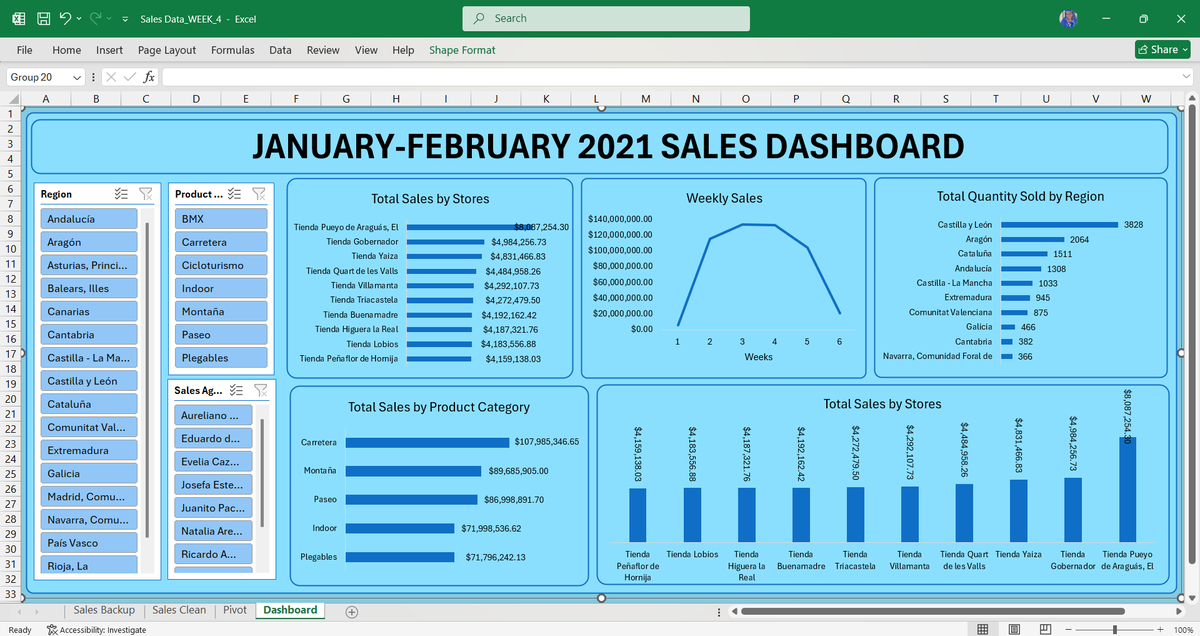
DAY 2 of My Data Analytics Journey I just built my first Sales Performance Dashboard in Excel! It includes: Region-wise Sales Visualization Sales Distribution by Region Customer Sales Trend Small progress, but it feels amazing to see the data come alive 🔥 #DataAnalytics #Excel

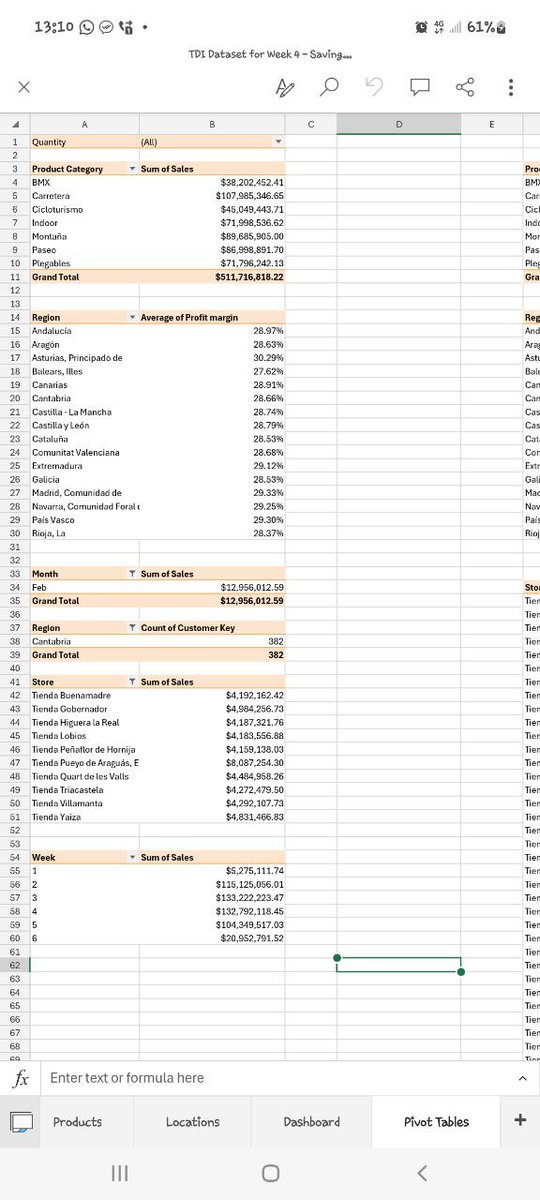
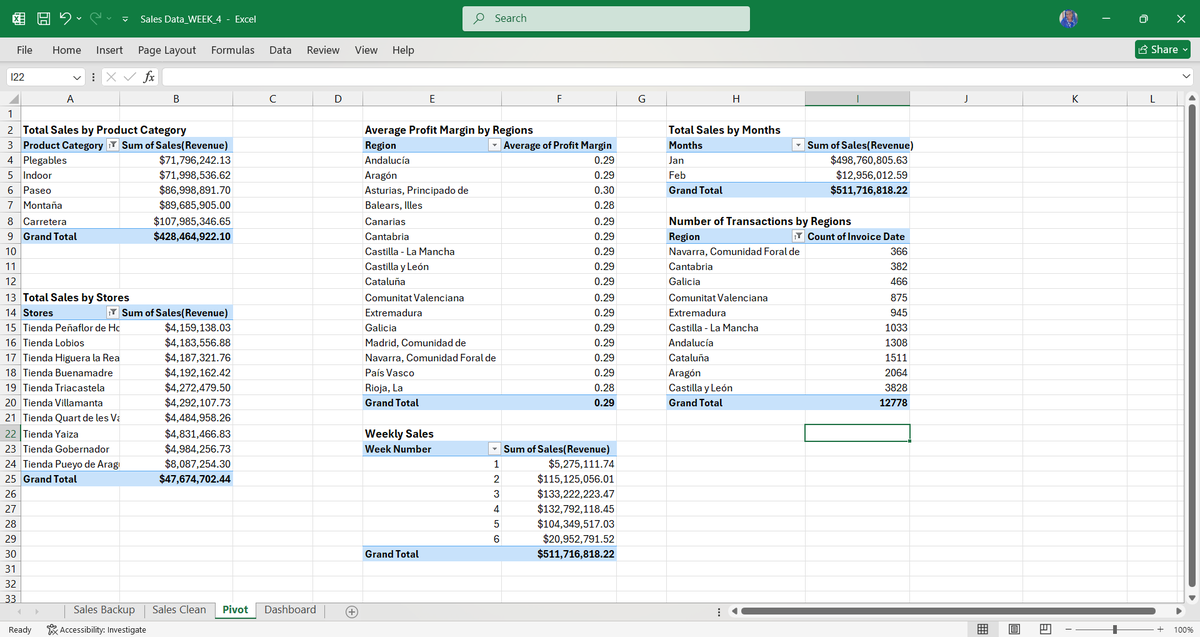
Tweet 3: What I learned this week: How to summarize data with PivotTables How to use slicers for real-time filtering Chart formatting & storytelling with visuals Creating KPIs for Sales, Quantity & Transactions #DataAnalytics #ExcelTips #TDI


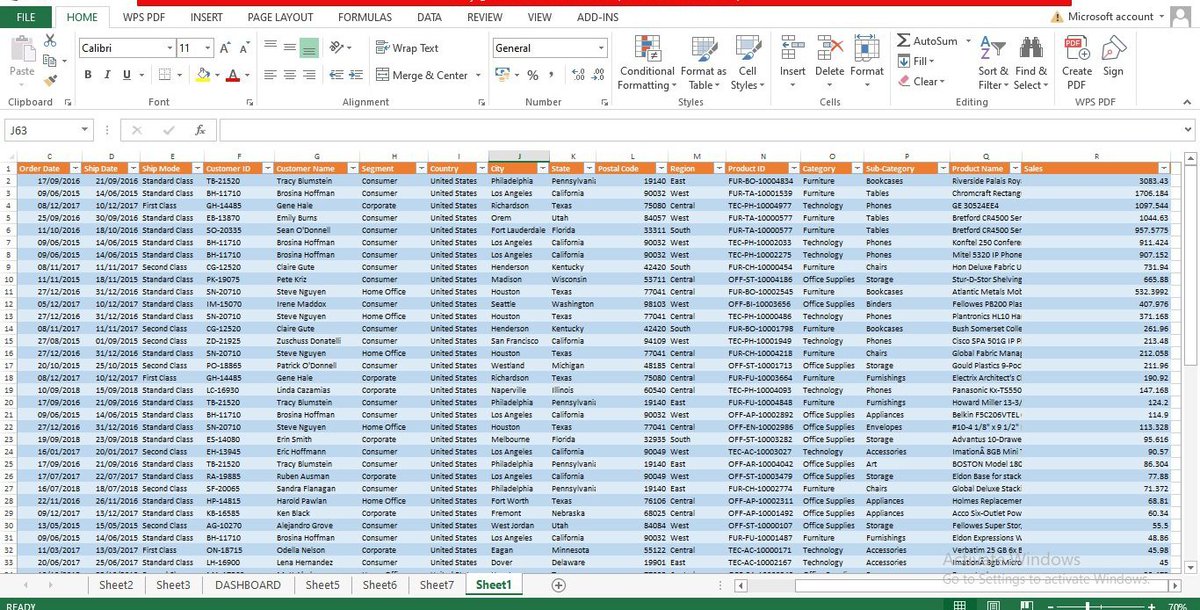
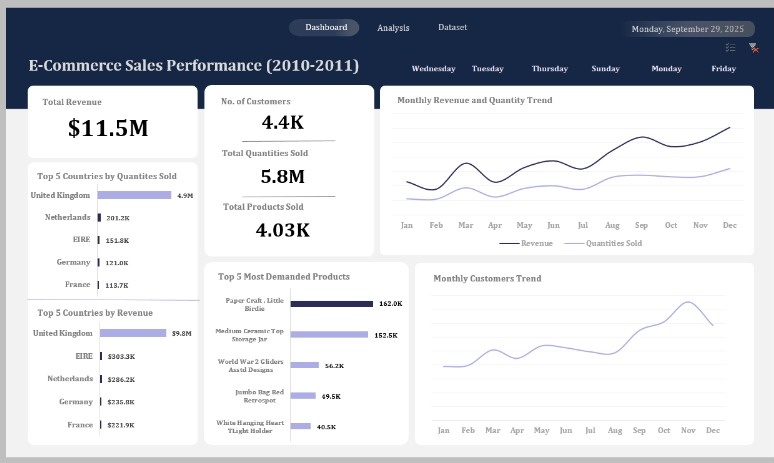
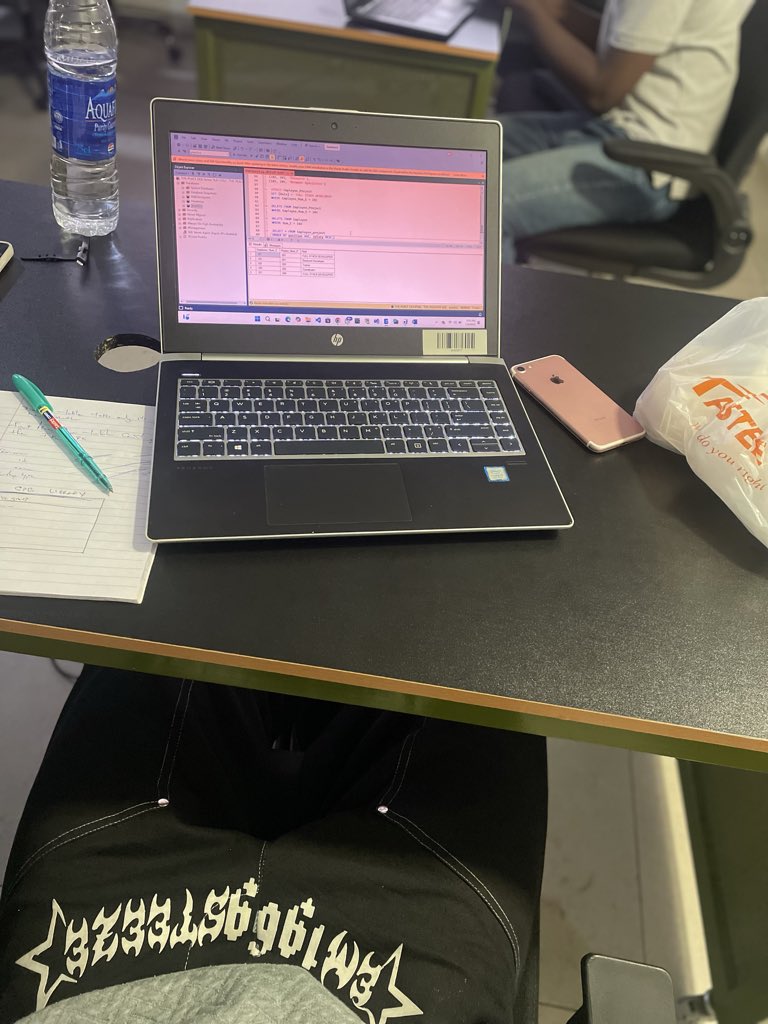
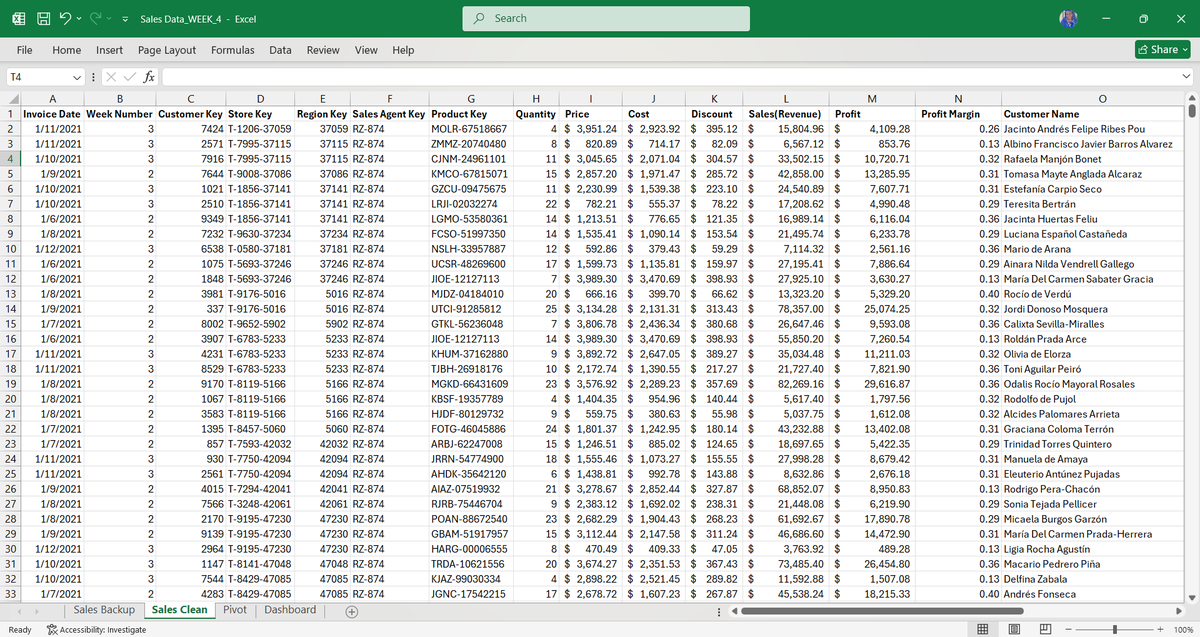
Worked on this E commerce sales dashboard using Excel, it contained 500k rows and even made me excel to start crashing, but well I later run am!!! Data Analytics is sweet!! #Excel #dataanalytics #dashboard

Data Visualization & Analysis,Data tells a story — Excel helps visualize it. From cleaning to creating pivot tables, dashboards, and charts — turning data into insights! Big thanks to the amazing mentors @ProsperoApril @PamellaIshiwu #DataAnalytics @PercorsoTech

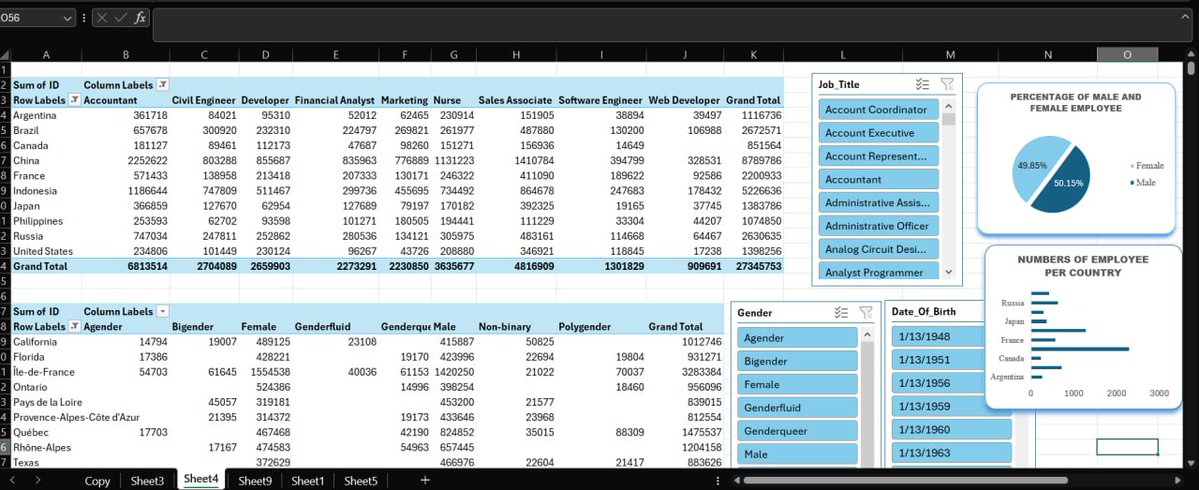
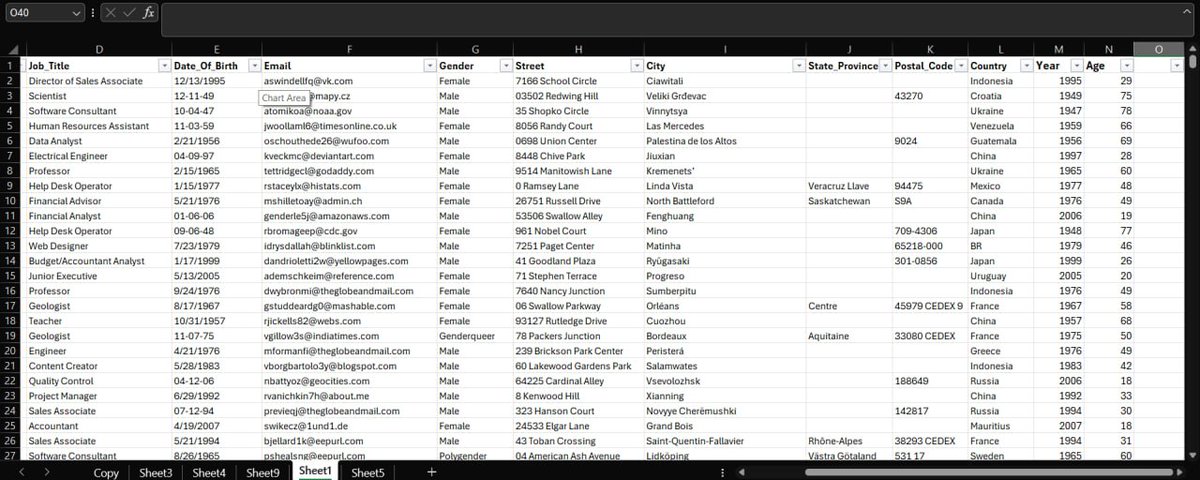
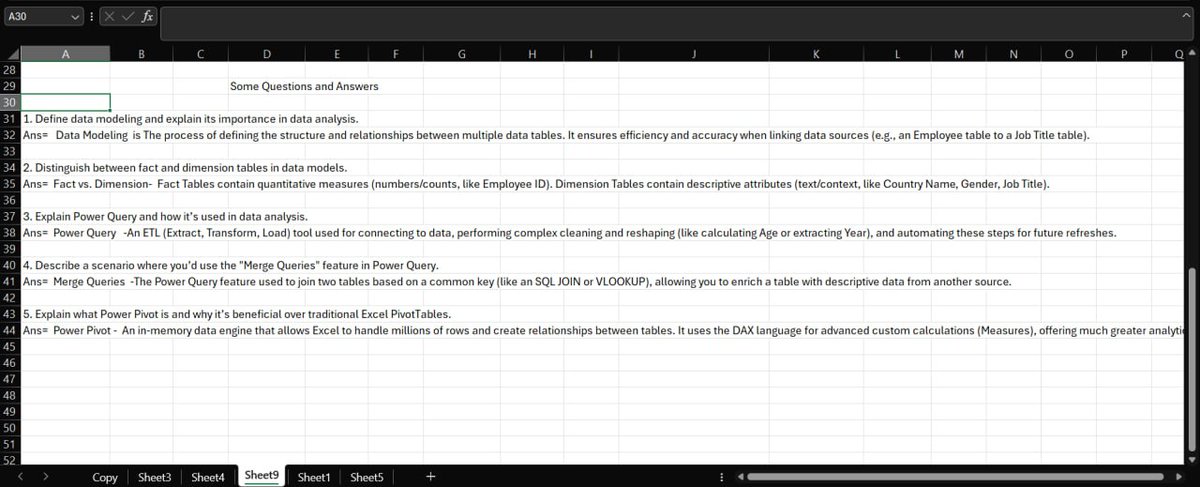

4 months ago, I started my Data Analytics journey 🚀 From zero to building dashboards in Power BI, DDL, DML, and DQL using SQL, and Excel—it’s been wild! Now it’s time to start sharing my projects, insights, and lessons learned so far. Let’s grow together 💪 #DataAnalytics #SQL


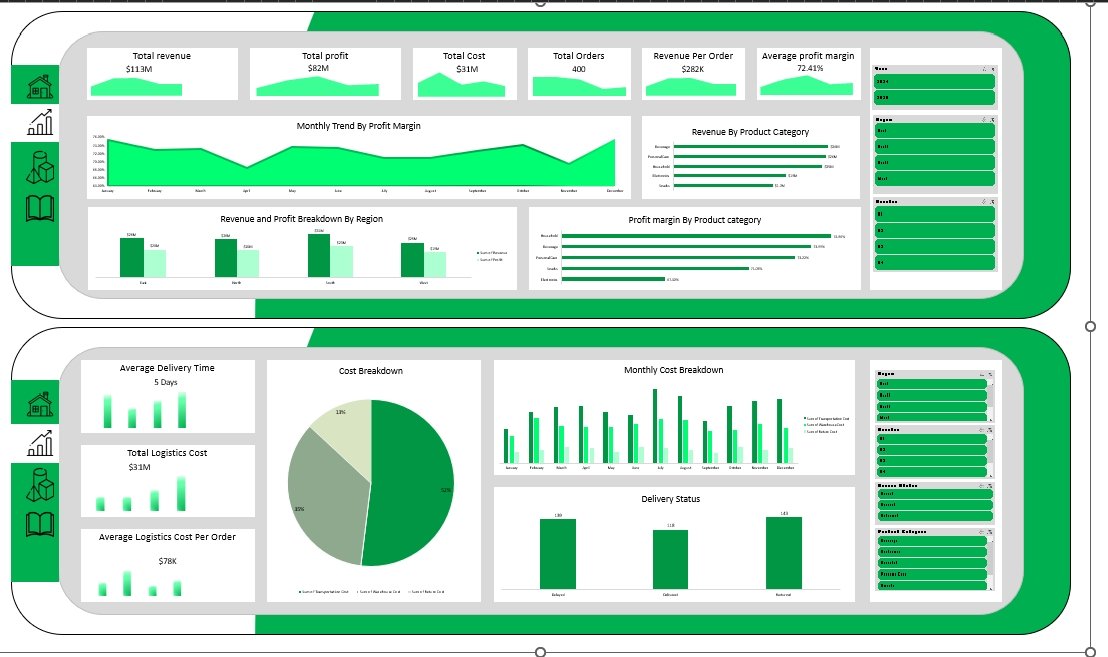
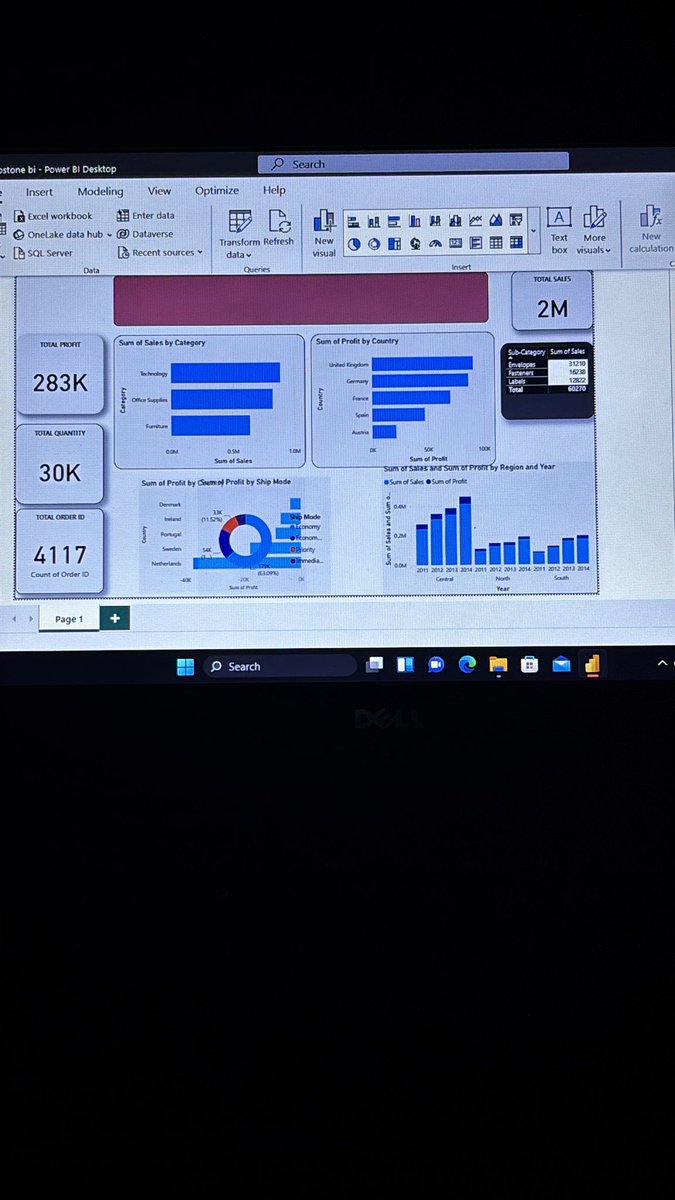
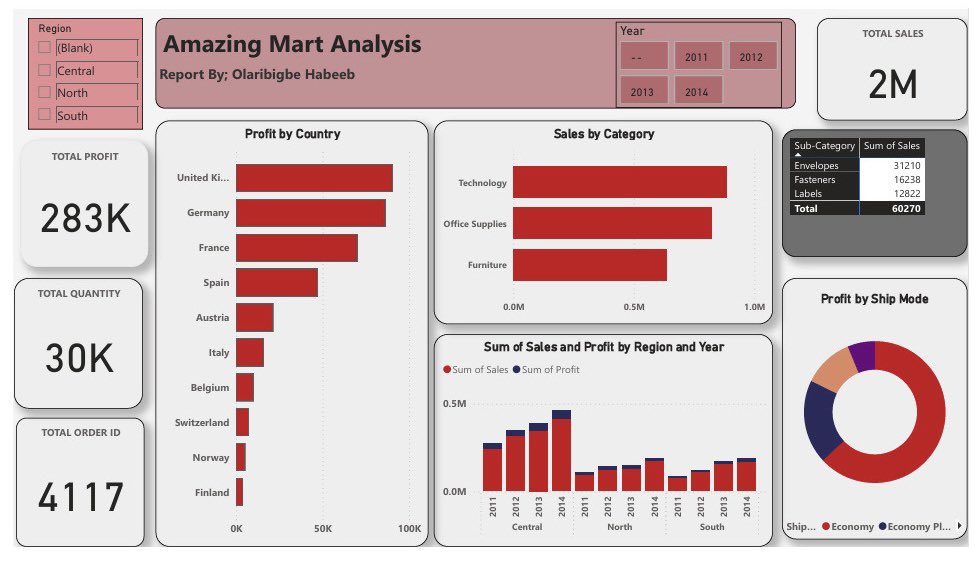
Just completed a new Power BI dashboard design showcasing clear visuals, structured data models, and actionable insights. Focused on turning complex data into simple, interactive stories for better decision-making. #PowerBI #DataAnalytics #BusinessIntelligence #DashboardDesign


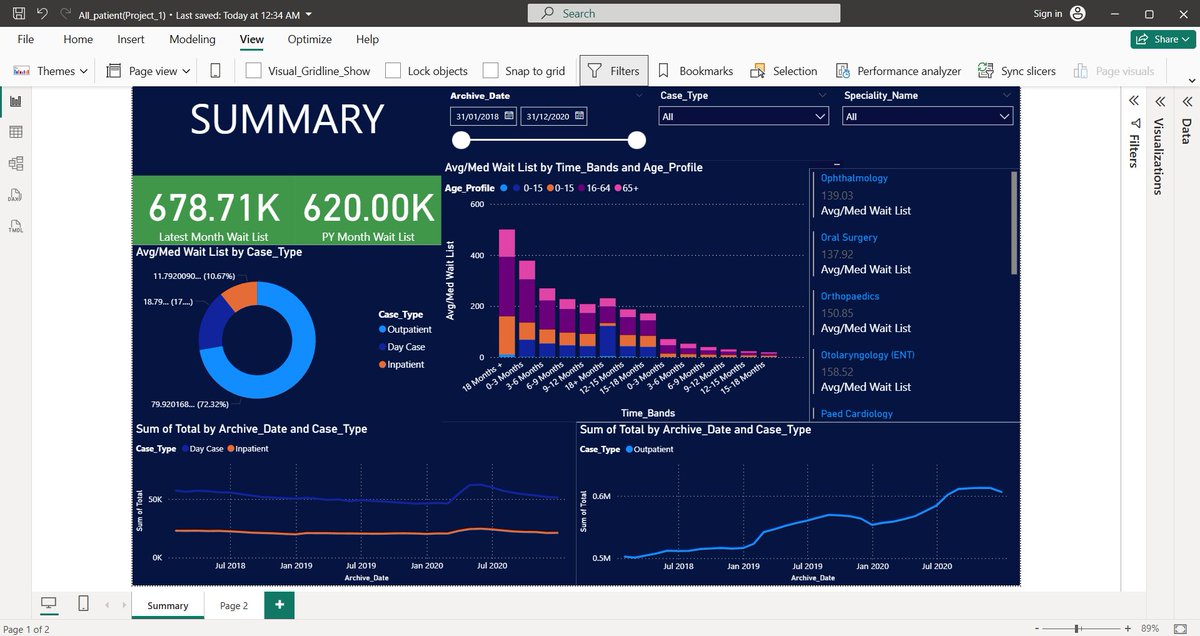
🚀 Just completed my first Power BI Dashboard! Analyzed patient wait list data & turned raw numbers into powerful insights This marks the first step in my Data analytics journey. #PowerBI #DataAnalytics #DataAnalyst #Datamodeling #DataVisualization #PowerBIDashboard #DataDriven

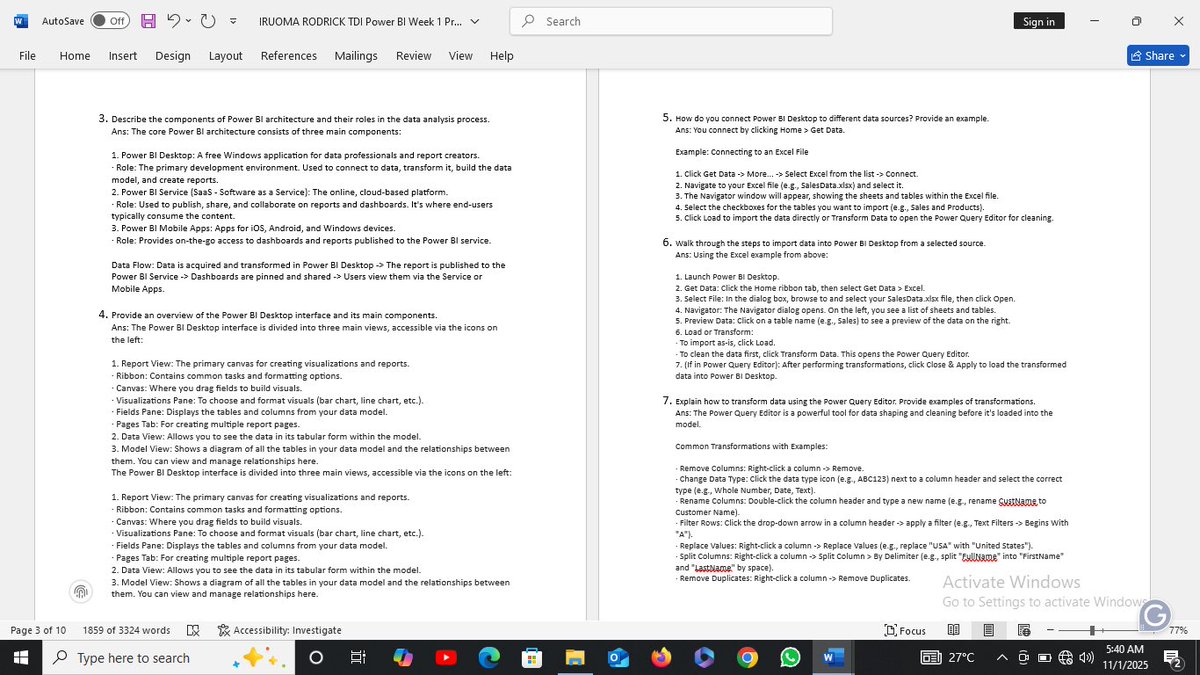
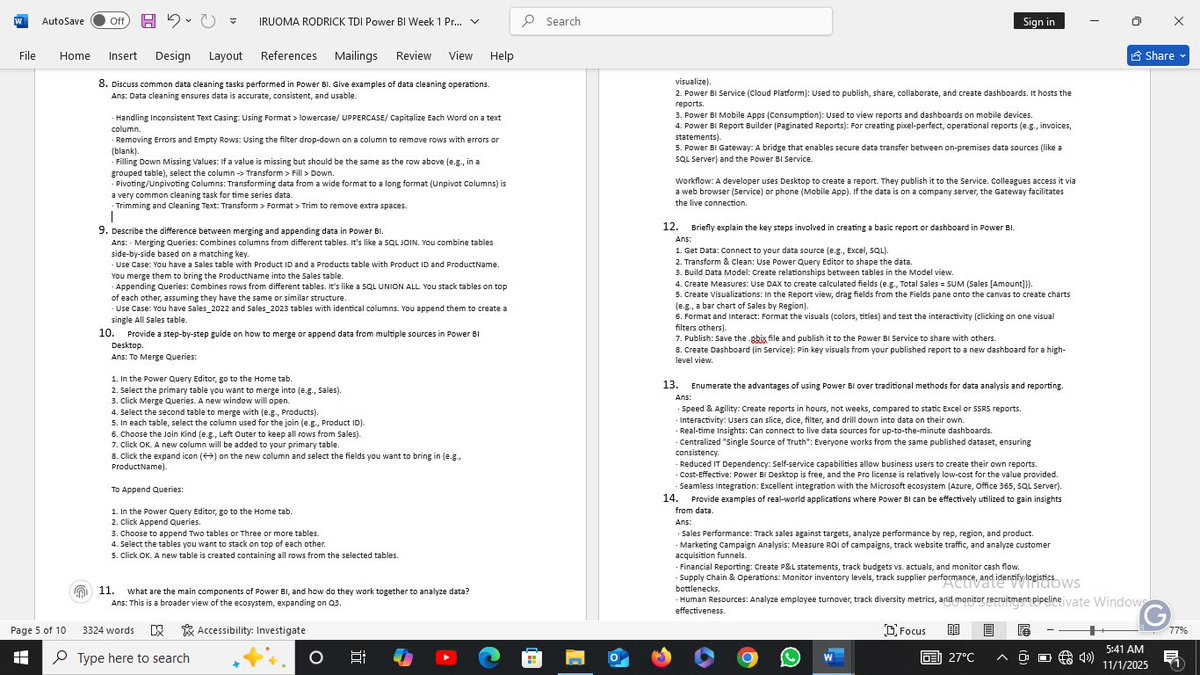
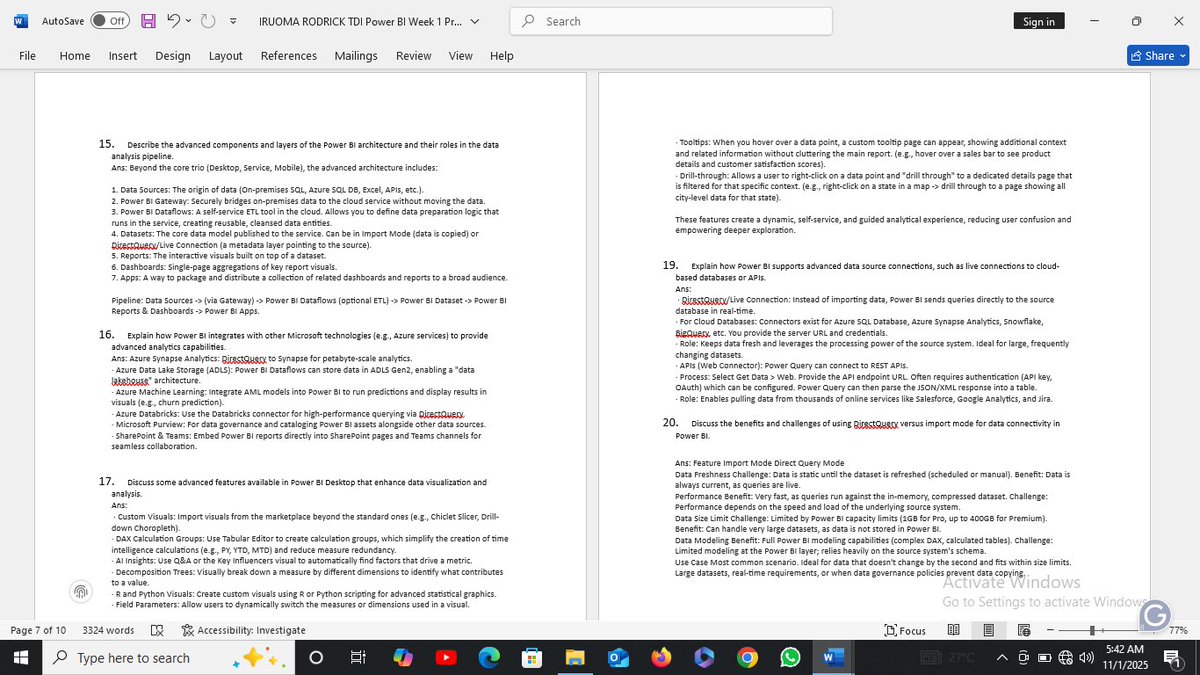
Finished my Week 1 project for the TDI Power BI challenge! Explored the basics of Power BI, data transformation, and building reports. Excited to keep growing my data skills! #TDI #PowerBI #DataAnalytics @MSPowerBI @TDataImmersed @DabereNnamani @JudeRaji_


🌟 Mindshift 2025 hits Dallas, Palo Alto, and Washington DC this week! 🎯 Learn, connect, and see how Mosaic is transforming analytics. Don’t miss it → strategysoftware.com/mindshift-even… #Mindshift2025 #AI #DataAnalytics #AIandBI


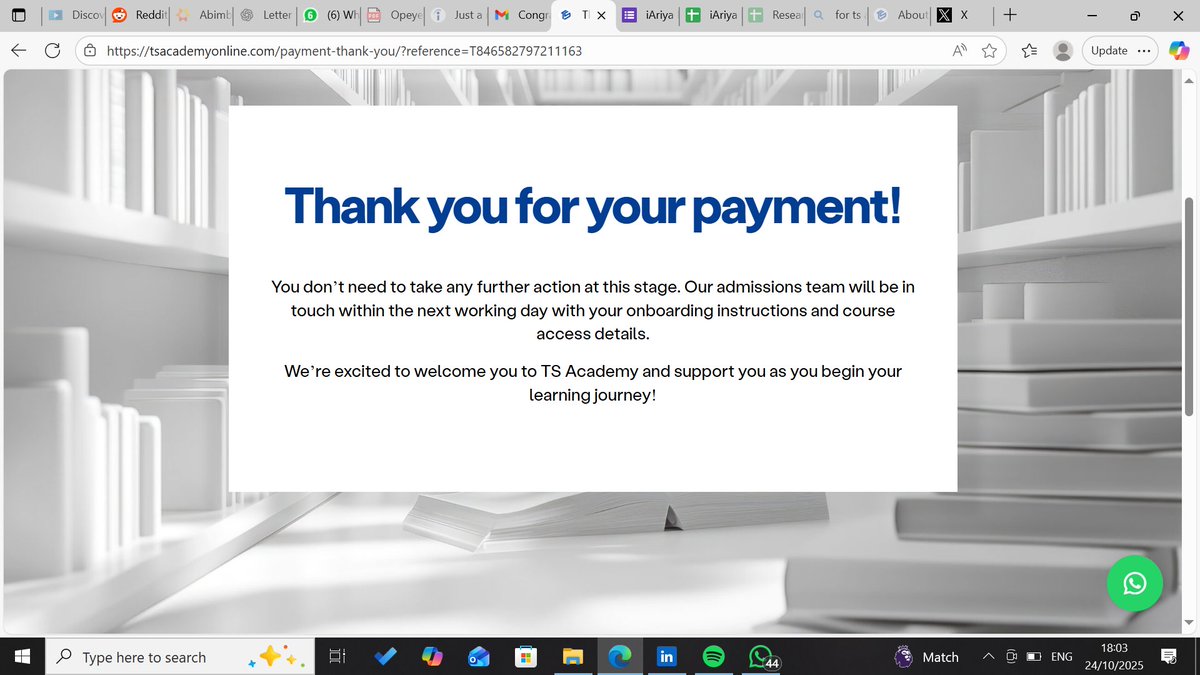
I’m thrilled to share that I’ve been awarded the Eric Tech Scholarship in partnership with TS Academy to study Data Analytics! Every insight begins with data, and I can’t wait to explore this new dimension of learning. #DataAnalytics #Scholarship #SocialResearch #Growth


🎉 Just completed my Power BI Bootcamp and earned my certificate! 📊✨ Started with zero background in data analysis, but it’s been an amazing journey learning how to turn data into insights. Huge thanks to the coordinator @Rita_tyna for the guidance! 🙏 #PowerBI #DataAnalytics

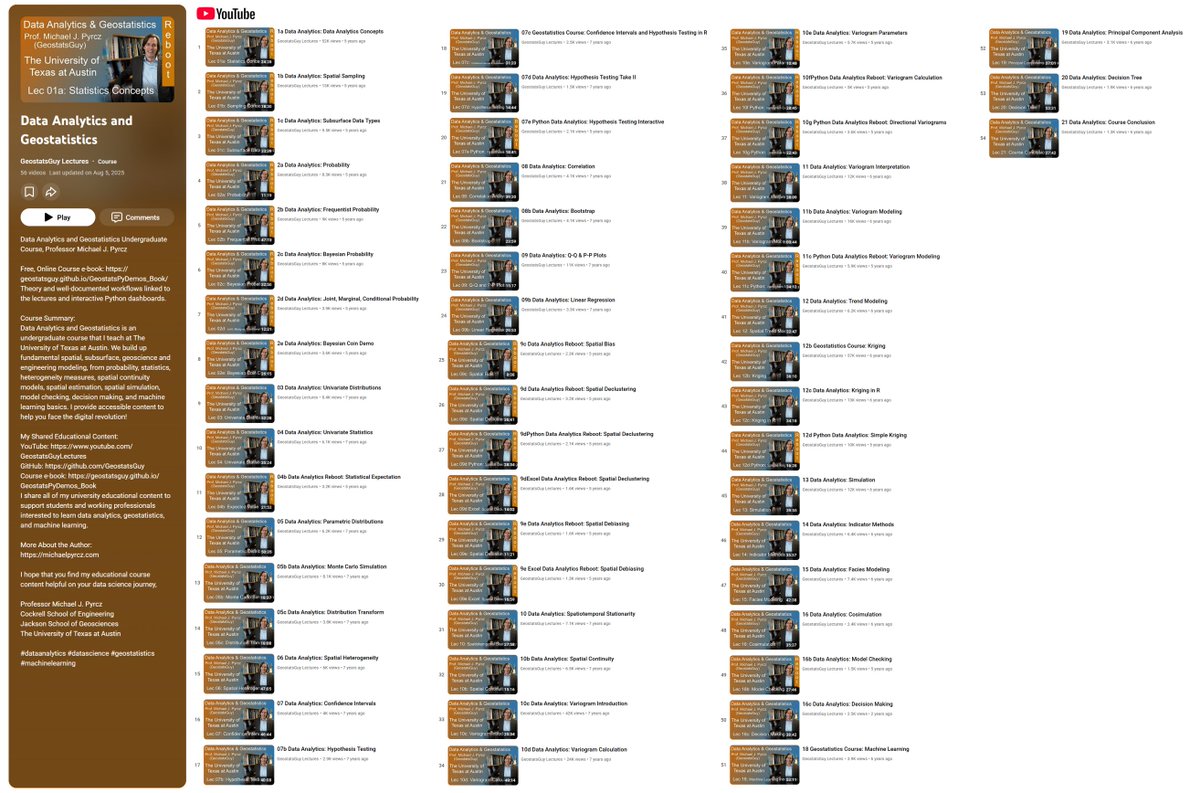
🚀 When I say I’m sharing my entire #DataAnalytics and #Geostatistics course with anyone eager to learn — I’m not joking! 😀📊 🎓 Here it is! Imagine, every lecture is paired with a free online e-book, plus hands-on, well-documented #Python workflows and interactive dashboards…

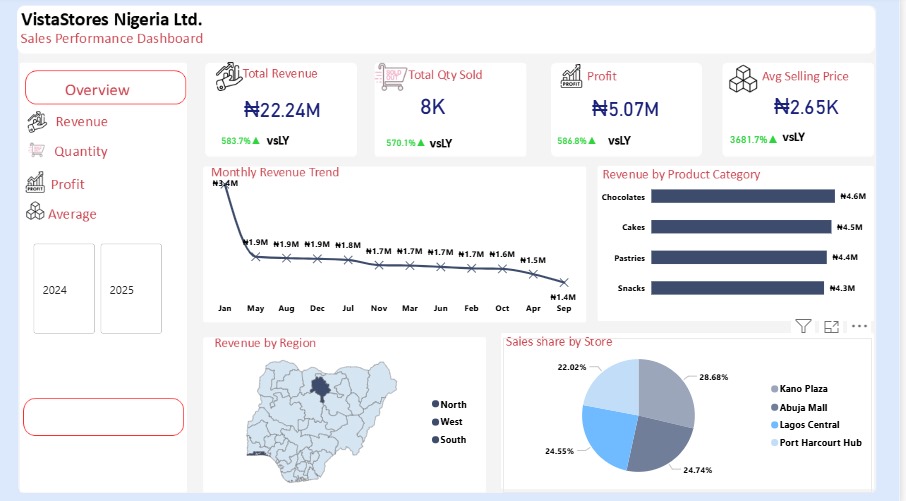
Excited to share insights from my retail analysis project! Using Excel dashboards, I explored key trends in sales, payments, and customer satisfaction. #DataAnalytics #Excel #RetailInsights


I’m a Business Analyst. I help startups identify and solve business challenges from uncovering inefficiencies to implementing solutions that improve performance and growth. Open to new roles and freelance gigs. #BusinessAnalysis #DataAnalytics #StartupGrowth


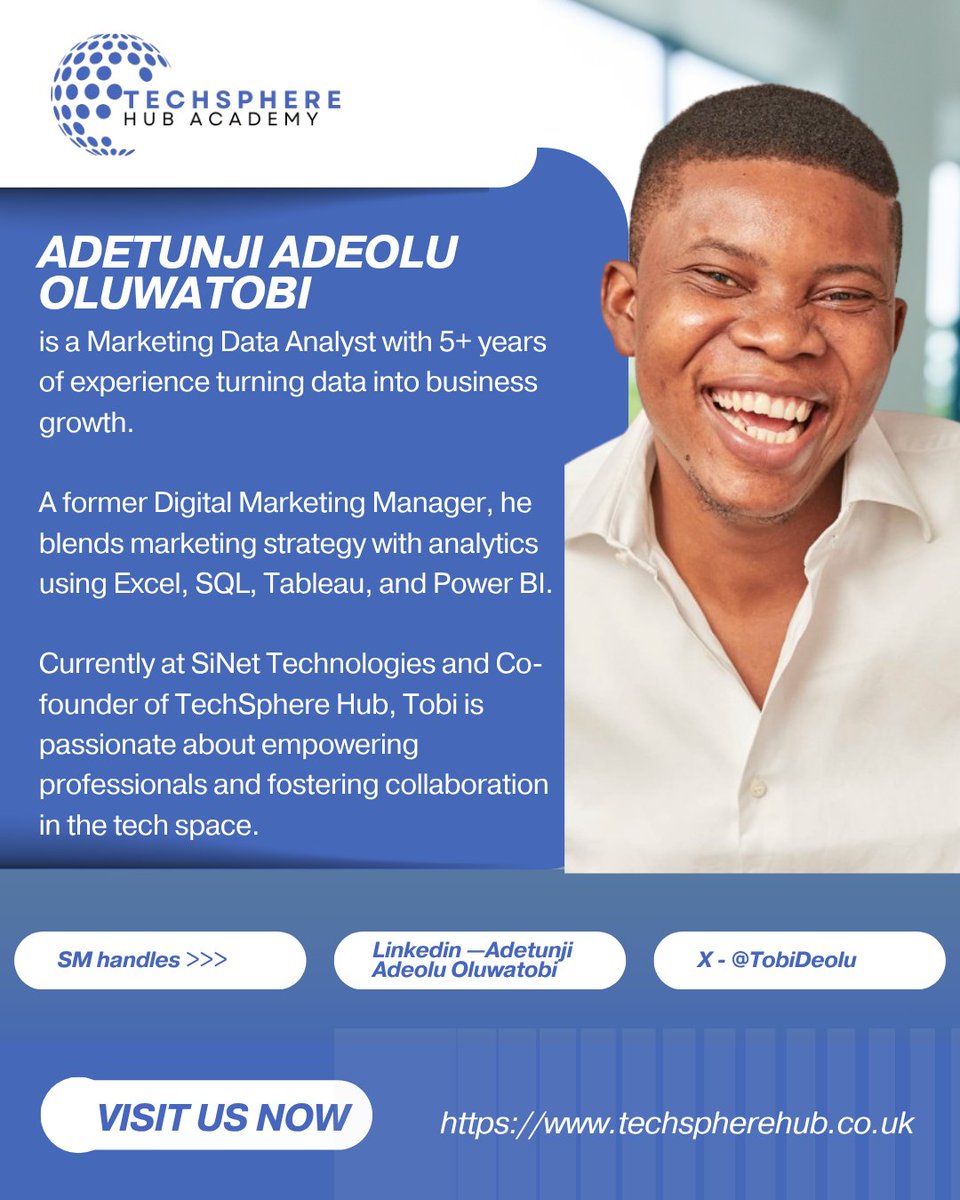
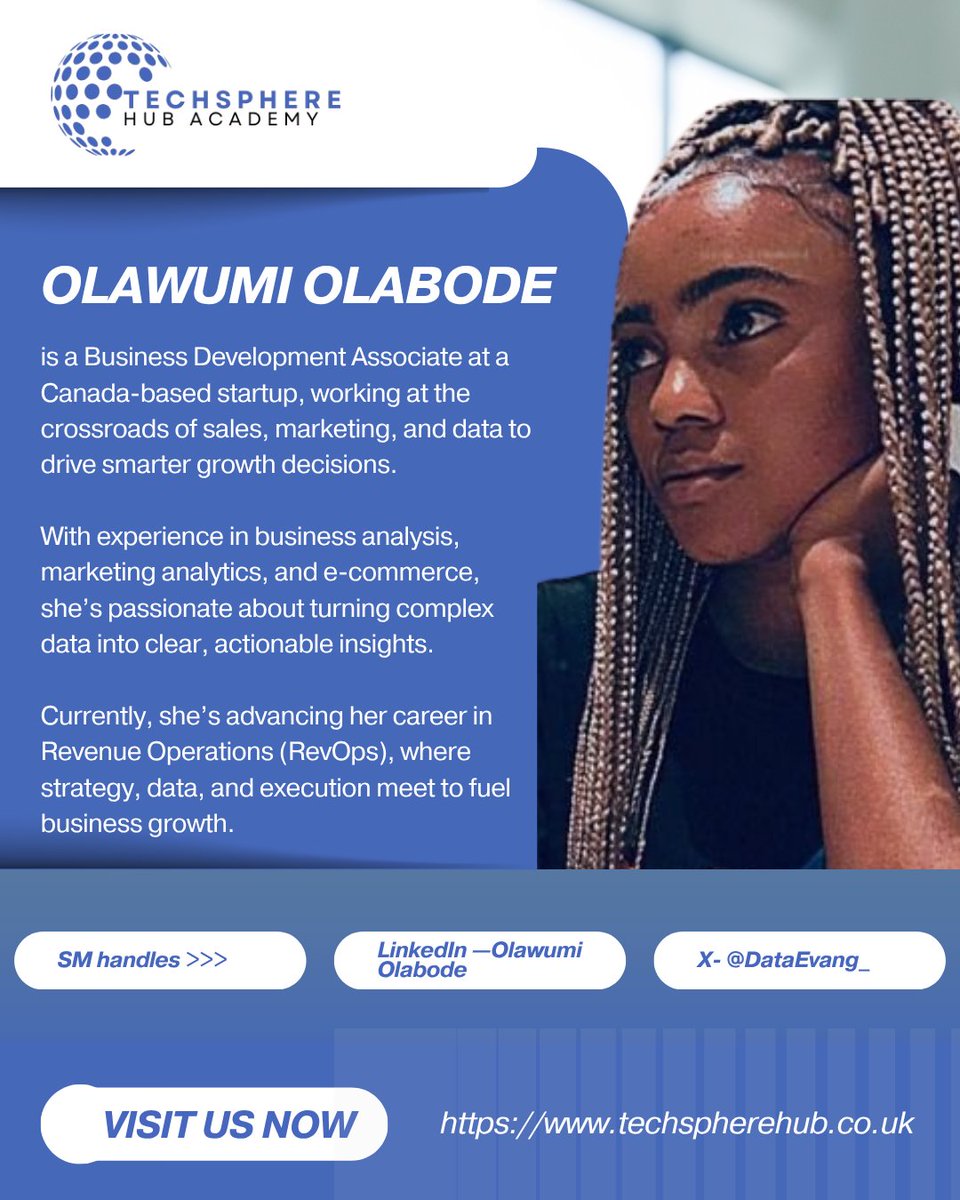
Meet Our Tutors! These are the brilliant minds helping you turn data into insight and skill into career growth. Learn from the best — industry experts who make data make sense! #TechSphereHub #DataAnalytics


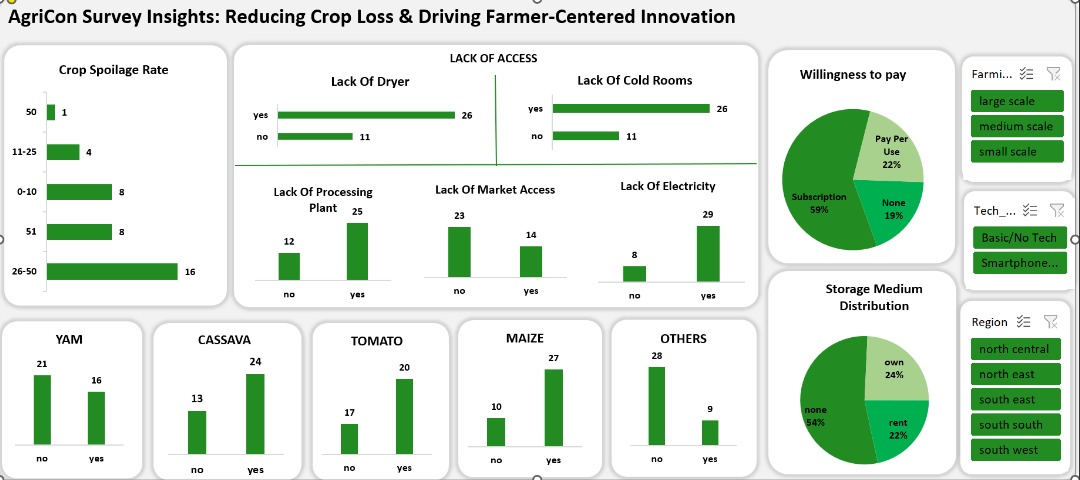
#Datafam #DataAnalytics #TDI Week4 at @TDataImmersed from previous week, we cleaned and prepared a data and we continue cleaning, and focusing on data visualization using pivot tables, charts, and slicers to uncovered insights, identify trends and present findings this week.

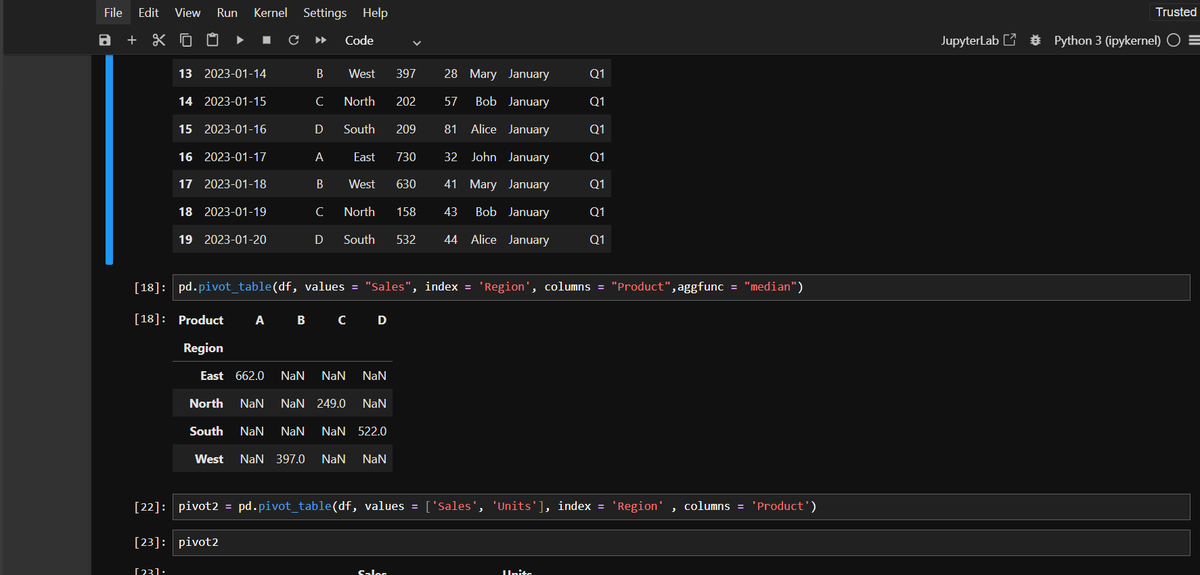
Learning pandas this festive week ... nothing like adding some sparkle to data too! ✨ Created a dataset with Products, Regions, Sales, and added custom Month and Quarter columns using pandas and played a little just to stay consistent. #Python #DataAnalytics #DiwaliLearning

What Data Analytics Really Is Data analytics isn’t just numbers on a screen, it’s how we find meaning in data. It’s about asking “why” and “what next,” not just “what happened.” That’s where the magic starts. ✨ #DataAnalytics #DataBasics

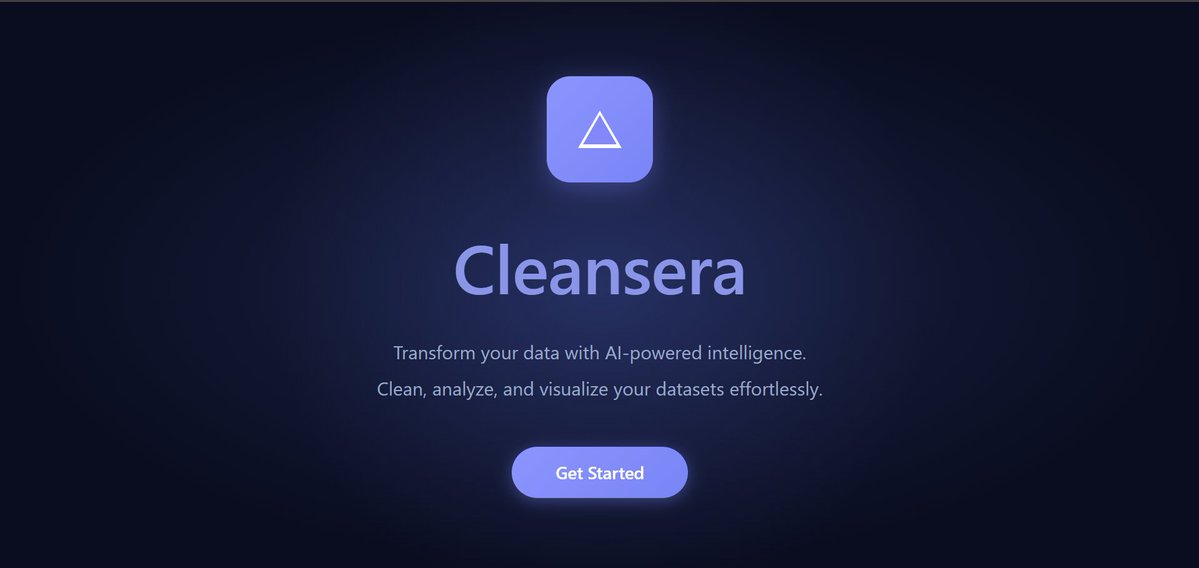
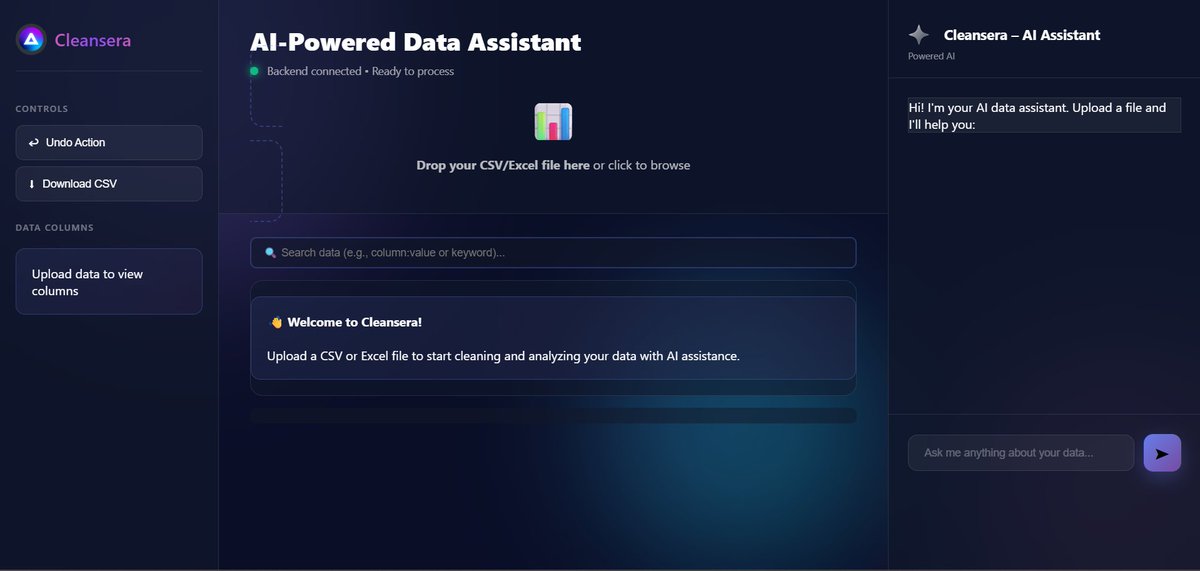
Introducing Cleansera – Your AI-Powered Data Assistant! Transform messy datasets into actionable insights effortlessly. Upload your CSV/Excel files Clean, analyze & visualize with AI Perform update, delete & all analyst operations with ease. #DataAnalytics #AI #Python #Flask


Discover the top 10 best data discovery software in 2025 for AI-driven analytics, data governance, and business intelligence. blog.9cv9.com/top-10-best-da… #DataDiscoverySoftware, #BestDataDiscoveryTools2025, #DataAnalytics, #BusinessIntelligence, #DataGovernance,


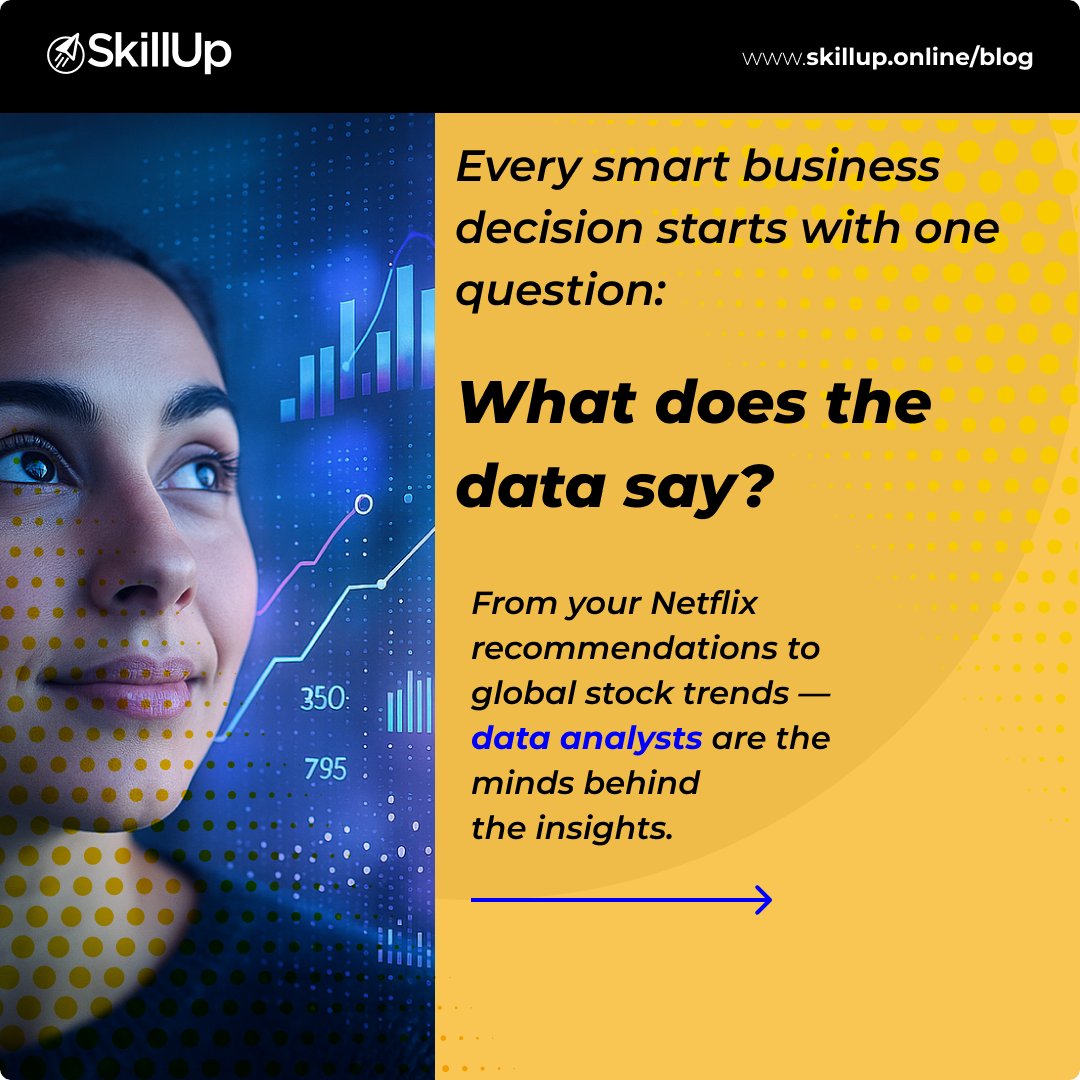
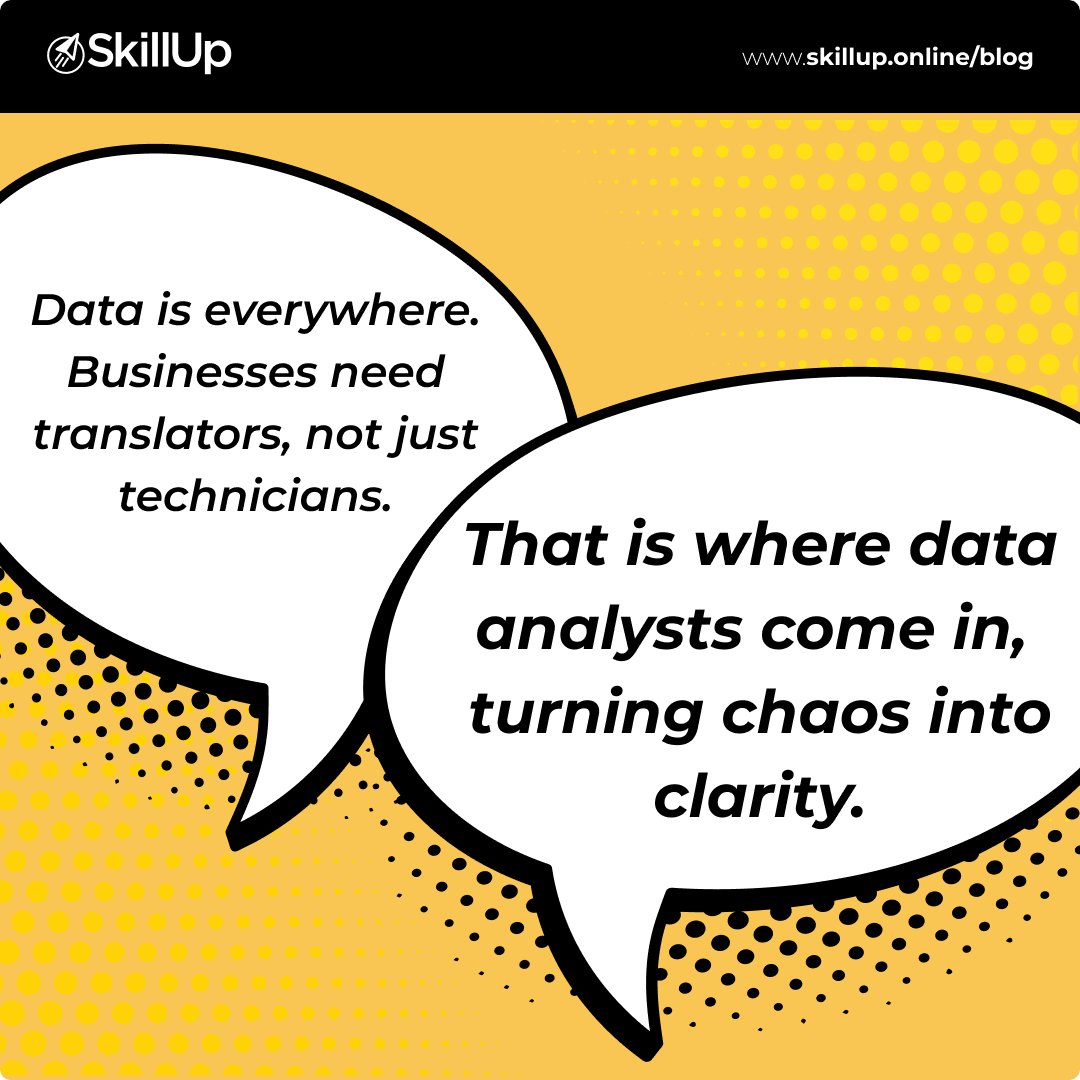
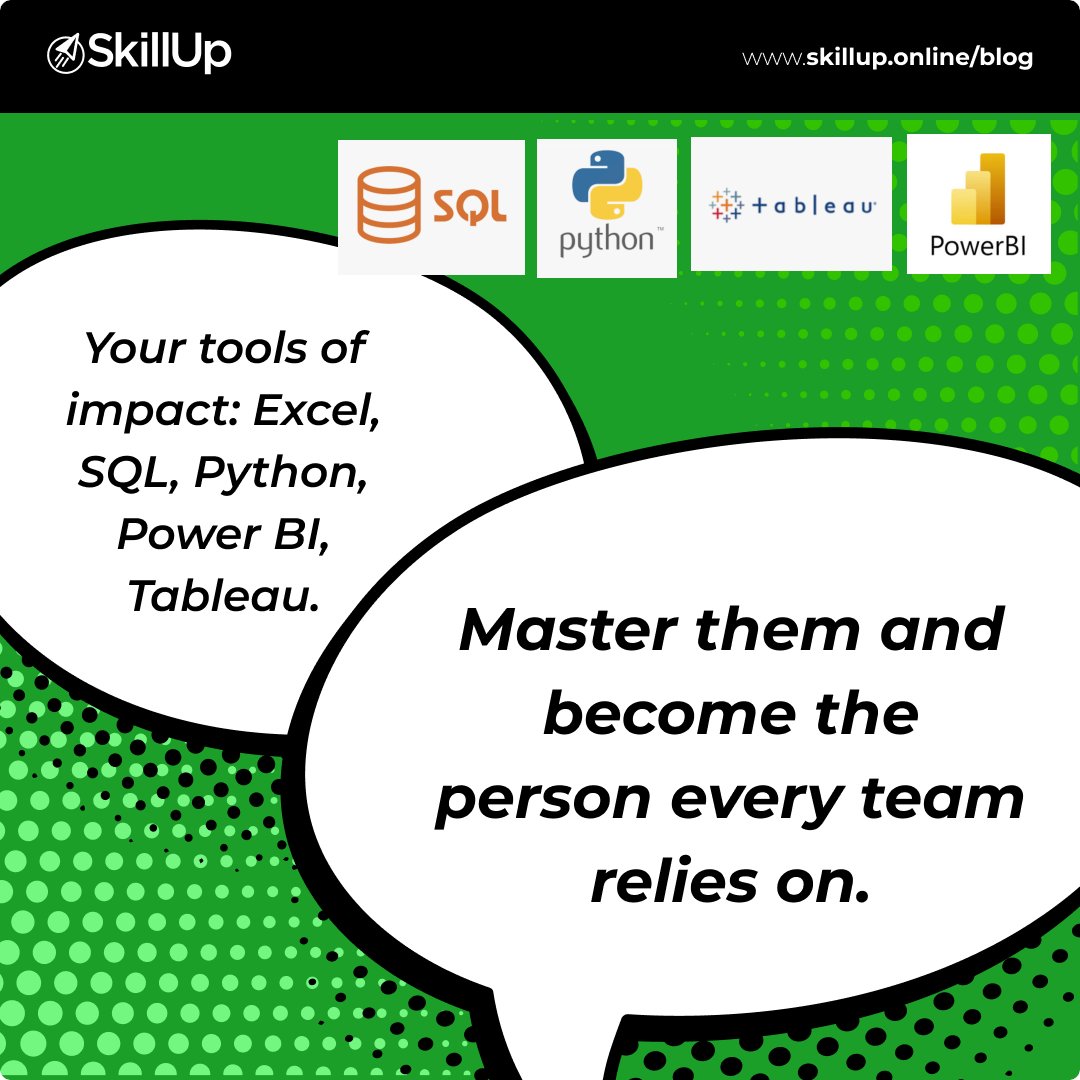
Behind every big decision is a data analyst who sees the story in the numbers. Learn how data experts connect patterns, predict outcomes, and shape industries. Start your journey: skillup.online/blog/top-data-… #DataAnalytics #CareerGrowth #SkillUpOnline #DataAnalyst #TechCareers


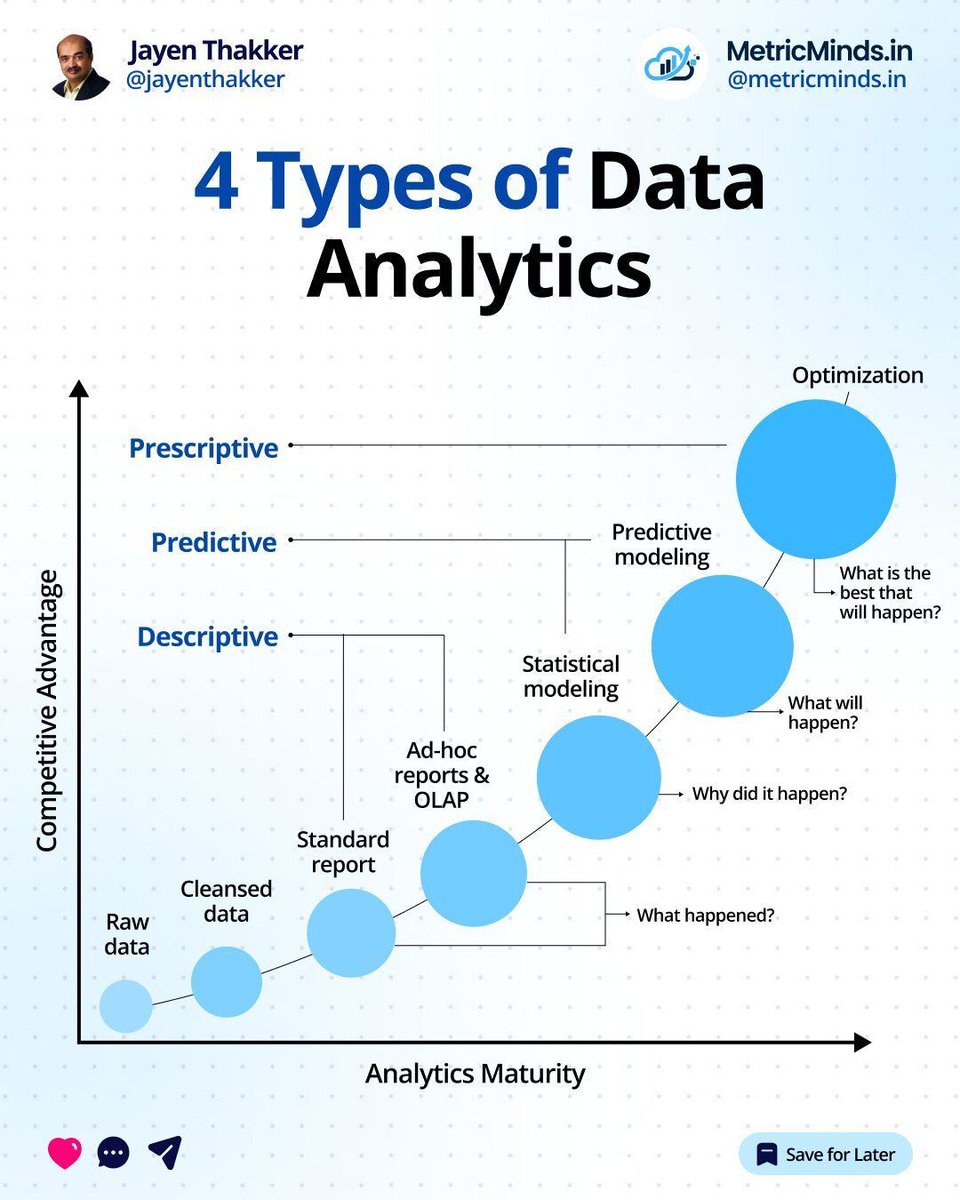
4 Types of #DataAnalytics by @JayenThakker #DataScience #BigData cc: @karpathy @terenceleungsf @kuriharan

Kickstart your career as a Power BI analyst! Master in-demand BI skills with our live online or in-person training for individuals & corporates. 📊 Get job-ready with expert-led Data Analysis & Visualization courses! #PowerBI #DataAnalytics opencastlabs.co.ke/data-analytics…


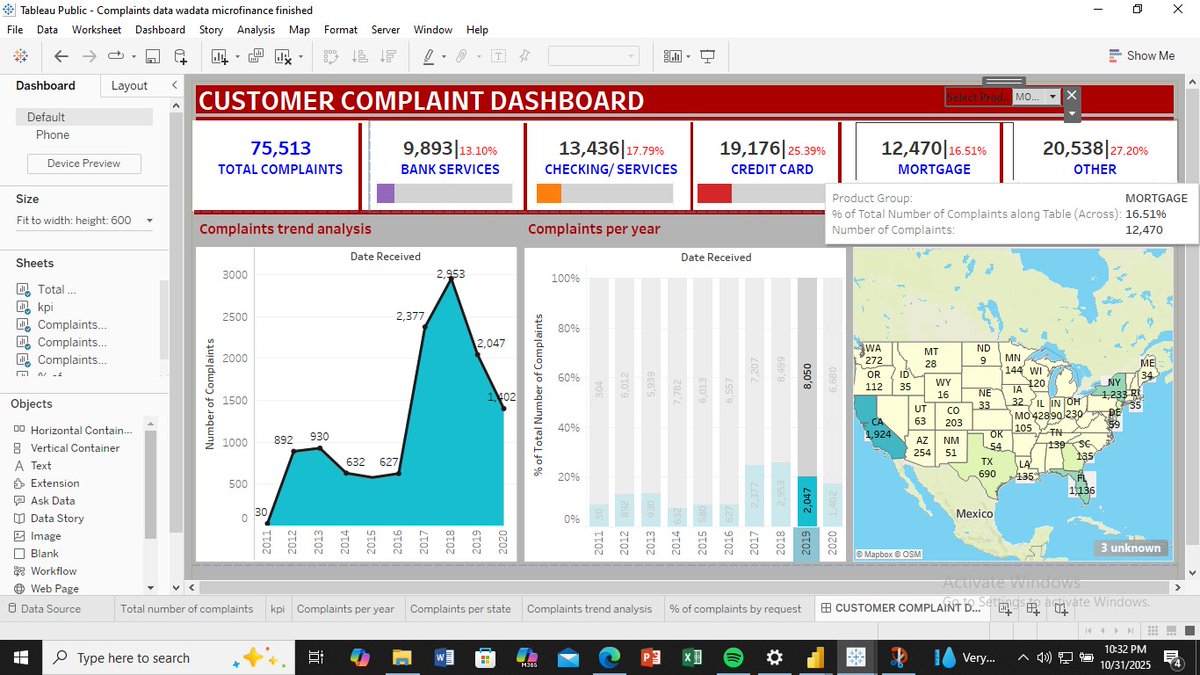
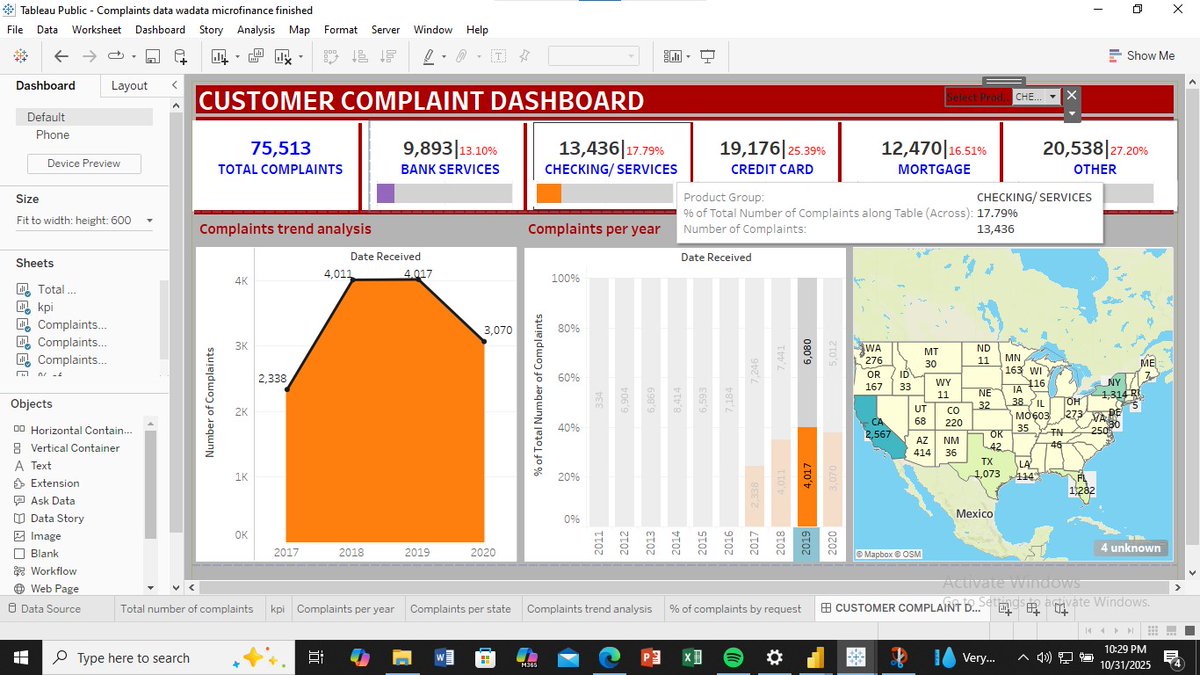
Built this Customer Complaint Dashboard on Tableau breaking down over 75k complaints by category, year, and state. Data tells stories and this one speaks volumes about service delivery and customer experience trends. #DataAnalytics #Tableau #Visualization


Data analytics is crucial for success in today’s business world! 📊💼 Organizations must build a data culture and equip teams with the right tools & skills to thrive. Let’s harness the power of data! #DataAnalytics #BusinessStrategy #Innovation
🚀 Kickstart your career as a Power BI analyst! Master in-demand BI skills with our live online or in-person training for individuals & corporates. 📊 Get job-ready with expert-led Data Analysis & Visualization courses! #PowerBI #DataAnalytics opencastlabs.co.ke/data-analysis-…


Excellent breakdown! Clear, practical, and tailored for real-world modeling, these methods make inventory forecasting far more strategic and accurate. #FinancialModeling #Finance #DataAnalytics #BusinessStrategy #CorporateFinance

The deeper your grasp of these command categories, the more control you have over your database and the insights it can deliver. #SQL #DataAnalytics #DatabaseDesign #LearningInPublic #DataEngineering

Just launched my Free Trading Journal Template 📊 Log your trades. Track your performance. Trade smarter — powered by data. ⚡️Get it free: findatastudio.gumroad.com/l/pljxc #Trading #Finance #DataAnalytics #Gumroad #Excel @Gumroad


Grateful for everyone who showed up to yesterday’s Free Data Analysis Webinar! 🙏 Your passion for learning data skills made it special. More sessions coming soon — stay tuned! #DataAnalytics #CareerGrowth #TheDataDesk


Worked on this E commerce sales dashboard using Excel, it contained 500k rows and even made me excel to start crashing, but well I later run am!!! Data Analytics is sweet!! #Excel #dataanalytics #dashboard
4 months ago, I started my Data Analytics journey 🚀 From zero to building dashboards in Power BI, DDL, DML, and DQL using SQL, and Excel—it’s been wild! Now it’s time to start sharing my projects, insights, and lessons learned so far. Let’s grow together 💪 #DataAnalytics #SQL
Just completed a new Power BI dashboard design showcasing clear visuals, structured data models, and actionable insights. Focused on turning complex data into simple, interactive stories for better decision-making. #PowerBI #DataAnalytics #BusinessIntelligence #DashboardDesign
Excited to share insights from my retail analysis project! Using Excel dashboards, I explored key trends in sales, payments, and customer satisfaction. #DataAnalytics #Excel #RetailInsights
Finished my Week 1 project for the TDI Power BI challenge! Explored the basics of Power BI, data transformation, and building reports. Excited to keep growing my data skills! #TDI #PowerBI #DataAnalytics @MSPowerBI @TDataImmersed @DabereNnamani @JudeRaji_
🚀 Just completed my first Power BI Dashboard! Analyzed patient wait list data & turned raw numbers into powerful insights This marks the first step in my Data analytics journey. #PowerBI #DataAnalytics #DataAnalyst #Datamodeling #DataVisualization #PowerBIDashboard #DataDriven
Learning pandas this festive week ... nothing like adding some sparkle to data too! ✨ Created a dataset with Products, Regions, Sales, and added custom Month and Quarter columns using pandas and played a little just to stay consistent. #Python #DataAnalytics #DiwaliLearning
I’m a Business Analyst. I help startups identify and solve business challenges from uncovering inefficiencies to implementing solutions that improve performance and growth. Open to new roles and freelance gigs. #BusinessAnalysis #DataAnalytics #StartupGrowth
🎉 Just completed my Power BI Bootcamp and earned my certificate! 📊✨ Started with zero background in data analysis, but it’s been an amazing journey learning how to turn data into insights. Huge thanks to the coordinator @Rita_tyna for the guidance! 🙏 #PowerBI #DataAnalytics
I’m thrilled to share that I’ve been awarded the Eric Tech Scholarship in partnership with TS Academy to study Data Analytics! Every insight begins with data, and I can’t wait to explore this new dimension of learning. #DataAnalytics #Scholarship #SocialResearch #Growth
Tweet 3: What I learned this week: How to summarize data with PivotTables How to use slicers for real-time filtering Chart formatting & storytelling with visuals Creating KPIs for Sales, Quantity & Transactions #DataAnalytics #ExcelTips #TDI

Data insights alert! 📊💡 Just wrapped up week 3 of my data analytics journey & I'm loving the stories the numbers are telling! 📈💻 From data cleaning to visualization, it's been a wild ride. @TDataImmersed #DataAnalytics @msexcel #TDI @DabereNnamani


Meet Our Tutors! These are the brilliant minds helping you turn data into insight and skill into career growth. Learn from the best — industry experts who make data make sense! #TechSphereHub #DataAnalytics
Something went wrong.
Something went wrong.
United States Trends
- 1. Dodgers 725K posts
- 2. World Series 382K posts
- 3. World Series 382K posts
- 4. Yamamoto 225K posts
- 5. Blue Jays 151K posts
- 6. Will Smith 51.3K posts
- 7. Miguel Rojas 44.1K posts
- 8. Yankees 16.1K posts
- 9. Kershaw 37.2K posts
- 10. Baseball 168K posts
- 11. Kendrick 18.1K posts
- 12. jungkook 334K posts
- 13. Vladdy 22.8K posts
- 14. Dave Roberts 14.5K posts
- 15. Carlos Manzo 289K posts
- 16. #Worlds2025 28.7K posts
- 17. Ohtani 90.4K posts
- 18. Jeff Hoffman 3,918 posts
- 19. Mets 11.6K posts
- 20. Cubs 7,759 posts