#geopandas search results

Roads of South America! Shows all roads from highways down to dirt tracks. This map was generated using #Matplotlib #Numpy #Geopandas. #Python #DataScience #Data #DataVisualization #SouthAmerica #infastructure.

Roads of Colombia! Shows all roads from highways down to dirt tracks. This map was generated using #Matplotlib #Numpy #Geopandas. #Python #DataScience #Data #DataVisualization #Africa #infastructure.

This map shows all of the earthquakes with a magnitude greater than 4.0 over the last 20 years, coloured according to their magnitude (blue (smallest) - red (largest). #Matplotlib #Numpy #Geopandas. #Python #DataScience #Data #DataVisualization #earthquake

Roads of Europe! Shows all roads from highways (black) down to lanes (orange) and everything in between! This map was generated using #Matplotlib #Numpy #Geopandas. #Python #DataScience #Data #DataVisualization #Europe.


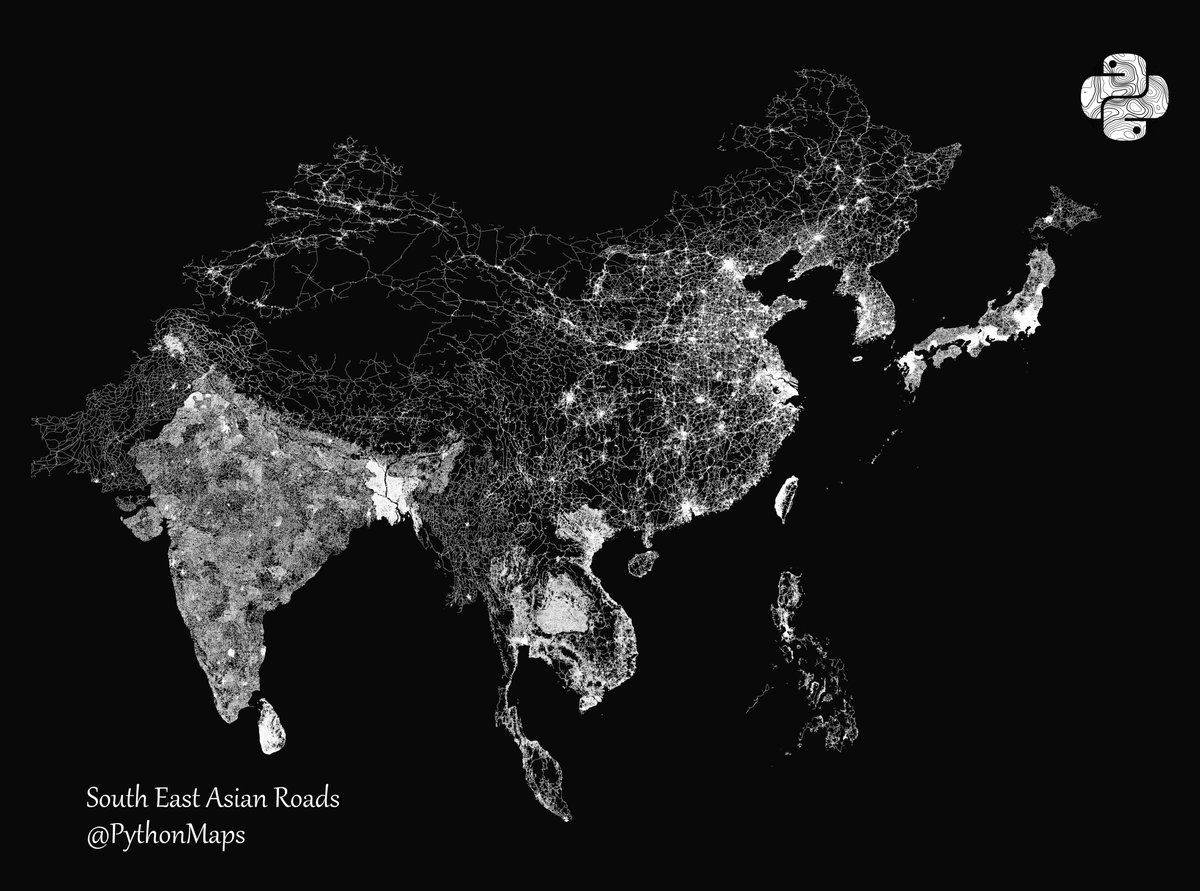
Roads of East Asia! Shows all roads from highways down to dirt tracks. This map was generated using #Matplotlib #Numpy #Geopandas. #Python #DataScience #Data #DataVisualization #Asia #infastructure.
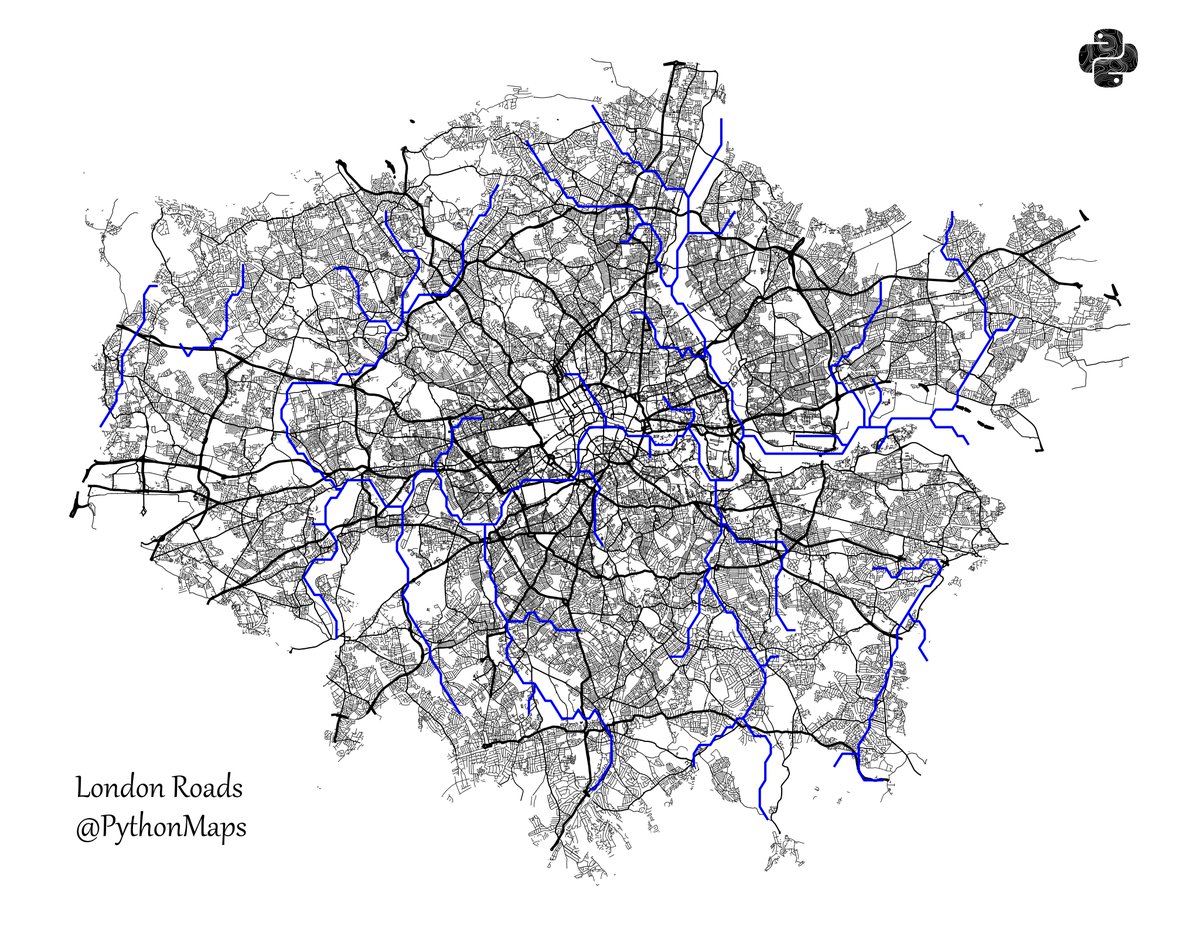
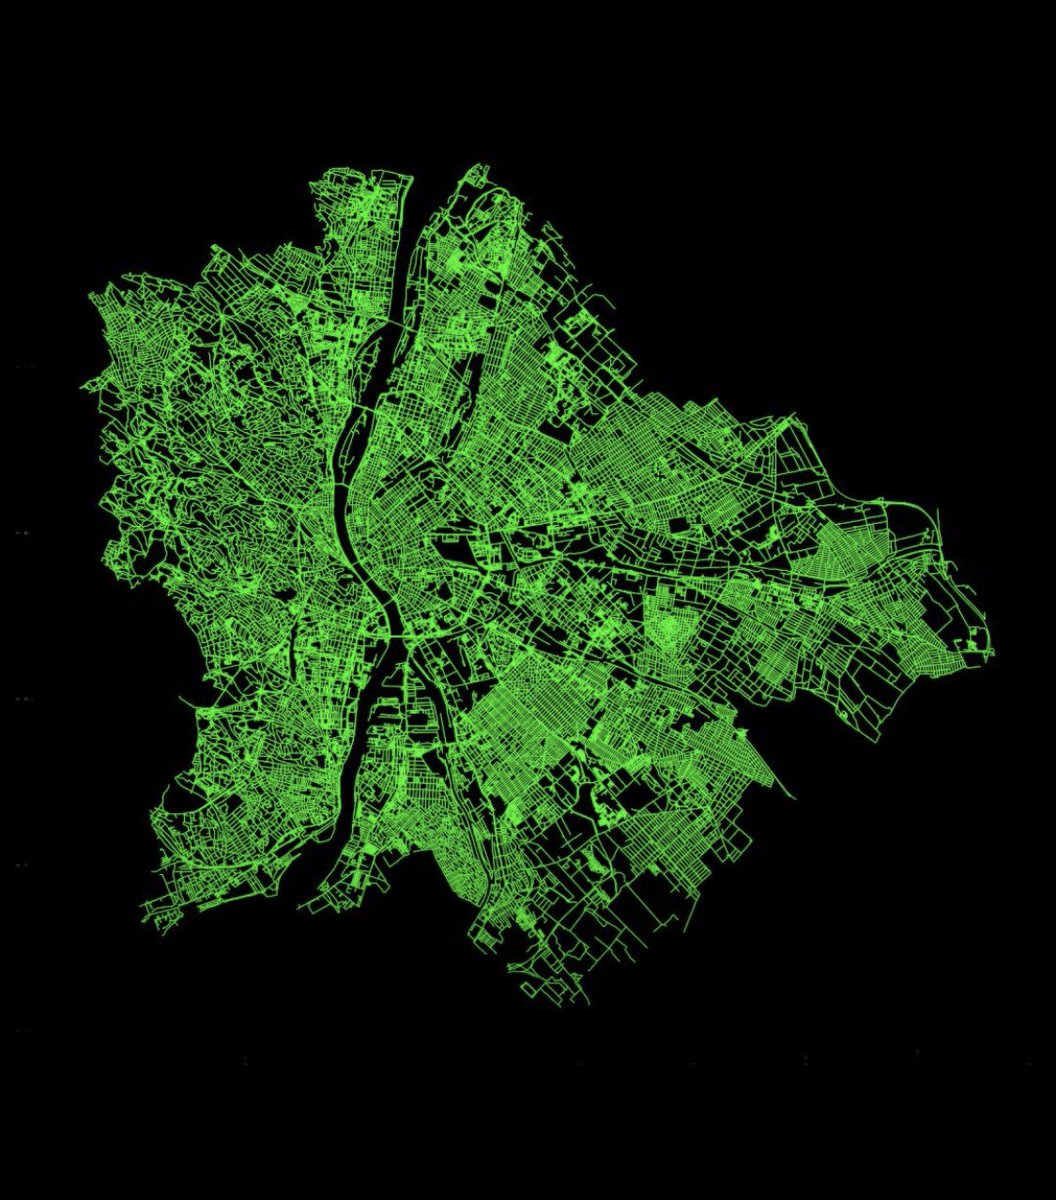
Roads of London! This map was generated using #Matplotlib #Numpy #Geopandas. #Python #DataScience #Data #DataVisualization #London.
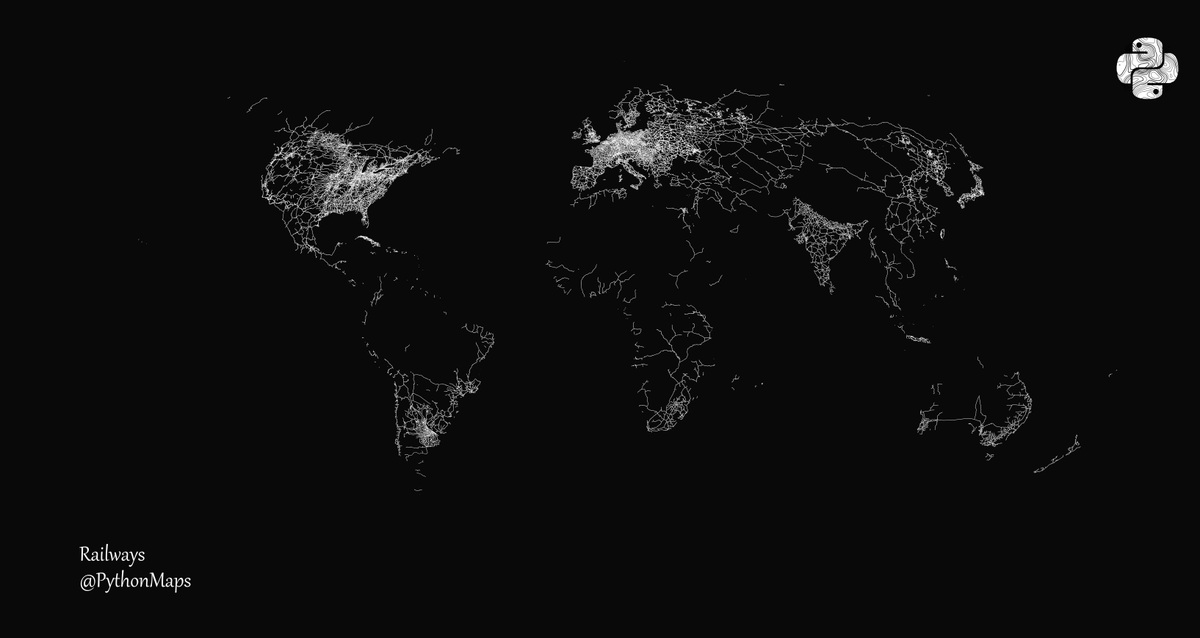
Railways! This map was generated using #Matplotlib #Numpy #Geopandas. #Python #DataScience #Data #DataVisualization #SouthAmerica #infastructure.


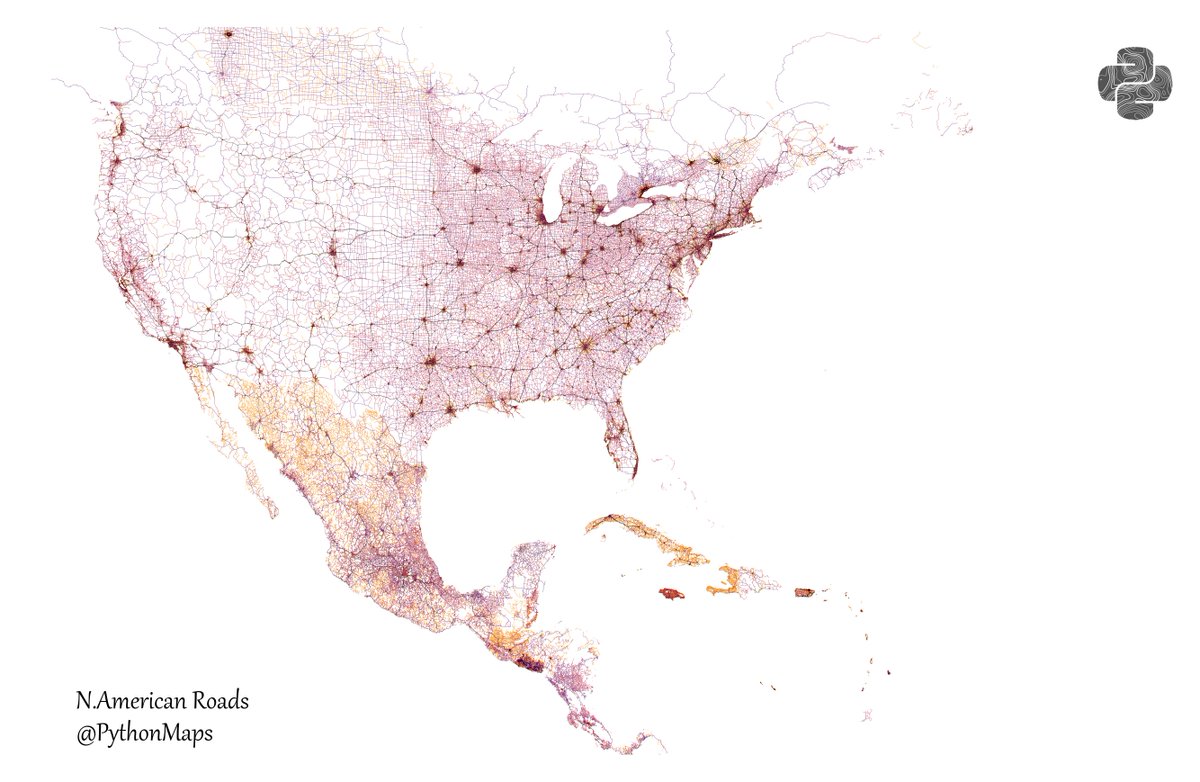
Roads of North America! Shows all roads from highways down to lanes and everything in between! The USA really is a country with two halves! This map was generated using #Matplotlib #Numpy #Geopandas. #Python #DataScience #Data #DataVisualization #Europe #infastructure.

🌍 تخيل أن تحول بياناتك إلى خرائط تفاعلية برمجياً! #GeoPandas هي السلاح السري في#بايثون للتعامل مع البيانات الجغرافية. تقرأ البيانات (بفضل Fiona) وترسمها بجمال (بمساعدة matplotlib). كل ما تحتاجه للبدء موجود هنا: geopandas.org/en/stable/abou… #تعلم_البرمجة#DataViz


#30DayMapChallenge Day 1: Points Incendios activos en Sudamérica las últimas 24 h. Source: VIIRS Active Fires #matplotlib #geopandas


Introduction to GIS Analysis with GeoPandas using Python #python #geopandas morioh.com/p/f7df5762aea0…

urban networks The road network of Budapest using a few lines of Python and the packages #osmnx #geopandas, and #matplotlib. Simple and beautiful. By milan_janosov #gischat #datascience #datavisualization #gis #geospatialdata #spatialdata #map #networkscience
Cell towers! This map shows the number of cell towers in Europe. Dark spots = lots of towers. #Matplotlib #Numpy #Geopandas. #Python #DataScience #Data #DataVisualization

Roads of Washington DC (and the surrounding area)! This map was generated using #Matplotlib #Numpy #Geopandas. #Python #DataScience #Data #DataVisualization

Cell towers! This map shows the number of cell towers in the USA. Dark spots = lots of towers. Classic "population density" map. #Matplotlib #Numpy #Geopandas. #Python #DataScience #Data #DataVisualization


GeoPandas: Análisis de datos geográficos en Python mappinggis.com/2021/11/geopan… #GeoPandas #shapely


Grab this GeoPandas Cheat Sheet and start transforming raw data into insightful maps. Share your fave tip! Link in the reply 👇 #GeoPandas #GIS #Python


🌍 تخيل أن تحول بياناتك إلى خرائط تفاعلية برمجياً! #GeoPandas هي السلاح السري في#بايثون للتعامل مع البيانات الجغرافية. تقرأ البيانات (بفضل Fiona) وترسمها بجمال (بمساعدة matplotlib). كل ما تحتاجه للبدء موجود هنا: geopandas.org/en/stable/abou… #تعلم_البرمجة#DataViz

Visualized both models using GeoDataFrame() for geospatial clustering. 📍 Helped me see how clusters form and how density plays a role. Clustering truly unlocks hidden patterns in raw data! #GeoPandas #DBSCAN #HDBSCAN #MLJourney

Geospatial Data 101 From mapping refugee camps to locating health gaps, GIS turns spatial data into lifesaving decisions. With GeoPandas in Python, humanitarian teams can map impact in minutes. #GIS #GeoPandas #HumanitarianData #Python #MappingForGood
Ecosistema de #Python para análisis espacial: +20 herramientas útiles rviv.ly/2QuvfB #GeoPandas #numpy #PyQGIS #QGIS

📊 تعلم كيف تُنشئ خرائط جذابة واحترافية باستخدام **#GeoPandas**! 🗺️ الدليل الشامل لرسم الخرائط يتضمن: ✔️ تخصيص الألوان والأنماط ✔️ إضافة عناصر الخريطة (مفاتيح، مقياس، إلخ) ✔️ أمثلة عملية بواسطة #Python 🔗 اكتشف المزيد geopandas.org/en/stable/docs… #نظم_المعلومات_الجغرافية


Spatial data tools shouldn’t live in silos. GeoPandas supports SDSL—a cross-language initiative uniting R, Python, and Julia devs to build shared tools and better science. Back community-powered collaboration like this at hubs.la/Q03v0HSH0 #FuelTheFuture #GeoPandas…

#SDSSN #PythonForDataScience #GeoPandas #SpatialAnalysis #GeoAI #GISCommunity #OpenSourceGIS #DataVisualization
Roads of London! This map was generated using #Matplotlib #Numpy #Geopandas. #Python #DataScience #Data #DataVisualization #London.

Working with complex spatial data? Lee Vaughan walks you through a structured process to identify and analyze shared political borders. It's a great example of #GeoPandas capabilities for tasks beyond simple mapping, relevant for ML practitioners dealing with location data.…


New #XArray + #GeoPandas tutorial for fast sampling of geospatial rasters. Learn how XArray can be used efficiently to extract data that is orders of magnitudes faster than other Python packages youtube.com/watch?v=AJHdwc…

youtube.com
YouTube
Sampling Raster Data with XArray (Geospatial Python Tutorials)

plotting a world map with country borders: the first step to play with world-wide data on the map… lol #python #geopandas #matplotlib #pyplot


Check out my latest @Medium article on map coloring (China Regions Map Coloring with Geopandas). Link to article: lnkd.in/d7PvTuK3 Link to Kaggle Notebook: lnkd.in/ds_v3jAe #Kaggle #GeoJSON #geopandas #networkx #graph #adjacency #map #coloring #shapely


Exciting news for the geospatial community! A new dedicated platform is now available for open-source geospatial Python tutorials, featuring #GeoPandas, #XArray, #Dask, and more. A great resource for anyone working with geospatial data. Thank you, @spatialthoughts, for making…
Launching a new home for all our open-source geospatial python tutorials - covering #GeoPandas, #XArray, #Dask, #XEE, #SamGeo and more. Check them out at geopythontutorials.com
Launching a new home for all our open-source geospatial python tutorials - covering #GeoPandas, #XArray, #Dask, #XEE, #SamGeo and more. Check them out at geopythontutorials.com

【TechBlog更新】 道路交通センサスのデータをGeoPandasで地図に可視化!東京都の主要道路の交通量をヒートマップで見える化する方法を解説。 #SENSY #Python #GeoPandas #テックブログ sensy-product.hatenablog.com/entry/2025/02/…

GeoPandas: Análisis de datos geográficos en Python rviv.ly/rSTzKb #GeoPandas #shapely


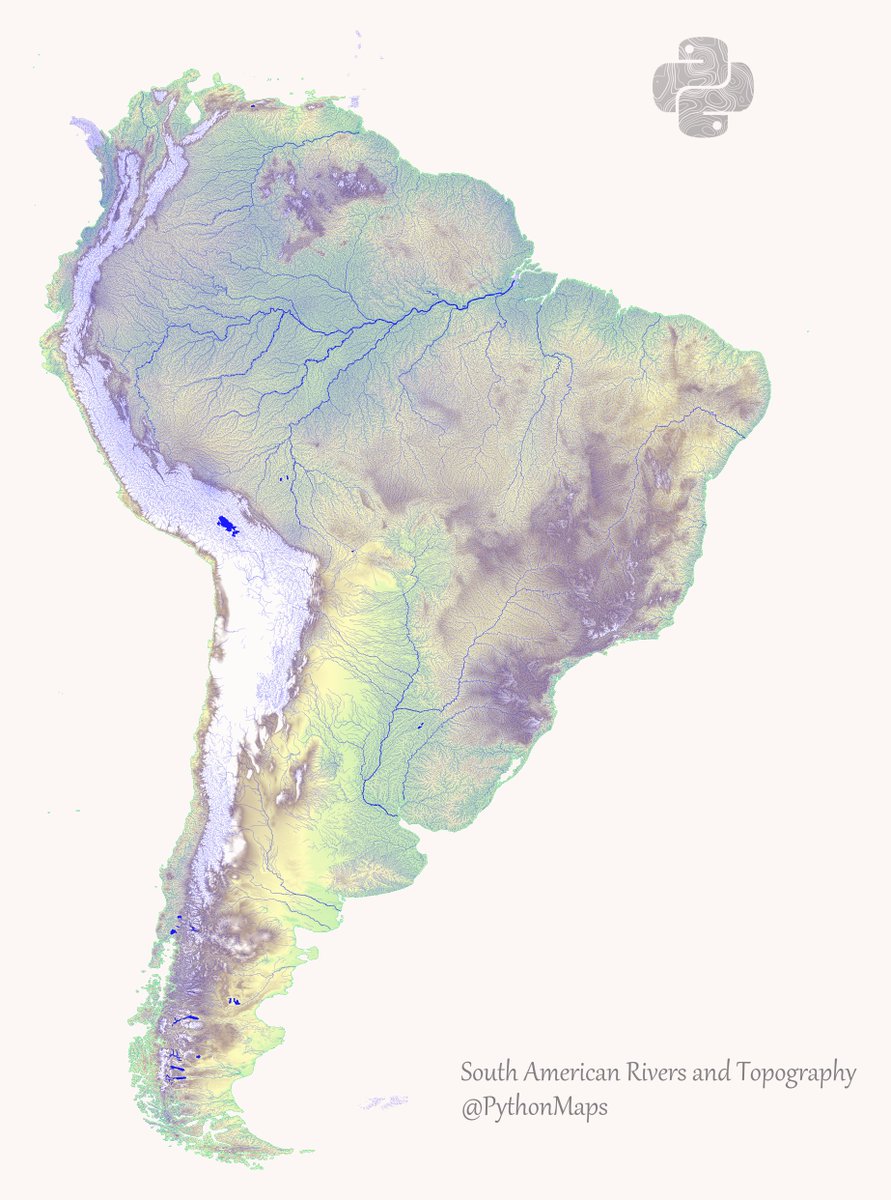
This is a map combining rivers and topography in the South America. Hopefully it shows the cool link between mountain ranges and waterways. This map was made with #Python using #geopandas and #matplotlib. #DataScience #Data #DataVisualization #SouthAmerica.
Roads of South America! Shows all roads from highways down to dirt tracks. This map was generated using #Matplotlib #Numpy #Geopandas. #Python #DataScience #Data #DataVisualization #SouthAmerica #infastructure.
Roads of Colombia! Shows all roads from highways down to dirt tracks. This map was generated using #Matplotlib #Numpy #Geopandas. #Python #DataScience #Data #DataVisualization #Africa #infastructure.
Mapping the power cables of South America. This map shows power cables around the world derived from open street map. This map was made with #Python using #geopandas and #matplotlib. #DataScience #Data #DataVisualization #SouthAmerica.

Roads of Europe! Shows all roads from highways (black) down to lanes (orange) and everything in between! This map was generated using #Matplotlib #Numpy #Geopandas. #Python #DataScience #Data #DataVisualization #Europe.
Railways! This map was generated using #Matplotlib #Numpy #Geopandas. #Python #DataScience #Data #DataVisualization #SouthAmerica #infastructure.

#AI Best: #Geopandas #Python: Hands-on - Intro to #Geospatial #MachineLearning. #BigData #Analytics #DataScience #IoT #IIoT #RStats #TensorFlow #JavaScript #ReactJS #CloudComputing #Serverless #DataScientist #Linux #Programming #Coding #100DaysofCode bit.ly/3sGs7pc


This map shows all of the earthquakes with a magnitude greater than 4.0 over the last 20 years, coloured according to their magnitude (blue (smallest) - red (largest). #Matplotlib #Numpy #Geopandas. #Python #DataScience #Data #DataVisualization #earthquake
🌍 تخيل أن تحول بياناتك إلى خرائط تفاعلية برمجياً! #GeoPandas هي السلاح السري في#بايثون للتعامل مع البيانات الجغرافية. تقرأ البيانات (بفضل Fiona) وترسمها بجمال (بمساعدة matplotlib). كل ما تحتاجه للبدء موجود هنا: geopandas.org/en/stable/abou… #تعلم_البرمجة#DataViz
Roads of London! This map was generated using #Matplotlib #Numpy #Geopandas. #Python #DataScience #Data #DataVisualization #London.
Roads of East Asia! Shows all roads from highways down to dirt tracks. This map was generated using #Matplotlib #Numpy #Geopandas. #Python #DataScience #Data #DataVisualization #Asia #infastructure.
This map shows all of the earthquakes with a magnitude greater than 4.0 over the last 20 years, coloured according to their magnitude (blue (smallest) - red (largest). #Matplotlib #Numpy #Geopandas. #Python #DataScience #Data #DataVisualization #earthquake

Roads of London! This map was generated using #Matplotlib #Numpy #Geopandas. #Python #DataScience #Data #DataVisualization #London.

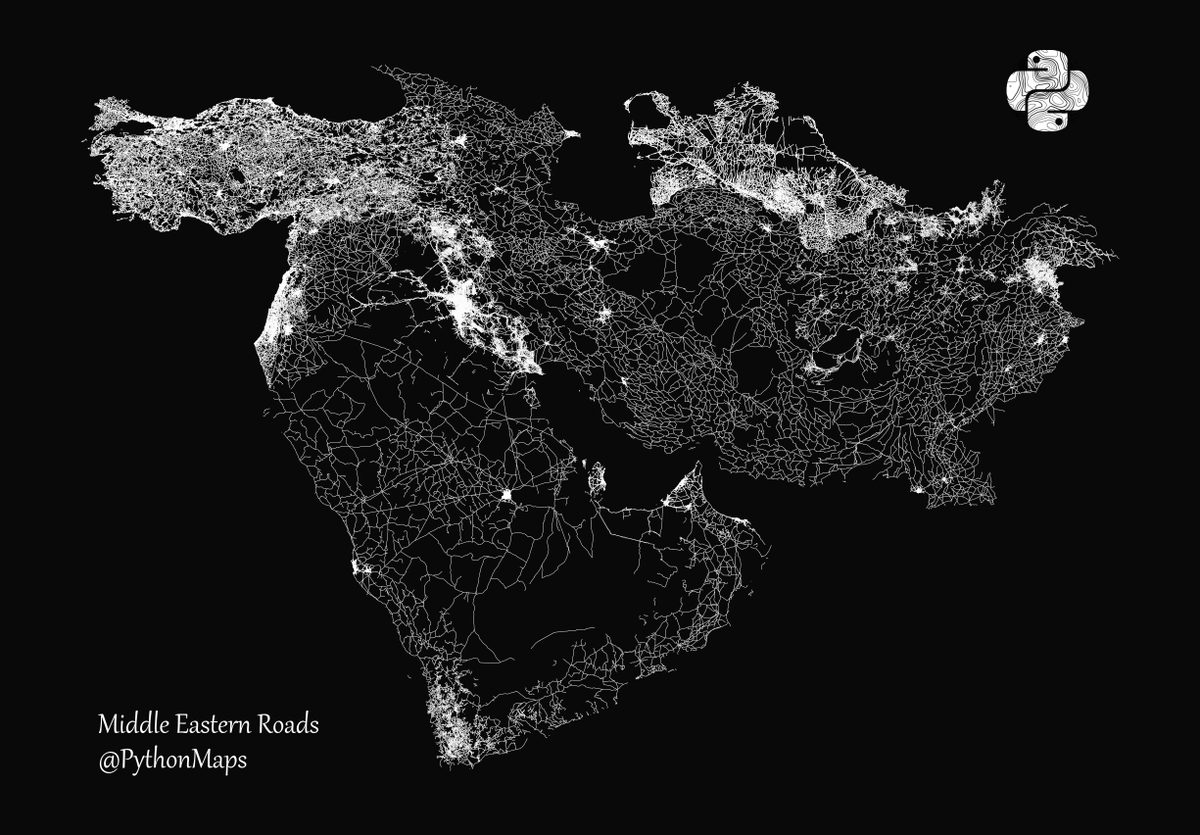
Roads of the middle east! This map was generated using #Matplotlib #Numpy #Geopandas. #Python #DataScience #Data #DataVisualization #China #India. 1/n
Roads of Australia! Shows all roads from highways down to lanes and everything in between! I don't think I have posted an Aus map before. This map was generated using #Matplotlib #Numpy #Geopandas. #Python #DataScience #Data #DataVisualization #Australia.

I like to plot the data and avoid plotting contextual information like borders or countries. However, here is an Africa rivers map with the coastlines plotted. Do you prefer it? This map was generated using #Matplotlib #Numpy #Geopandas. #Python #DataScience #Data #Africa.

Here is an North American rivers map with the coastlines plotted. Trying out a new logo with this one! This map was generated using #Matplotlib #Numpy #Geopandas. #Python #DataScience #Data #America #DataVisualization .

Wrote a new tutorial on Creating Maps with #GeoPandas where I introduce the main concepts and show how to create map layouts, multi-layer maps, and add labels. If you have found it hard to get started with matplotlib for mapping in #Python, check this out courses.spatialthoughts.com/python-foundat…

Something went wrong.
Something went wrong.
United States Trends
- 1. Epstein 702K posts
- 2. Steam Machine 34.8K posts
- 3. Bradley Beal 3,156 posts
- 4. Boebert 24.3K posts
- 5. Valve 24.2K posts
- 6. Virginia Giuffre 40.1K posts
- 7. Xbox 60.5K posts
- 8. Anthony Joshua 1,900 posts
- 9. Scott Boras N/A
- 10. #BLACKROCK_NXXT N/A
- 11. GabeCube 2,301 posts
- 12. Rosalina 65K posts
- 13. Clinton 100K posts
- 14. Mel Tucker N/A
- 15. H-1B 95.1K posts
- 16. Zverev 3,288 posts
- 17. Jordan Humphrey N/A
- 18. Jameis 9,009 posts
- 19. Michael Wolff 17.2K posts
- 20. #NASDAQ_NXXT N/A