#graphvisualisation kết quả tìm kiếm

Techniques for effective #graphvisualisation by Dan Williams @CambridgeIntel Visit CDL on the 16th f November- IET connected-data.london


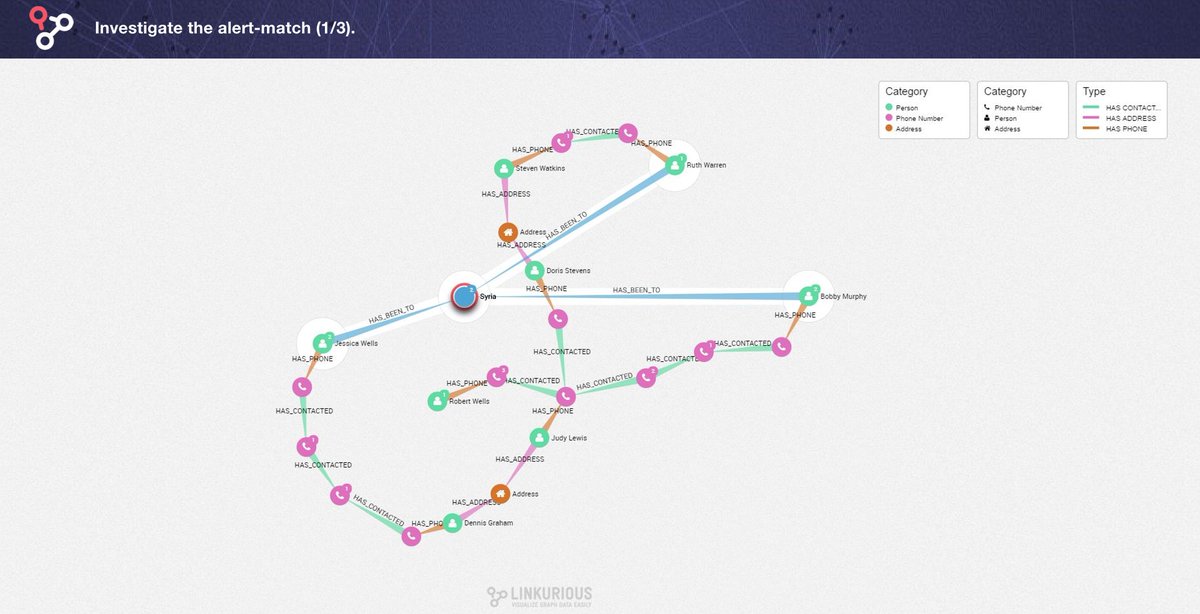
How to investigate criminal networks with Linkurious. #graphvisualisation #presentation #neo4j buff.ly/2hPWqpX
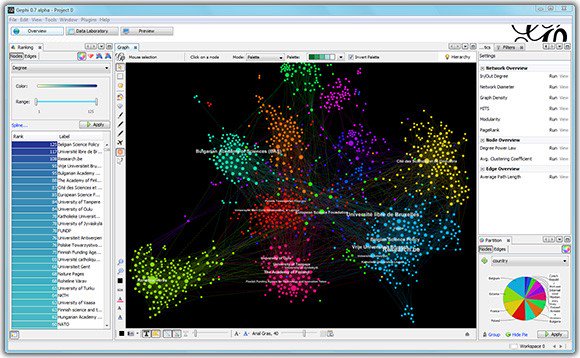
Take a look at the top 5 graph visualisation tools that impressed us! buff.ly/1ldTTXy #GraphVisualisation


Get your own Digital Investigative Board here: hubs.ly/H0xNvbZ0 #investigation #OSINT #graphvisualisation #reknowledgesnips


My first #graphvisualisation project with KeyLines 🤩

When Gizem joined our team back in January, one of her first tasks was to learn about our graph visualization technology. In this blog post, she describes her first experience of visualizing data with KeyLines buff.ly/2FRk1Fl

This comprehensive tutorial is a fantastic starting point for planning #GraphVisualisation using #R. kateto.net/network-visual…

ICYMI, we launched a new #graphvisualisation tool to help you explore #beneficialownership. Here's @sheislaurence explaining why it matters: openownership.org/news/what-grap…
openownership.org
What graph visualisation teaches us about beneficial ownership
We’re excited to be launching a new version of our graph visualisation functionality to the OpenOwnership Register. We hope this will act as a powerful resource for journalists, policy makers and...
"With the ability to view a person’s network, previously unavailable on the Register, it is now possible to understand how far reaching a single person’s control can be" says @sheislaurence Just one way that #GraphVisualisation can support investigators: openownership.org/news/what-grap…
openownership.org
What graph visualisation teaches us about beneficial ownership
We’re excited to be launching a new version of our graph visualisation functionality to the OpenOwnership Register. We hope this will act as a powerful resource for journalists, policy makers and...
How #GraphVisualisation can help analysts, investigators and activists better understand who owns and controls our companies: openownership.org/news/what-grap… @sheislaurence #BOT #BeneficialOwnership #Register
openownership.org
What graph visualisation teaches us about beneficial ownership
We’re excited to be launching a new version of our graph visualisation functionality to the OpenOwnership Register. We hope this will act as a powerful resource for journalists, policy makers and...
How can policy makers use OpenOwnership's #graphvisualisation of #beneficialownership? @sheislaurence explores why visualisation is a powerful storytelling device for policy makers – and why it shows the need for #opendata on corporate ownership. 👇 openownership.org/news/graph-vis…

"Building our #graphvisualisation tool... forced us to think beyond obvious implementation provisions towards use and best practice." @sheislaurence explains how building OpenOwnership's new feature revealed new insights for #beneficialownership #policy. openownership.org/news/graph-vis…

Top 5 #GraphVisualisation Tools. via @datatovalue ow.ly/V3s4B
More data and less time to process it? Data visualisation and more specifically graph visualisation can be the solution. See our exploration of graph visualisation and its benefits in our latest blog post. #data #datavisualisation #graphvisualisation hubs.ly/H0sTWlh0
RT OpenOwnership "ICYMI, we launched a new #graphvisualisation tool to help you explore #beneficialownership. Here's sheislaurence explaining why it matters: openownership.org/news/what-grap…"
openownership.org
What graph visualisation teaches us about beneficial ownership
We’re excited to be launching a new version of our graph visualisation functionality to the OpenOwnership Register. We hope this will act as a powerful resource for journalists, policy makers and...

#NODES2020 Recap: @miromarchi and Michal Trnka explore 10 of the most useful graph entity states using Cypher to enrich entities with contextual information enabling powerful interactions. Watch it here: bit.ly/10PlusEntitySt… @neo4j #GraphDatabases #GraphVisualisation

RT OpenOwnership ""With the ability to view a person’s network, previously unavailable on the Register, it is now possible to understand how far reaching a single person’s control can be" says sheislaurence Just one way that #GraphVisualisation can … openownership.org/news/what-grap…"
openownership.org
What graph visualisation teaches us about beneficial ownership
We’re excited to be launching a new version of our graph visualisation functionality to the OpenOwnership Register. We hope this will act as a powerful resource for journalists, policy makers and...
RT OpenOwnership ""Building our #graphvisualisation tool... forced us to think beyond obvious implementation provisions towards use and best practice." sheislaurence explains how building OpenOwnership's new feature revealed new insights for #benefi… openownership.org/news/graph-vis…"
#NODES2020 Recap: @miromarchi and Michal Trnka explore 10 of the most useful graph entity states using Cypher to enrich entities with contextual information enabling powerful interactions. Watch it here: bit.ly/10PlusEntitySt… @neo4j #GraphDatabases #GraphVisualisation
Get your own Digital Investigative Board here: hubs.ly/H0xNvbZ0 #investigation #OSINT #graphvisualisation #reknowledgesnips
More data and less time to process it? Data visualisation and more specifically graph visualisation can be the solution. See our exploration of graph visualisation and its benefits in our latest blog post. #data #datavisualisation #graphvisualisation hubs.ly/H0sTWlh0
RT OpenOwnership "How #GraphVisualisation can help analysts, investigators and activists better understand who owns and controls our companies: openownership.org/news/what-grap… sheislaurence #BOT #BeneficialOwnership #Register"
openownership.org
What graph visualisation teaches us about beneficial ownership
We’re excited to be launching a new version of our graph visualisation functionality to the OpenOwnership Register. We hope this will act as a powerful resource for journalists, policy makers and...
How #GraphVisualisation can help analysts, investigators and activists better understand who owns and controls our companies: openownership.org/news/what-grap… @sheislaurence #BOT #BeneficialOwnership #Register
openownership.org
What graph visualisation teaches us about beneficial ownership
We’re excited to be launching a new version of our graph visualisation functionality to the OpenOwnership Register. We hope this will act as a powerful resource for journalists, policy makers and...
RT OpenOwnership ""Building our #graphvisualisation tool... forced us to think beyond obvious implementation provisions towards use and best practice." sheislaurence explains how building OpenOwnership's new feature revealed new insights for #benefi… openownership.org/news/graph-vis…"
"Building our #graphvisualisation tool... forced us to think beyond obvious implementation provisions towards use and best practice." @sheislaurence explains how building OpenOwnership's new feature revealed new insights for #beneficialownership #policy. openownership.org/news/graph-vis…
RT OpenOwnership "How can policy makers use OpenOwnership's #graphvisualisation of #beneficialownership? sheislaurence explores why visualisation is a powerful storytelling device for policy makers – and why it shows the need for #opendata on corpo… openownership.org/news/graph-vis…"
How can policy makers use OpenOwnership's #graphvisualisation of #beneficialownership? @sheislaurence explores why visualisation is a powerful storytelling device for policy makers – and why it shows the need for #opendata on corporate ownership. 👇 openownership.org/news/graph-vis…
RT OpenOwnership "ICYMI, we launched a new #graphvisualisation tool to help you explore #beneficialownership. Here's sheislaurence explaining why it matters: openownership.org/news/what-grap…"
openownership.org
What graph visualisation teaches us about beneficial ownership
We’re excited to be launching a new version of our graph visualisation functionality to the OpenOwnership Register. We hope this will act as a powerful resource for journalists, policy makers and...
ICYMI, we launched a new #graphvisualisation tool to help you explore #beneficialownership. Here's @sheislaurence explaining why it matters: openownership.org/news/what-grap…
openownership.org
What graph visualisation teaches us about beneficial ownership
We’re excited to be launching a new version of our graph visualisation functionality to the OpenOwnership Register. We hope this will act as a powerful resource for journalists, policy makers and...
RT OpenOwnership ""With the ability to view a person’s network, previously unavailable on the Register, it is now possible to understand how far reaching a single person’s control can be" says sheislaurence Just one way that #GraphVisualisation can … openownership.org/news/what-grap…"
openownership.org
What graph visualisation teaches us about beneficial ownership
We’re excited to be launching a new version of our graph visualisation functionality to the OpenOwnership Register. We hope this will act as a powerful resource for journalists, policy makers and...
"With the ability to view a person’s network, previously unavailable on the Register, it is now possible to understand how far reaching a single person’s control can be" says @sheislaurence Just one way that #GraphVisualisation can support investigators: openownership.org/news/what-grap…
openownership.org
What graph visualisation teaches us about beneficial ownership
We’re excited to be launching a new version of our graph visualisation functionality to the OpenOwnership Register. We hope this will act as a powerful resource for journalists, policy makers and...
My first #graphvisualisation project with KeyLines 🤩
When Gizem joined our team back in January, one of her first tasks was to learn about our graph visualization technology. In this blog post, she describes her first experience of visualizing data with KeyLines buff.ly/2FRk1Fl
Techniques for effective #graphvisualisation by Dan Williams @CambridgeIntel Visit CDL on the 16th f November- IET connected-data.london
This comprehensive tutorial is a fantastic starting point for planning #GraphVisualisation using #R. kateto.net/network-visual…
How to investigate criminal networks with Linkurious. #graphvisualisation #presentation #neo4j buff.ly/2hPWqpX
Techniques for effective #graphvisualisation by Dan Williams @CambridgeIntel Visit CDL on the 16th f November- IET connected-data.london
How to investigate criminal networks with Linkurious. #graphvisualisation #presentation #neo4j buff.ly/2hPWqpX
Take a look at the top 5 graph visualisation tools that impressed us! buff.ly/1ldTTXy #GraphVisualisation
Get your own Digital Investigative Board here: hubs.ly/H0xNvbZ0 #investigation #OSINT #graphvisualisation #reknowledgesnips
Something went wrong.
Something went wrong.
United States Trends
- 1. Dodgers 775K posts
- 2. World Series 411K posts
- 3. Blue Jays 156K posts
- 4. Yamamoto 242K posts
- 5. Will Smith 54.1K posts
- 6. jungkook 356K posts
- 7. Nigeria 791K posts
- 8. Miguel Rojas 46.7K posts
- 9. #River 5,122 posts
- 10. Yankees 16.6K posts
- 11. Carlos Manzo 320K posts
- 12. #Worlds2025 46.1K posts
- 13. Baseball 175K posts
- 14. #T1WIN 15.4K posts
- 15. Kershaw 40.3K posts
- 16. Kendrick 19.2K posts
- 17. Ohtani 94.8K posts
- 18. Vladdy 23.6K posts
- 19. Mets 11.9K posts
- 20. Dave Roberts 15.5K posts