#matplotlib search results


"I used to feel guilty in Cambridge that I spent all day playing games, while I was supposed to be doing mathematics. Then I realized that playing games is math." John H. Conway Made with #python #numpy #matplotlib
The Bak-Sneppen model: species in a circle, each with random fitness. Replace the weakest species (and its neighbors) with new random values. Cascading evolutionary avalanches emerge, showing self-organized criticality from simple rules. Made with #python #numpy #matplotlib


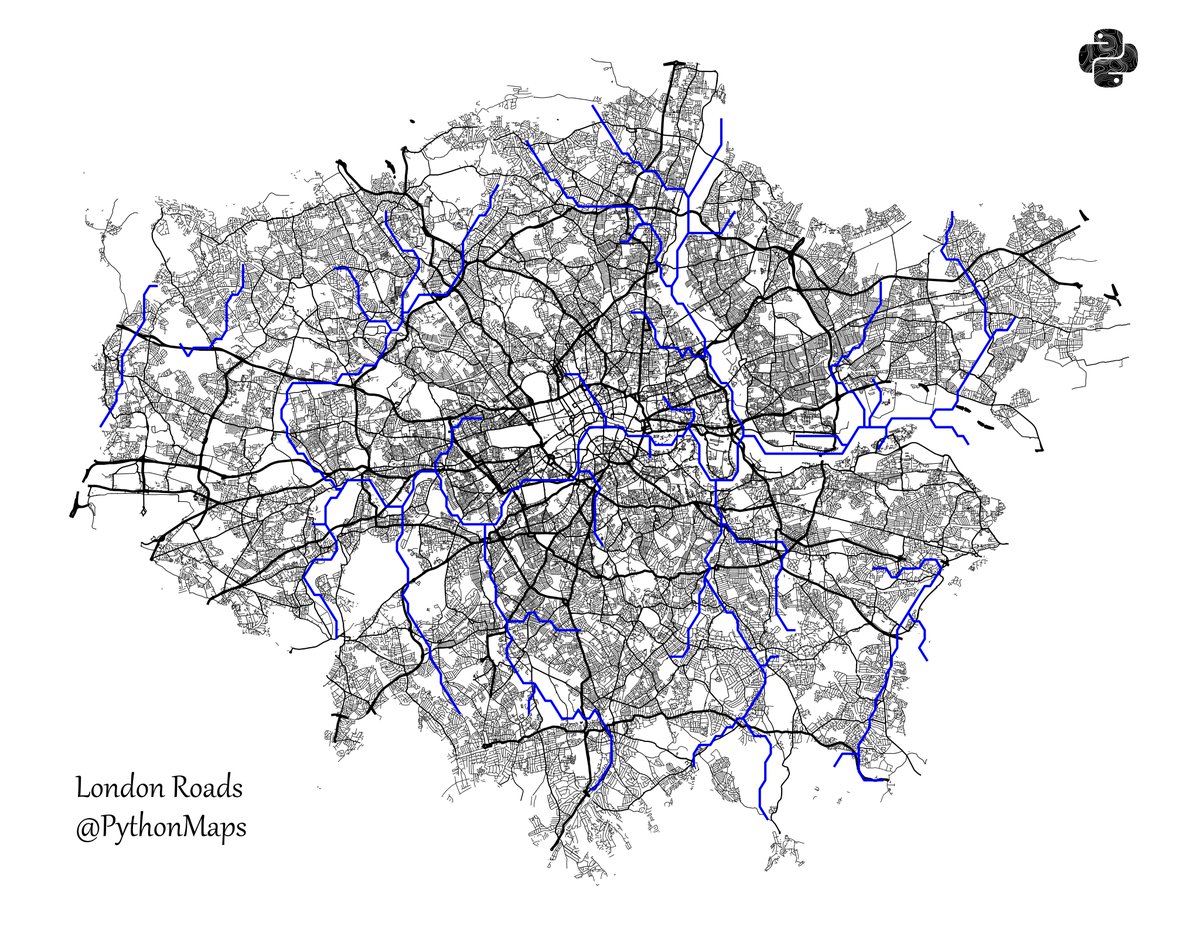
Roads of London! This map was generated using #Matplotlib #Numpy #Geopandas. #Python #DataScience #Data #DataVisualization #London.

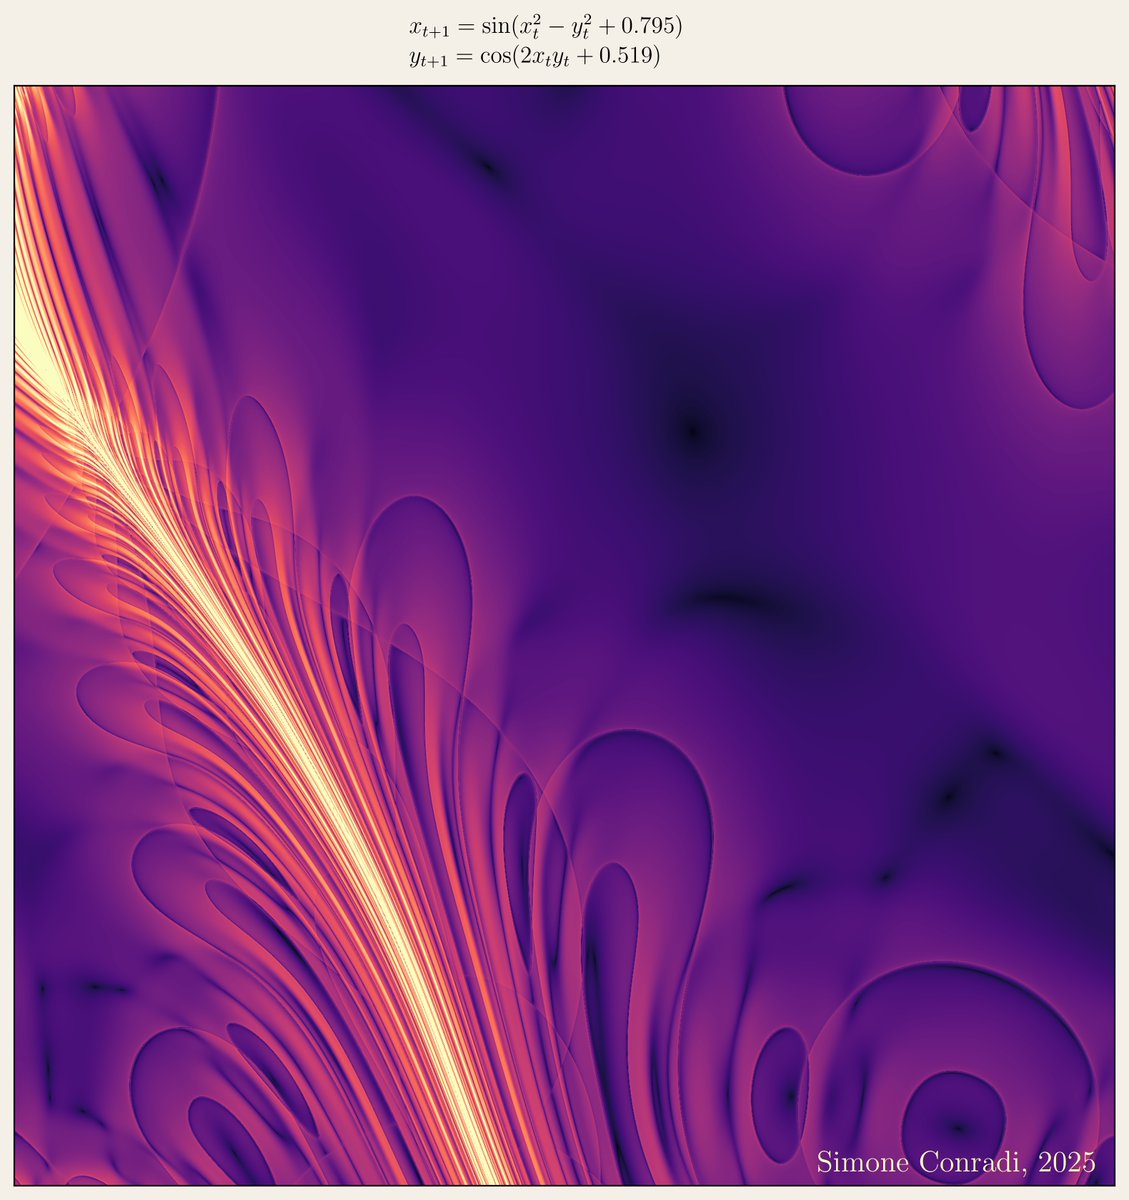

"Infinitely varied in its effects, nature is simple only in its causes, and its economy consists in producing a great number of phenomena, often very complicated, by means of a small number of general laws" Pierre Laplace Made with #python #numpy #matplotlib #sympy

The iterates of the logistic map converging to Feigenbaum's universal function. Made with #python #numpy #matplotlib
Bak, Tang & Wiesenfeld's sandpile model demonstrates Self-Organized Criticality perfectly: one grain triggers massive avalanches! Small events, large and non-local consequences - maybe also in markets, politics, ecology. Made with #python #numpy #matplotlib


📊 Pythonで「ちょっとしたグラフ」を書きたい? matplotlib なら数行でOK。 売上データを折れ線グラフにしてみると直感的に分かりやすい。 数字の表より一目で伝わる。 #Python #matplotlib #データ可視化


#NumPy, #Pandas, #Matplotlib in #Python for #MachineLearning. #BigData #Analytics #DataScience #AI #IoT #IIoT #RStats #TensorFlow #Java #JavaScript #ReactJS #GoLang #CloudComputing #Serverless #DataScientist #Linux #Programming #Coding #100DaysofCode geni.us/Numpy-Pandas-M…


Day 46 of #100DaysOfCode Launched my MERN project (final fixes, responsiveness, detailed README) Added 2 more queries in Netflix data viz (Matplotlib) Trained & deployed Linear + Multi Regression models on Streamlit #MERN #Matplotlib #MachineLearning #Streamlit


Simulating rainbows of different orders in #Python with #NumPy and #Matplotlib: scipython.com/blog/higher-or…

A simple MCMC (heat bath) simulation of the 3D Ising model in magnetic field, equivalent to the lattice gas-liquid model at finite temperature and chemical potential. A good excuse to try using voxels in @matplotlib Made with #python #numpy #matplotlib


Add Labels to #Matplotlib Bar Charts pythonguides.com/matplotlib-bar…

#Matplotlib Two Y Axes in Python pythonguides.com/matplotlib-two…

Plot Log-Log Plots with Error Bars and Grid Using #Matplotlib pythonguides.com/log-log-plots-…

Change the Default Background Color in #Matplotlib pythonguides.com/matplotlib-cha…

Change Inner and Outer Background Colors in #Matplotlib pythonguides.com/matplotlib-cha…

Transparent Plot Backgrounds & Legend Styling in #Matplotlib pythonguides.com/transparent-pl…

How to Plot Asymmetric Error Bars in #Matplotlib pythonguides.com/matplotlib-plo…

Remove Tick Labels from Subplots in #Matplotlib pythonguides.com/matplotlib-rem…

#Matplotlib Remove Colorbar and Specific Tick Labels pythonguides.com/matplotlib-rem…


(Open Access) SciPy Lecture Notes: lnkd.in/esxvnXhp Look for "Read and Download Links" section to download. Follow me if you like. #Python #programming #Matplotlib #Pandas #NumPy #SciPy #DeepLearning #PyTorch #TensorFlow #LLMs #GenAI #GenerativeAI #BigData #DataScience

How to Rotate Date Tick Labels in #Matplotlib pythonguides.com/matplotlib-rot…

How to Rotate and Align Tick Labels in #Matplotlib pythonguides.com/matplotlib-rot…

Rotate Tick Labels 45 and 90 Degrees in #Matplotlib pythonguides.com/rotate-tick-la…

Change Background Color of #Matplotlib Subplot Based on Value pythonguides.com/change-backgro…

Transparent Plot Backgrounds & Legend Styling in #Matplotlib pythonguides.com/transparent-pl…
Change Inner and Outer Background Colors in #Matplotlib pythonguides.com/matplotlib-cha…
Change the Default Background Color in #Matplotlib pythonguides.com/matplotlib-cha…

day 81 of #100DaysOfCode Leetcode biweekly contest Solved 2 questions stucked on 3rd #pandas- worked on countries data to get hands on of various functions Started with #matplotlib How to create plot plt.plot() how to set title labels How to create subplots #Python #Contest


Whitebox Workflows can now interact with #matplotlib to make beautiful visualization of raster, vector, and #lidar #geospatial data. #geopython #gis #gischat #geovis More examples here: whiteboxgeo.com/manual/wbw-use…

Roads of London! This map was generated using #Matplotlib #Numpy #Geopandas. #Python #DataScience #Data #DataVisualization #London.


📊 Pythonで「ちょっとしたグラフ」を書きたい? matplotlib なら数行でOK。 売上データを折れ線グラフにしてみると直感的に分かりやすい。 数字の表より一目で伝わる。 #Python #matplotlib #データ可視化


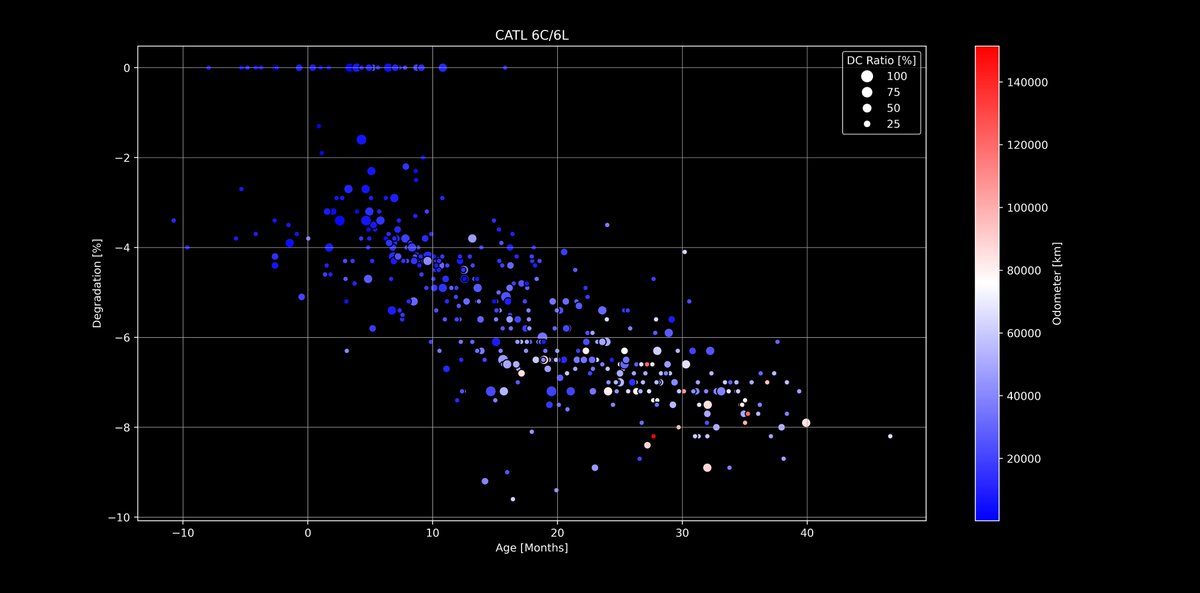
🔋#Tesla Battery Degradation - Next level dive!🪫 Using #Matplotlib I have added two more axis to the evaluations that you already know. I will continue with other packs and values, but LFP was interesting as a start 🙂 Any ideas what to combine next? docs.google.com/spreadsheets/d…


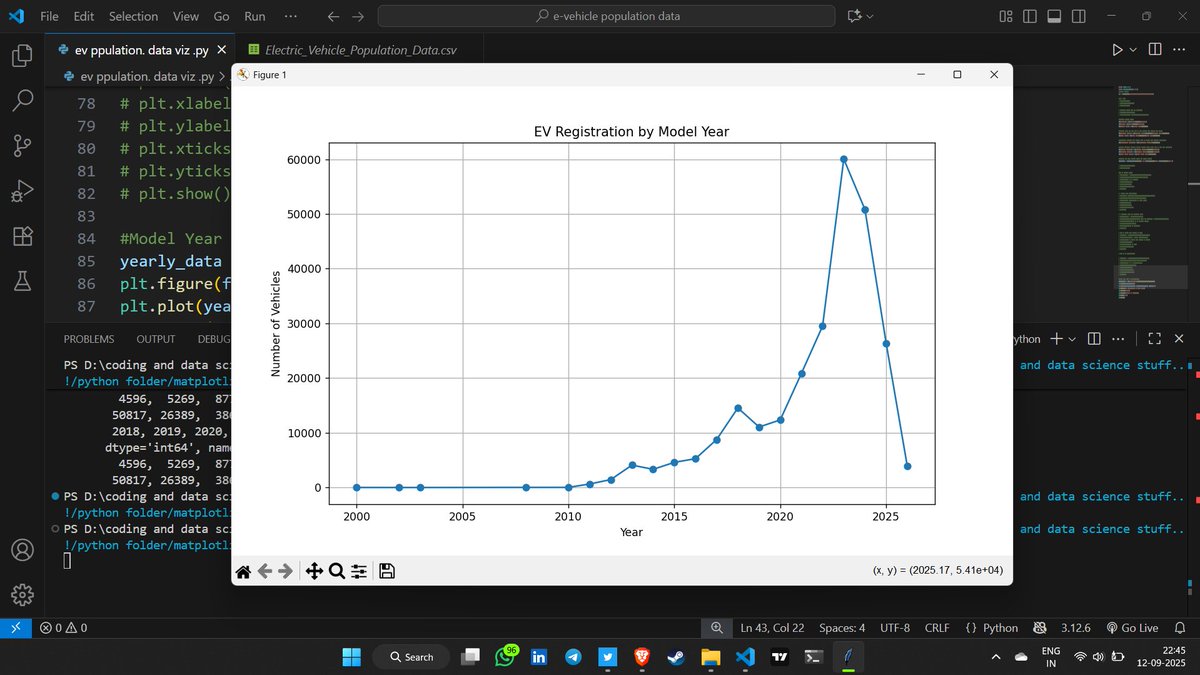
🚀 Day 34 #DataScience Journey! Practiced Python matplotlib on EV dataset today 📊 Getting better at data visualization! Tomorrow exploring new dataset - excited for fresh challenges 💪 Consistency = Growth! 📈 #Python #Matplotlib #DataVisualization #LearningInPublic

matplotlib豆知識 subplots で作成した余分な Axes を remove() で簡単に除外できます! 中身のないグラフ枠を削除して、見やすいレイアウトに仕上げられます #Python #matplotlib

#NumPy, #Pandas, #Matplotlib in #Python for #MachineLearning. #BigData #Analytics #DataScience #AI #IoT #IIoT #RStats #TensorFlow #Java #JavaScript #ReactJS #GoLang #CloudComputing #Serverless #DataScientist #Linux #Programming #Coding #100DaysofCode geni.us/Numpy-Pandas-M…


#30DayMapChallenge Day 1: Points Incendios activos en Sudamérica las últimas 24 h. Source: VIIRS Active Fires #matplotlib #geopandas


Something went wrong.
Something went wrong.
United States Trends
- 1. #DWTS 33.6K posts
- 2. Northern Lights 12.2K posts
- 3. Elaine 56.1K posts
- 4. #Aurora 3,019 posts
- 5. #RHOSLC 4,821 posts
- 6. Dylan 30.2K posts
- 7. Robert 97.1K posts
- 8. Whitney 8,194 posts
- 9. Louisville 10.6K posts
- 10. #WWENXT 10.8K posts
- 11. Alix 8,508 posts
- 12. Carrie Ann 1,606 posts
- 13. Meredith 3,412 posts
- 14. Kentucky 22K posts
- 15. Daniella 2,901 posts
- 16. Pope 25.6K posts
- 17. Wake Forest 2,280 posts
- 18. Oweh 1,023 posts
- 19. #DancingWithTheStars N/A
- 20. Jordan Walsh N/A