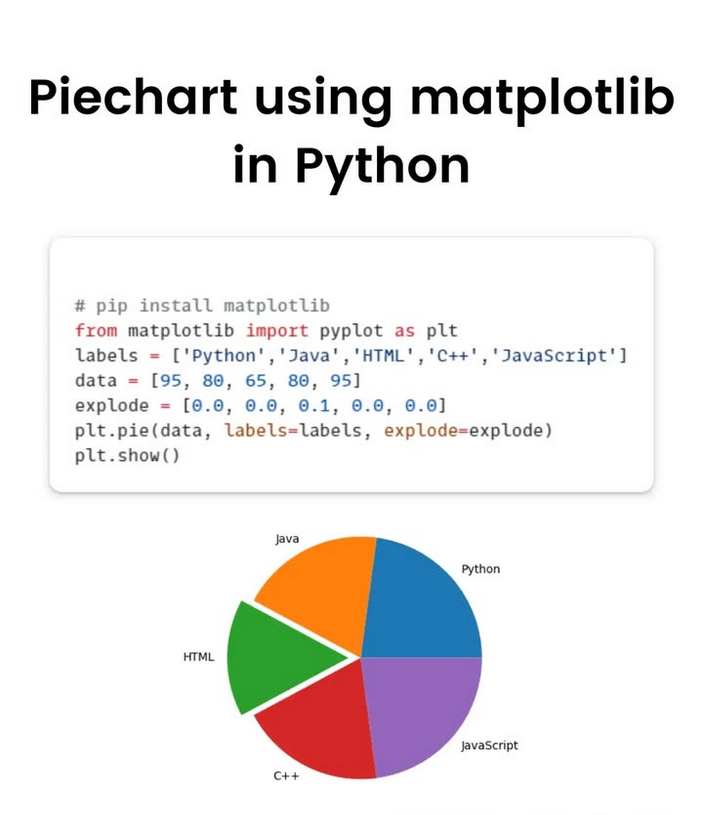
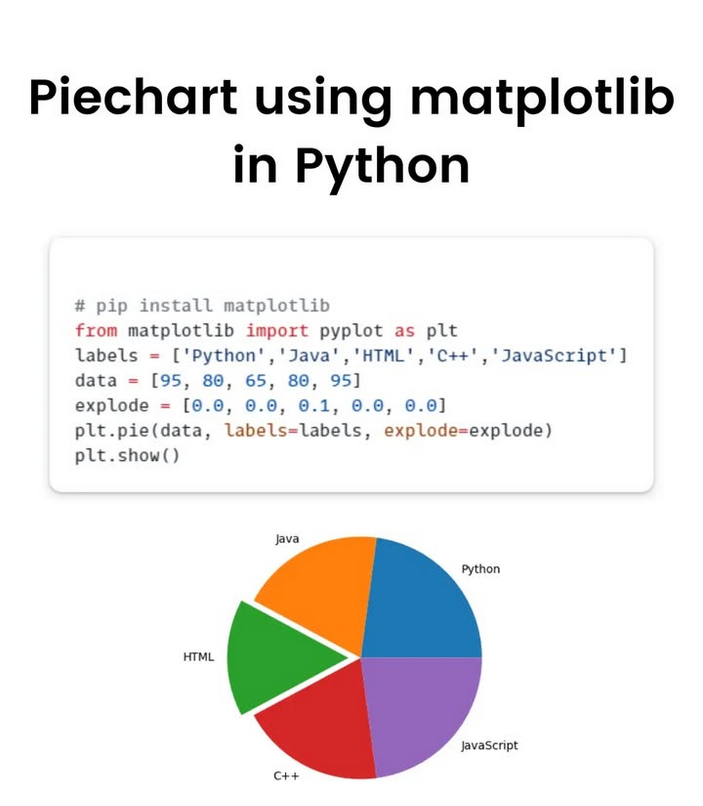
#matplotlib 搜尋結果

Plot Multiple Lines of Different Lengths in #Matplotlib pythonguides.com/plot-multiple-…
🔥 Master the art of data visualization with Python’s most popular library — Matplotlib. Free tutorials available now! Watch here: youtube.com/playlist?list=… #Python #DataScience #Matplotlib #MachineLearning #Visualization
Add Legends in #Matplotlib Scatter Plots pythonguides.com/matplotlib-sca…

📈 Create Charts Using Matplotlib in Just Seconds Perfect for beginners and anyone building tools for analysis or algorithmic trading. 👇 Try it yourself and tell me what chart you want to learn next! 📍 For More Details: tradehull.com . . . #matplotlib #python
#Matplotlib log-log: Use Base 2 and Handle Negative Values pythonguides.com/matplotlib-log…
pythonguides.com
Matplotlib log-log: Use Base 2 and Handle Negative Values
Learn how to use Matplotlib loglog plots with base 2 scaling and handle negative values in Python. Includes step-by-step methods with full code examples.

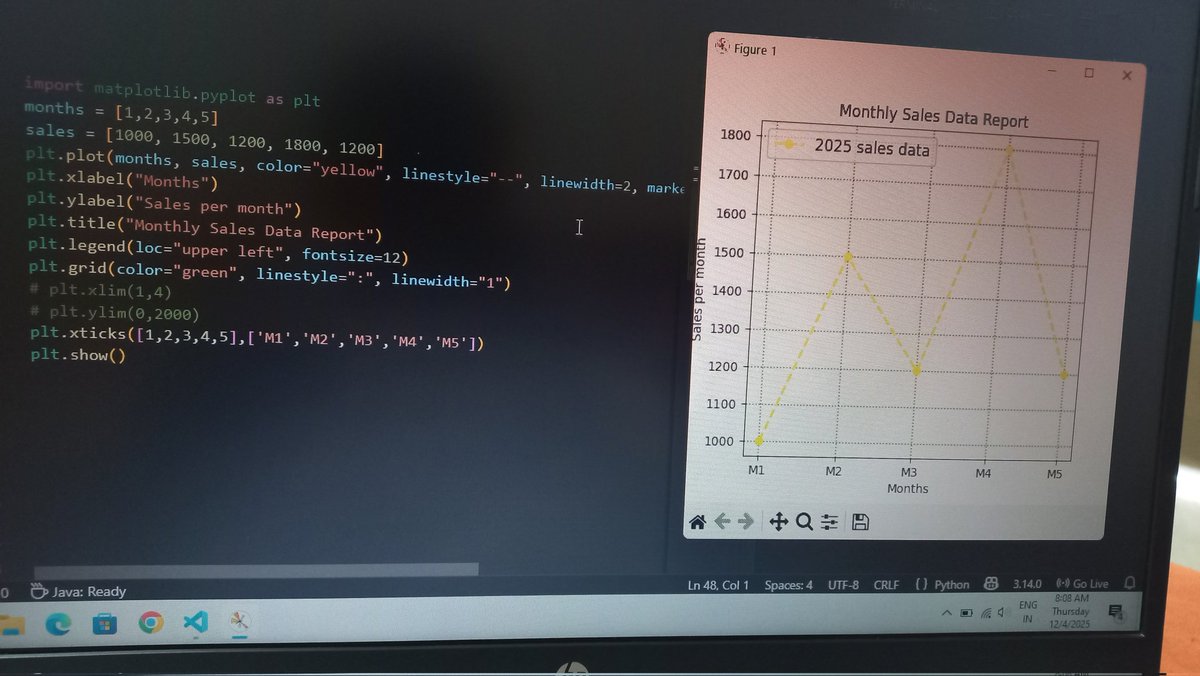
Created a Monthly Sales Data Report using Python Matplotlib. Loving how coding turns numbers into meaningful stories. #PythonLearner #DataVisualization #Matplotlib #CodingJourney
#Matplotlib Errorbar with Horizontal Line in #Python pythonguides.com/matplotlib-err…
pythonguides.com
Matplotlib Errorbar with Horizontal Line in Python
Learn how to use Matplotlib errorbar with a horizontal line in Python. Step-by-step tutorial with practical code examples for clear data visualization.

How to Set Axis Range in #Matplotlib pythonguides.com/matplotlib-set…
How to Share Axis and Axis Labels in #Matplotlib Subplots pythonguides.com/share-axis-and…
pythonguides.com
How to Share Axis and Axis Labels in Matplotlib Subplots
Learn how to share axis and axis labels in Matplotlib subplots using Python. Step-by-step examples with code to create clean, professional visualizations.
Create a Bar Chart with Values in #Matplotlib pythonguides.com/matplotlib-bar…
pythonguides.com
Create a Bar Chart with Values in Matplotlib
Learn step-by-step how to create a bar chart with values in Matplotlib using Python. Add labels, customize charts, and make professional visualizations.

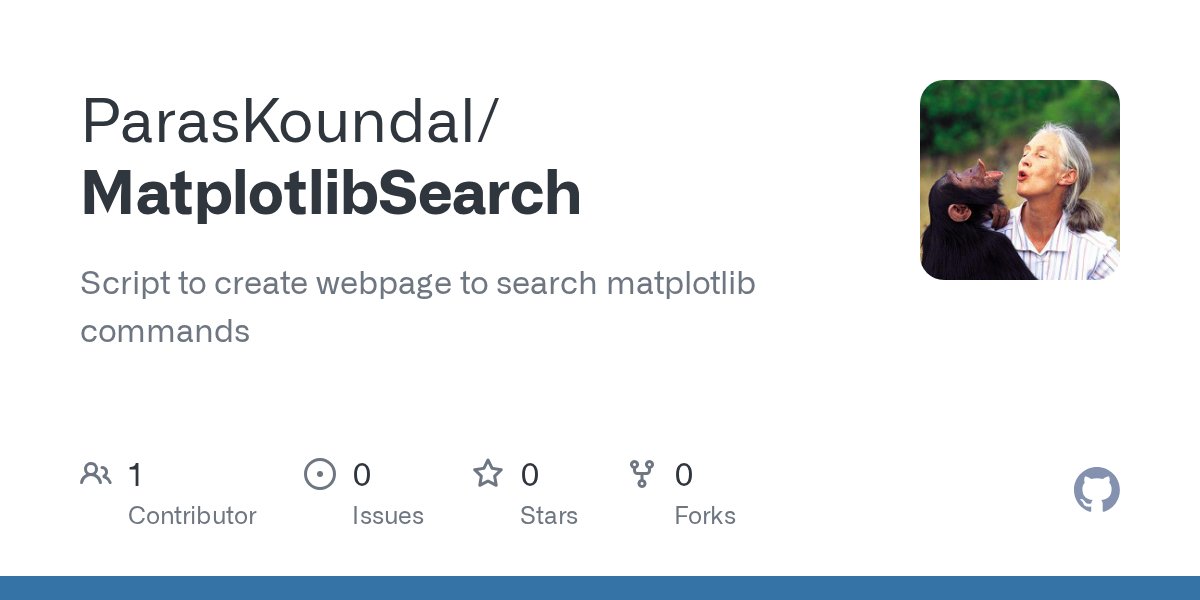
The python script to automatically generate the webpage: github.com/ParasKoundal/M… #matplotlib #github
Got tired of digging for the right Matplotlib command using matplotlib search, so I built my own search tool to do it for me 😎📊 Give it a spin: paraskoundal.com/funProjects/pl… #Python #Matplotlib #DataViz #buildinpublic
How to Create Multiple Plots in #Matplotlib pythonguides.com/matplotlib-mul…
How to Draw Horizontal Lines in #Matplotlib pythonguides.com/horizontal-lin…
How to Change #Matplotlib Legend Font Size pythonguides.com/matplotlib-leg…
#Matplotlib Subplot Title Style – Change Position and Padding pythonguides.com/matplotlib-sub…
pythonguides.com
Matplotlib Subplot Title Style – Change Position and Padding
Learn how to customize Matplotlib subplot title style in Python. Step-by-step guide to change font size, make bold, adjust position, and padding with examples.
Plot Multiple Lines with Legends in #Matplotlib pythonguides.com/python-plot-mu…
Plot Log-Log Scatter and Histogram Charts in #Matplotlib pythonguides.com/log-log-scatte…
pythonguides.com
Plot Log-Log Scatter and Histogram Charts in Matplotlib
Learn to plot log-log scatter and histogram charts in Python Matplotlib with 2 simple methods each. Step-by-step examples with full code for data visualization.


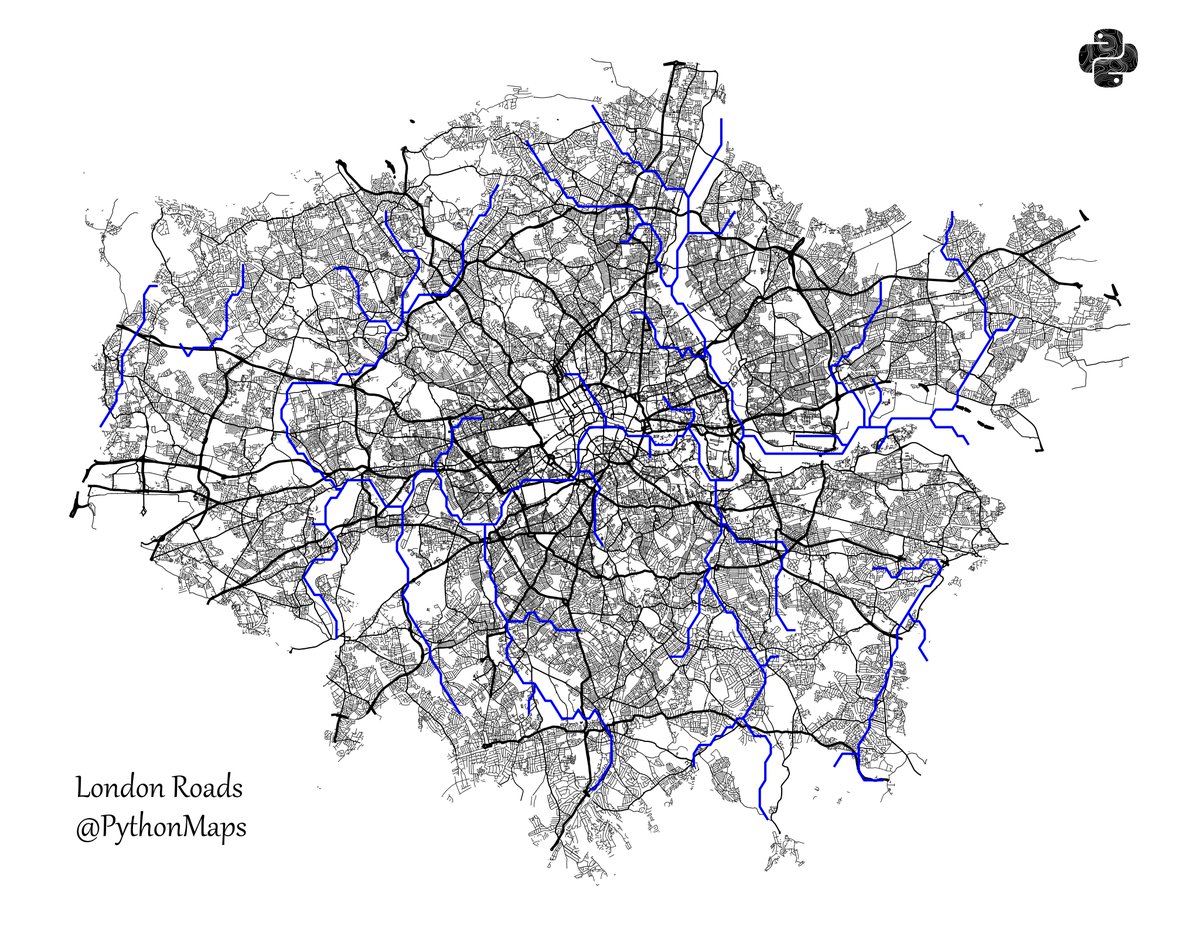
Roads of London! This map was generated using #Matplotlib #Numpy #Geopandas. #Python #DataScience #Data #DataVisualization #London.


matplotlib豆知識 subplots で作成した余分な Axes を remove() で簡単に除外できます! 中身のないグラフ枠を削除して、見やすいレイアウトに仕上げられます #Python #matplotlib


制限付きランダムウォークを並列して実行した軌跡をプロットした。 互いの初期位置が近いこともあってか、行き場を無くした点が意外と早く出現するらしく、ステップ数を多くしてもすぐに実行が終わってしまう。 #matplotlib #python


#30DayMapChallenge Day 1: Points Incendios activos en Sudamérica las últimas 24 h. Source: VIIRS Active Fires #matplotlib #geopandas


Wondering how to make your legend more popular than ever? Add some new friends! 🕺📚 Source: devhubby.com/thread/how-to-… #PythonData #DataScienceCommunity #Matplotlib #AICommunity #items #legend


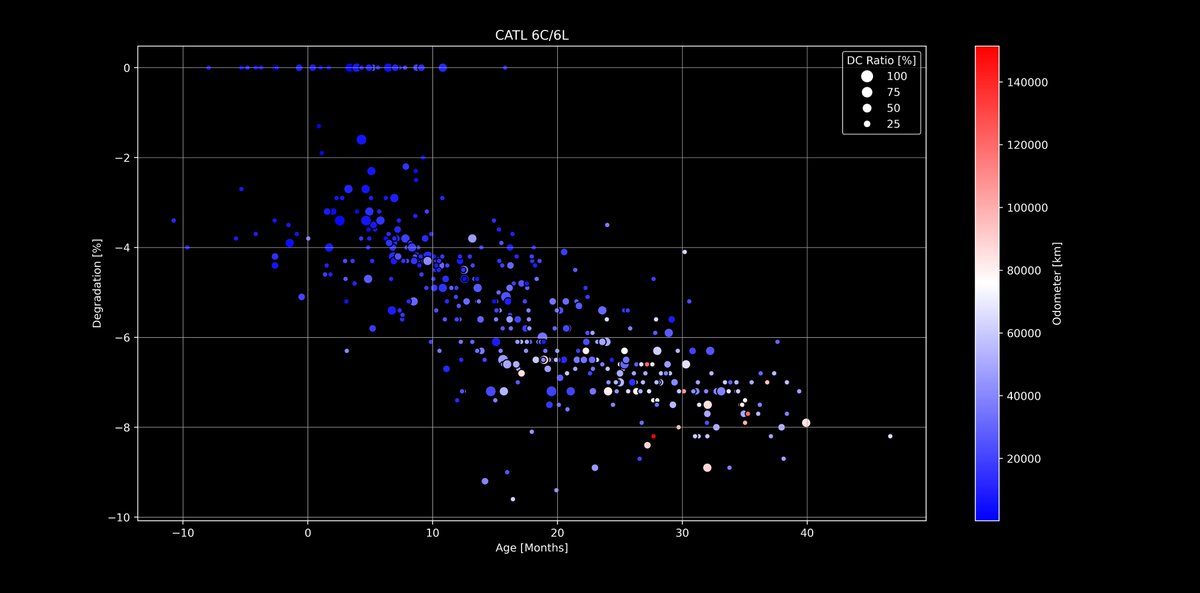
🔋#Tesla Battery Degradation - Next level dive!🪫 Using #Matplotlib I have added two more axis to the evaluations that you already know. I will continue with other packs and values, but LFP was interesting as a start 🙂 Any ideas what to combine next? docs.google.com/spreadsheets/d…

Something went wrong.
Something went wrong.
United States Trends
- 1. #UFC323 128K posts
- 2. Merab 47K posts
- 3. Indiana 107K posts
- 4. Petr Yan 27.9K posts
- 5. Roach 29.7K posts
- 6. Duke 61.7K posts
- 7. Mendoza 42.2K posts
- 8. Ohio State 64.7K posts
- 9. Pantoja 35.8K posts
- 10. Benin 31.3K posts
- 11. #SB19_ACON2025 149K posts
- 12. Walt 8,379 posts
- 13. TOP CALL 9,060 posts
- 14. Joshua Van 11.3K posts
- 15. Curt Cignetti 12K posts
- 16. Heisman 19.5K posts
- 17. Good Sunday 49.4K posts
- 18. Manny Diaz 3,004 posts
- 19. Vtubers 5,661 posts
- 20. Tulane 18.2K posts