#plotlygraphs 検索結果

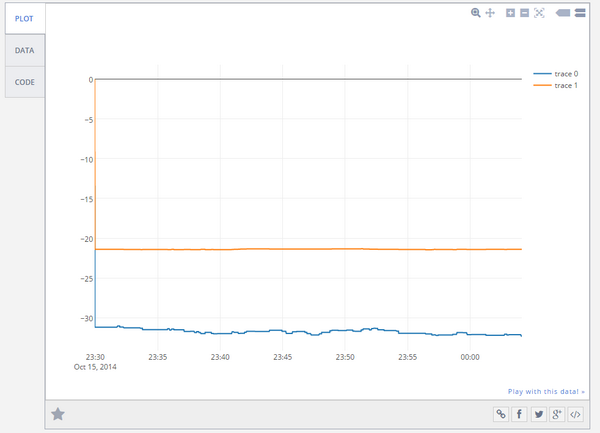
@bradyvolpe , @ZCorum : #Arduino using #Plotlygraphs to visualize Docsis PNM 0=Pre-NMTTER 1=Post-NMTTER

Testing a custom script to read @delsysinc *.hpf files, plot RAW #EMG data and some improved compatibility options coming soon😉! 👨💻#plotlygraphs #Jupyter #Python3

Really impressed with @exploratorydata , their use of @plotly_js , and the #rstats... by #plotlygraphs

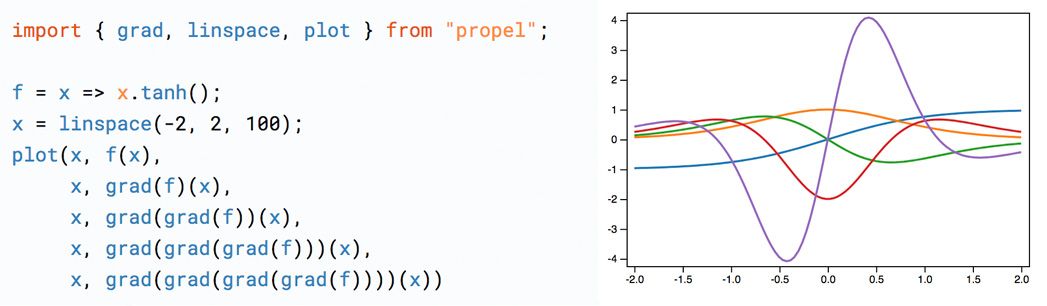
Propel is a NumPy-like framework for scientific computing with JavaScript: propelml.org.convey.pro/l/R4GGEV4 Node and browser (using WebGL). JS only by default, but you can install extra packages to make it GPU-powered via TensorFlow too. by #plotlygraphs via @c0nvey

Dash Mantine Components 0.12.0 is out! Awesome new components with updated docs, check them out here: dash-mantine-components.com. #plotlygraphs #dash
dash-mantine-components.com
Dash Mantine Components | Home
Documentation for Dash Mantine Components, a component library to use with Plotly Dash apps. 100+ customizable components built on the React Mantine library, with consistent styling, theming, full...

The interactive shiny app website accompanying the paper is available at peac.hpc.qmul.ac.uk Look out for the interactive 3D volcano plot #plotlygraphs #rstudio 2/2

Great work & thanks for sharing. On that topic, my website from #datavis course i took this Fall, bit.ly/2ldzxjX and bit.ly/2ldrjZf. All vis. have links to code & data. @hadleywickham @dataandme #rstats #plotlygraphs #leafletR #networkD3 #flexdashboard #shiny

Yves Hilpisch going live! Real-time coding. Real-time streaming data in #plotlygraphs. @dyjh #plotcon

Tried sharing #plotlygraphs project with my students for them to put in data. They can open but not edit. How can I share an editable grid?

Coming from pure MATLAB background, I can't imagine doing an interactive 3D visualization so smoothly from within a browser window i am coding in! Open source community rocks 🙂 #python #projectjupyter #plotlygraphs #Anaconda

🎨 Now your charts will better integrate with the rest of your app's design. Plotly demo app: plotly.streamlit.app #plotly #plotlygraphs @plotlygraphs (3/4)

@fpoodry Nice timing with the video on Vernier Data Share with #plotlygraphs - I will be doing this tomorrow! Great video! Thanks!
Hey #physicsed #modphysics people, having trouble sharing editable #plotlygraphs grid for students to input their own data. Thoughts?


That's a great news for us Plotly.js Open-Source Announcement: plot.ly/javascript/ope… #plotlygraphs
Creating graphs from Dynamic Monitoring Service (DMS) metrics using #plotlygraphs reddipped.com/?p=936 @wlscommunity #WebLogicCommunity

Daily actually. Please advise. Maybe a one on one session? What’s your going rate? #rstats #plotlygraphs #yeeeeee

5 day fast project: made a recommendation engine and visualized 50k recipes with... ln.is/PAAXK by #plotlygraphs via @c0nvey

Senior Software Engineer at Plotly Plotly has been a pioneer and is a leader in providing tools to help data scientists and data analysts maximize their prod... #Python #remotehunt #plotlygraphs zobjobs.com/job/senior-sof…
Senior Software Engineer at Plotly Plotly has been a pioneer and is a leader in providing tools to help data scientists and data analysts maximize their prod... #Python #remotehunt #plotlygraphs zobjobs.com/job/senior-sof…
🎨 Now your charts will better integrate with the rest of your app's design. Plotly demo app: plotly.streamlit.app #plotly #plotlygraphs @plotlygraphs (3/4)
Testing a custom script to read @delsysinc *.hpf files, plot RAW #EMG data and some improved compatibility options coming soon😉! 👨💻#plotlygraphs #Jupyter #Python3
The interactive shiny app website accompanying the paper is available at peac.hpc.qmul.ac.uk Look out for the interactive 3D volcano plot #plotlygraphs #rstudio 2/2


@bradyvolpe , @ZCorum : #Arduino using #Plotlygraphs to visualize Docsis PNM 0=Pre-NMTTER 1=Post-NMTTER
Testing a custom script to read @delsysinc *.hpf files, plot RAW #EMG data and some improved compatibility options coming soon😉! 👨💻#plotlygraphs #Jupyter #Python3
Propel is a NumPy-like framework for scientific computing with JavaScript: propelml.org.convey.pro/l/R4GGEV4 Node and browser (using WebGL). JS only by default, but you can install extra packages to make it GPU-powered via TensorFlow too. by #plotlygraphs via @c0nvey
Something went wrong.
Something went wrong.
United States Trends
- 1. Dodgers 545K posts
- 2. #WorldSeries 278K posts
- 3. Yamamoto 157K posts
- 4. Blue Jays 108K posts
- 5. Will Smith 40.1K posts
- 6. Miguel Rojas 36K posts
- 7. BACK TO BACK 975K posts
- 8. Kershaw 19.3K posts
- 9. Yankees 13.2K posts
- 10. Dave Roberts 10.7K posts
- 11. Baseball 145K posts
- 12. Ohtani 75.8K posts
- 13. Vladdy 19.9K posts
- 14. Kendrick 14.4K posts
- 15. #Worlds2025 26.2K posts
- 16. Jeff Hoffman 3,139 posts
- 17. Auburn 13.7K posts
- 18. Cubs 7,141 posts
- 19. Nike 29.7K posts
- 20. Ernie Clement 12.1K posts