#qqplot نتائج البحث

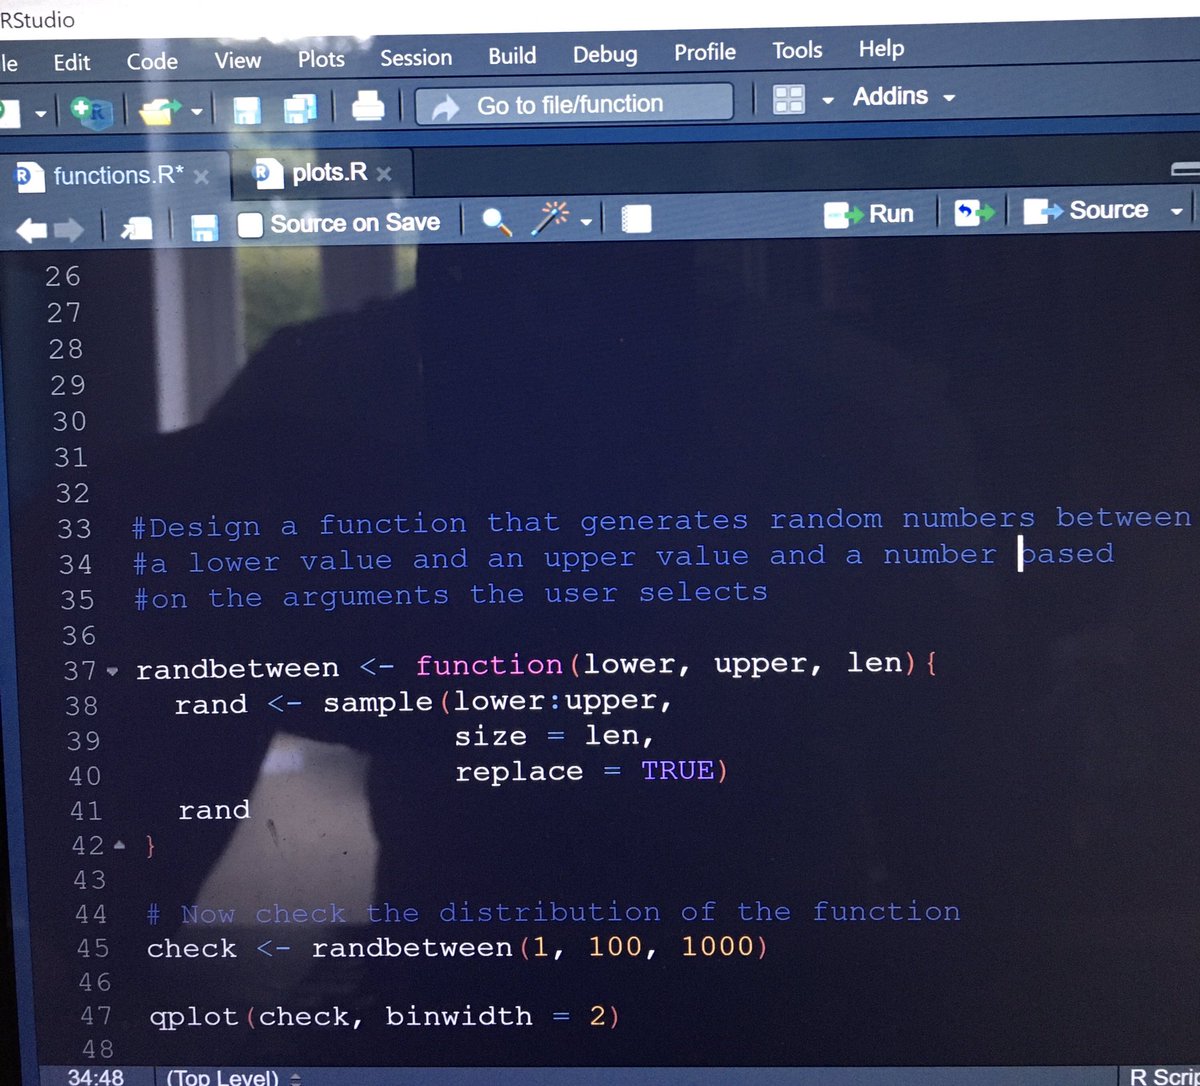
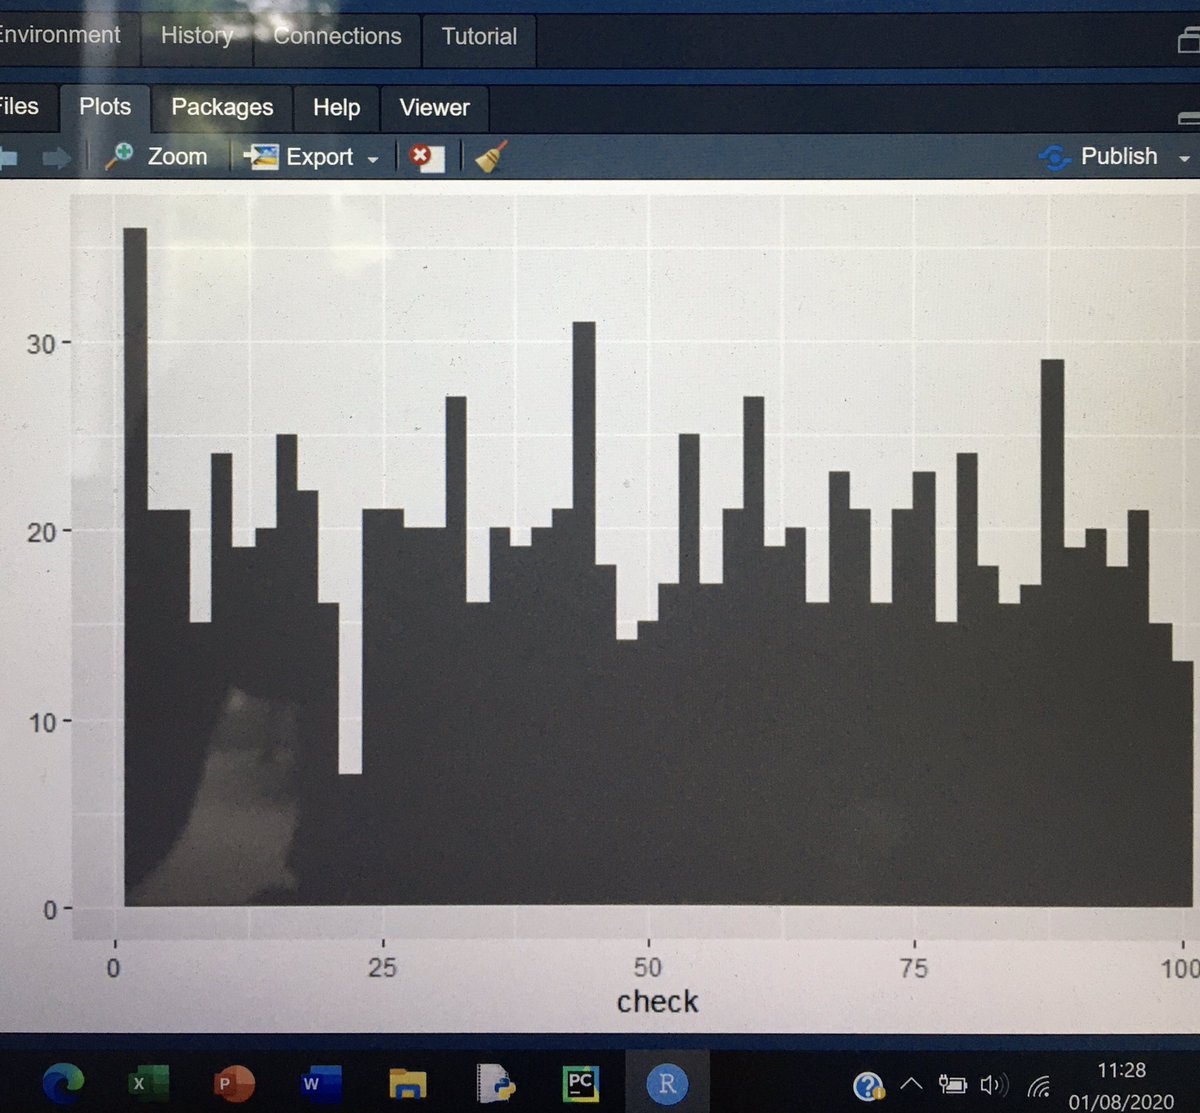
Just created my first function in #R and it’s the #excel RANDBETWEEN function but with with three arguments. Even tested the distribution in #qqplot Feel quite chuffed! 🤓 #beginner

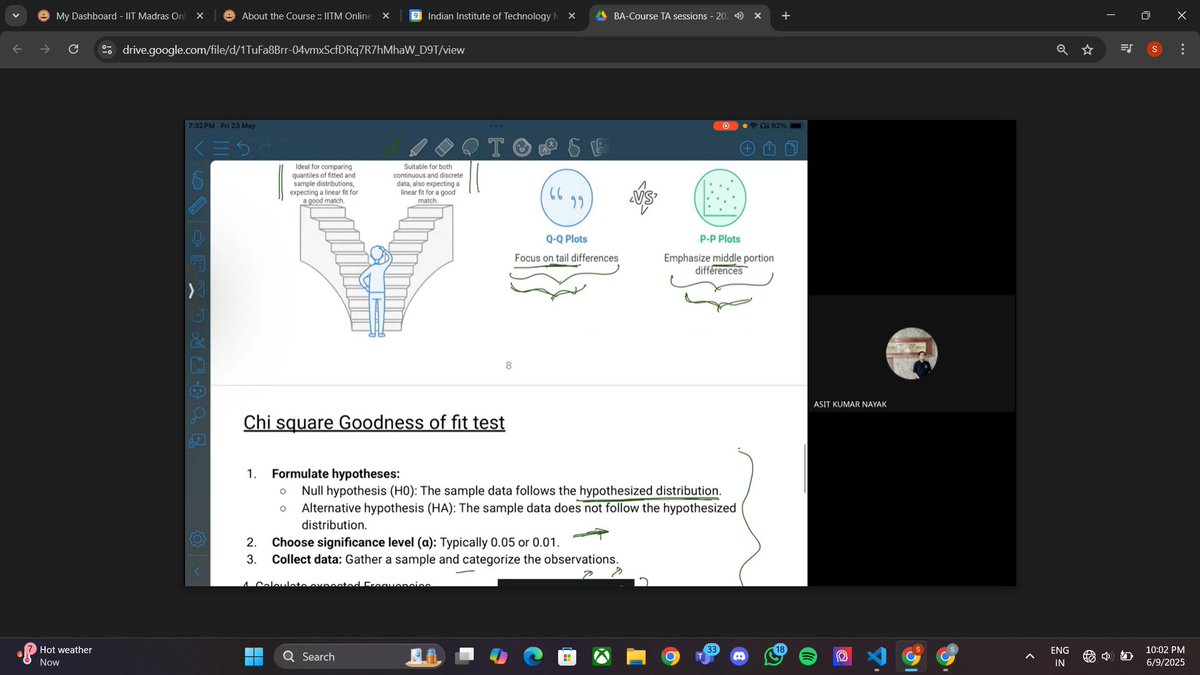
Day 152 of my learning journey Today, I explored QQ Plot and PP Plot — powerful graphical tools to assess whether data follows a particular distribution. Visualization really helps in understanding data behavior! 📈✨ #LearningJourney #DataVisualization #QQPlot #PPPlot

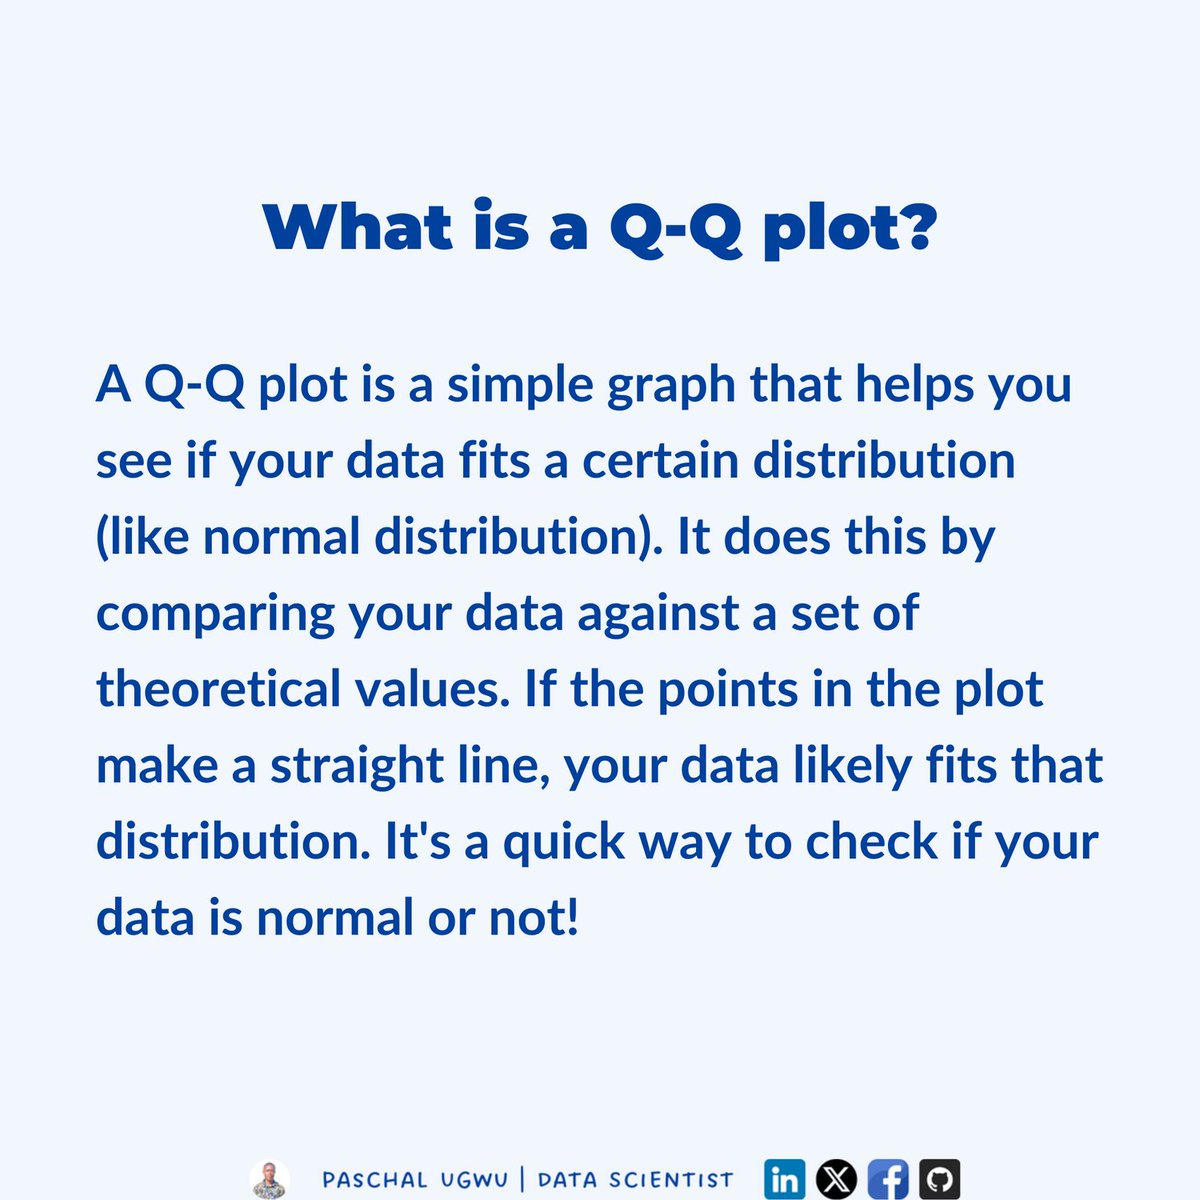
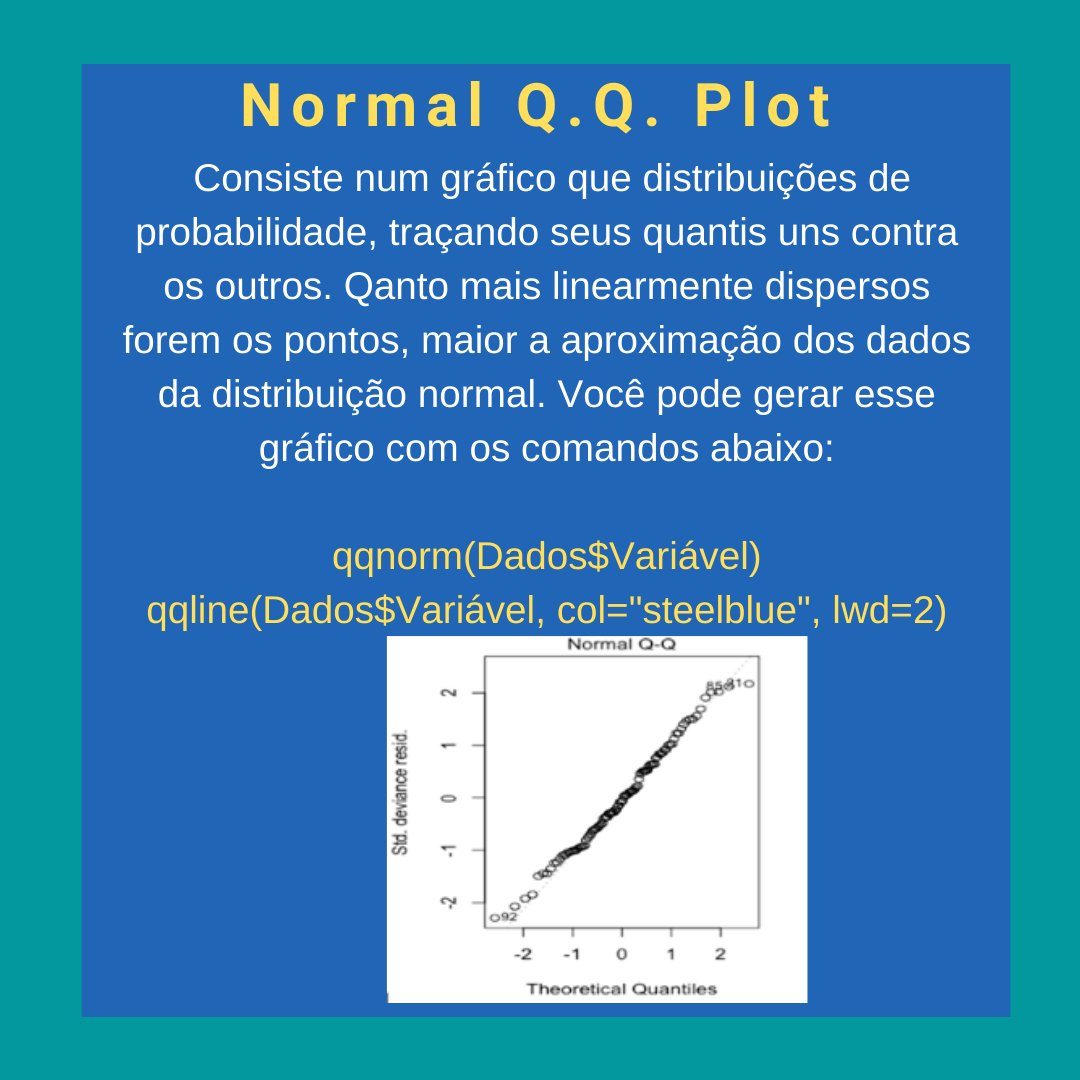
A Q-Q plot visually assesses whether your data conforms to a specific distribution by comparing it against theoretical values, where a straight line indicates conformity. #QQPlot #DataAnalysis #NormalDistribution #StatisticalTools #DataScience #Analytics #GraphicalMethods

RT Methods for Normality Test with Application in Python dlvr.it/RrwpBn #testfornormality #qqplot #shapirowilktest #histogramplot
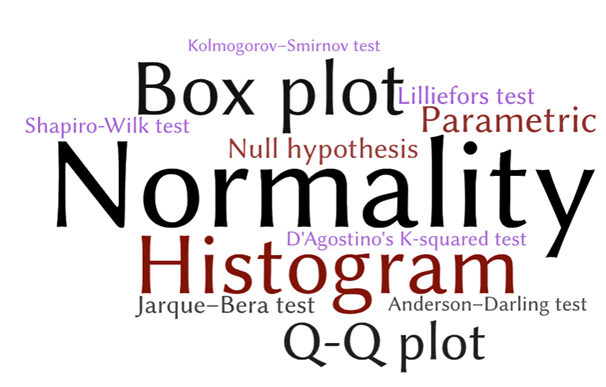

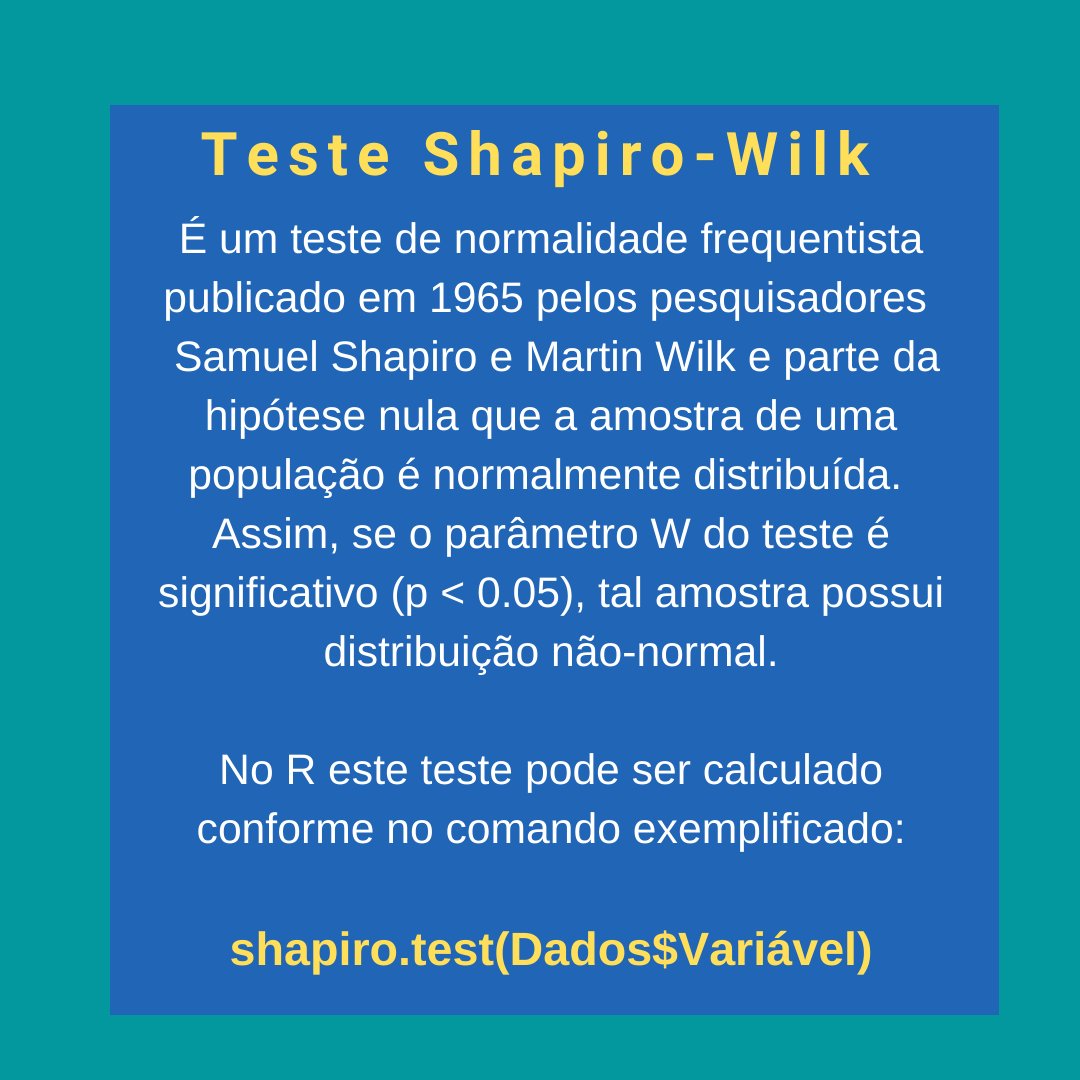
Conhece os pressupostos de distribuição normal e sabe como verificar se seus dados se enquadram nessa distribuição? . . #shapirowilk #qqplot #distribuiçãonormal #gaussiandistribution #distribuciónnormal #rsoftware #rlenguage #testedehipoteses

Normal quantile-quantile plot with Python. #python #statistics #qqplot youtu.be/25C0_tiJg20

How to interpret this qqplot? stats.stackexchange.com/q/566968?atw=1 #qqplot

Linear Regression and its Assumptions - websystemer.no/linear-regress… #heatmap #linearregression #qqplot #regressionassumptions #vif
Can you answer this? interpreting Q-Q plot of a GWAS stats.stackexchange.com/q/288163?atw=1 #qqplot
Is it poissble to quantify the results of a Q-Q plot? (and does it make sense to?) stats.stackexchange.com/q/493330?atw=1 #qqplot
Day 152 of my learning journey Today, I explored QQ Plot and PP Plot — powerful graphical tools to assess whether data follows a particular distribution. Visualization really helps in understanding data behavior! 📈✨ #LearningJourney #DataVisualization #QQPlot #PPPlot
A Q-Q plot visually assesses whether your data conforms to a specific distribution by comparing it against theoretical values, where a straight line indicates conformity. #QQPlot #DataAnalysis #NormalDistribution #StatisticalTools #DataScience #Analytics #GraphicalMethods

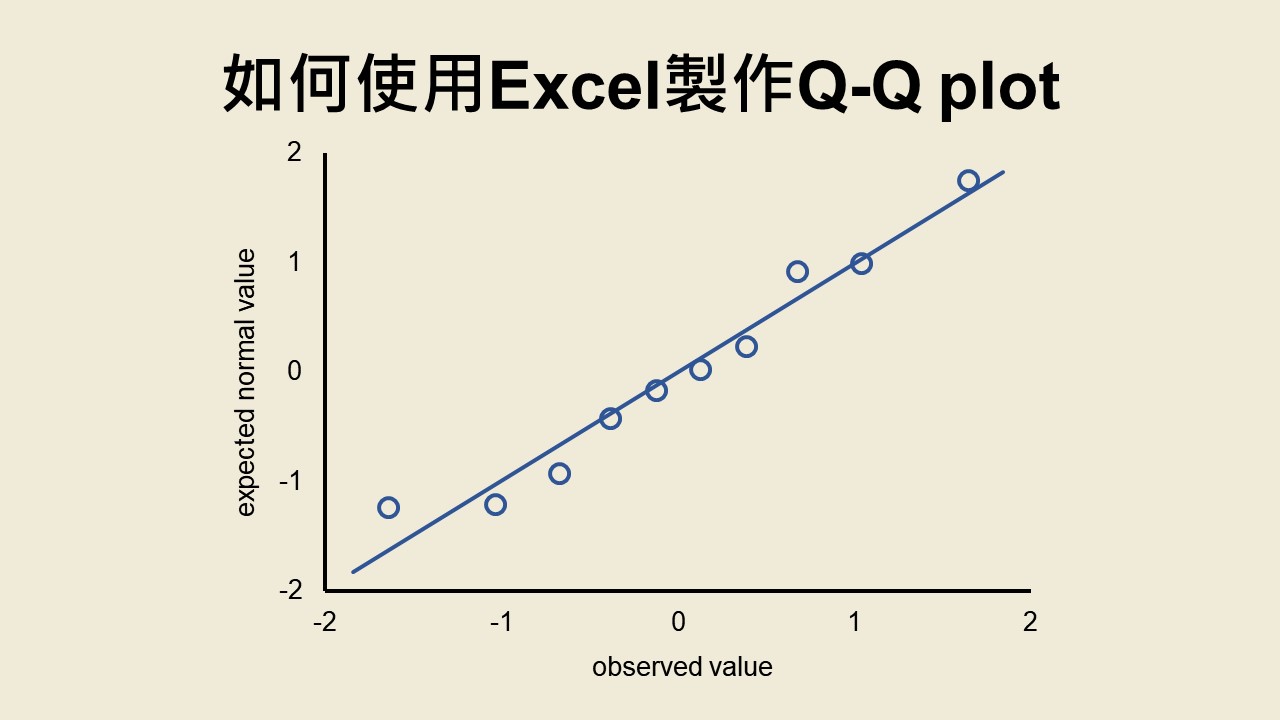
【Excel】#QQplot 是一個很好用的資料檢視圖形工具,可用來觀察一組樣本資料是否為常態分配。若有統計分析軟體,可以簡單地製作出來,但若沒有,也可利用 #Excel 來繪製。雖然製作過程須用到函數,但圖形外觀調整的選項很多,且完成後的圖形也很美觀。 drfishstats.com/graph/q-q-plot…
How to interpret this qqplot? stats.stackexchange.com/q/566968?atw=1 #qqplot
RT Methods for Normality Test with Application in Python dlvr.it/RrwpBn #testfornormality #qqplot #shapirowilktest #histogramplot
Is it poissble to quantify the results of a Q-Q plot? (and does it make sense to?) stats.stackexchange.com/q/493330?atw=1 #qqplot
Just created my first function in #R and it’s the #excel RANDBETWEEN function but with with three arguments. Even tested the distribution in #qqplot Feel quite chuffed! 🤓 #beginner
Can you answer this? interpreting Q-Q plot of a GWAS stats.stackexchange.com/q/288163?atw=1 #qqplot
Linear Regression and its Assumptions - websystemer.no/linear-regress… #heatmap #linearregression #qqplot #regressionassumptions #vif


A Q-Q plot visually assesses whether your data conforms to a specific distribution by comparing it against theoretical values, where a straight line indicates conformity. #QQPlot #DataAnalysis #NormalDistribution #StatisticalTools #DataScience #Analytics #GraphicalMethods
Day 152 of my learning journey Today, I explored QQ Plot and PP Plot — powerful graphical tools to assess whether data follows a particular distribution. Visualization really helps in understanding data behavior! 📈✨ #LearningJourney #DataVisualization #QQPlot #PPPlot
Just created my first function in #R and it’s the #excel RANDBETWEEN function but with with three arguments. Even tested the distribution in #qqplot Feel quite chuffed! 🤓 #beginner
RT Methods for Normality Test with Application in Python dlvr.it/RrwpBn #testfornormality #qqplot #shapirowilktest #histogramplot
Conhece os pressupostos de distribuição normal e sabe como verificar se seus dados se enquadram nessa distribuição? . . #shapirowilk #qqplot #distribuiçãonormal #gaussiandistribution #distribuciónnormal #rsoftware #rlenguage #testedehipoteses
Something went wrong.
Something went wrong.
United States Trends
- 1. #GivingTuesday 25.3K posts
- 2. #twitchrecap 7,001 posts
- 3. Larry 39.2K posts
- 4. Costco 50.6K posts
- 5. #AppleMusicReplay 9,281 posts
- 6. So 79% 1,534 posts
- 7. Cabinet 57.2K posts
- 8. Jared Curtis 2,785 posts
- 9. #DragRace 5,859 posts
- 10. NextNRG Inc. 3,081 posts
- 11. Susan Dell 6,398 posts
- 12. #SleighYourHolidayGiveaway N/A
- 13. Carton 29.3K posts
- 14. Sabrina Carpenter 29.6K posts
- 15. Lucario 28.3K posts
- 16. WFAN N/A
- 17. King Von 1,851 posts
- 18. Punk and AJ 2,847 posts
- 19. Tiki 2,893 posts
- 20. BT and Sal N/A