#technicalanalysis search results
Using of #MovingAverage 5 EMA - Short Term Trend 10 EMA - Strong Momentum 20 EMA - Dynamic Support & Resistance 50 EMA - Long Term Support & Resistance 100 EMA - First Hurdle between 50 & 200 EMA 200 EMA - Last Defence ❤️ & 🔄 to share knowledge #StockMarket #TechnicalAnalysis


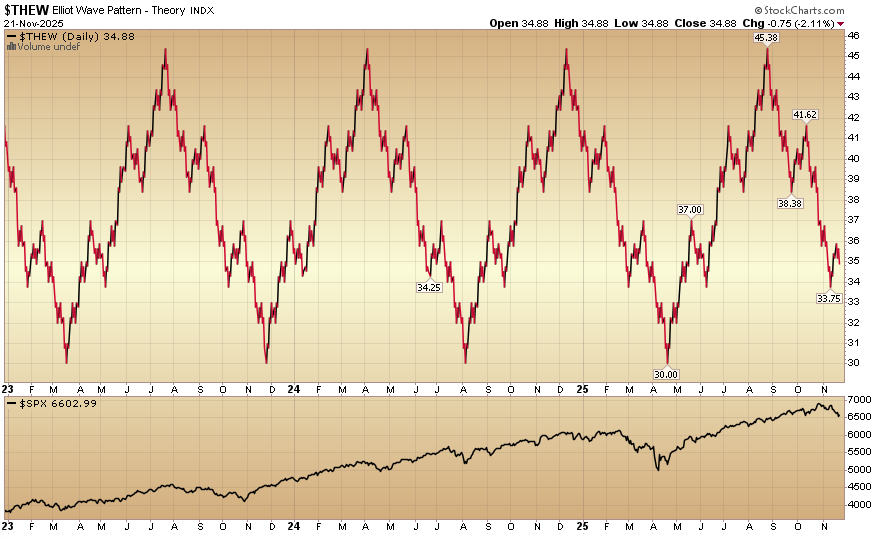
Indicator of the Day (video): Elliot Wave Pattern Theory #MarketIndicator #StockMarket #TechnicalAnalysis #Trading hedgefundtips.com/?p=7058

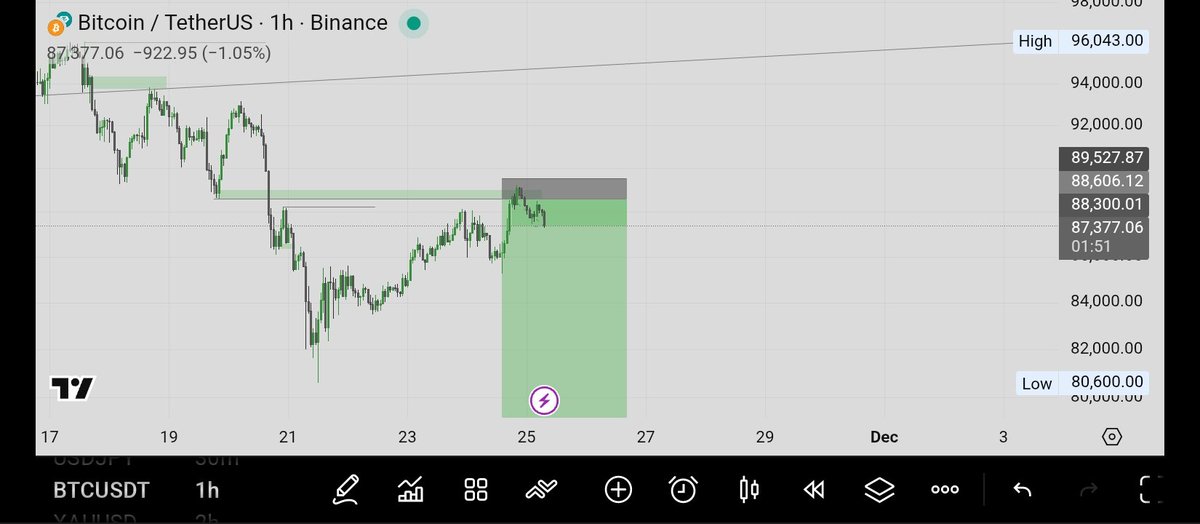
Btc came back😪 . I don already cancel order. Nothing spoil sha. #TradingJourney #BTCUSDT #technicalanalysis


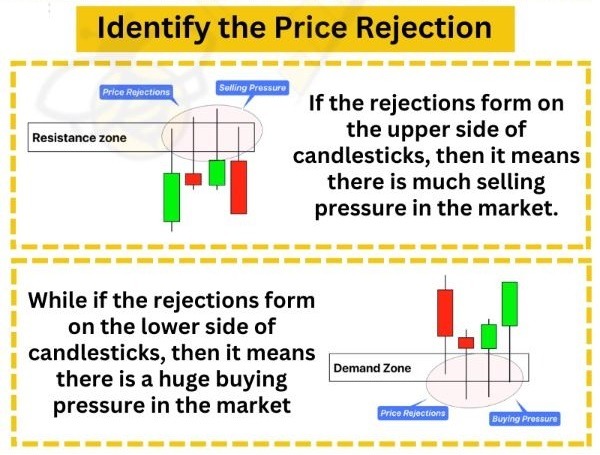
Identify Price Rejection Like a Pro! 🔼 Upper wick = sellers dominating (resistance zone) 🔽 Lower wick = buyers stepping in (demand zone) Wicks reveal hidden pressure—spot them, trade smarter!🎯 🩷 & 🔁 to share knowledge #PriceAction #CandlestickPatterns #TechnicalAnalysis
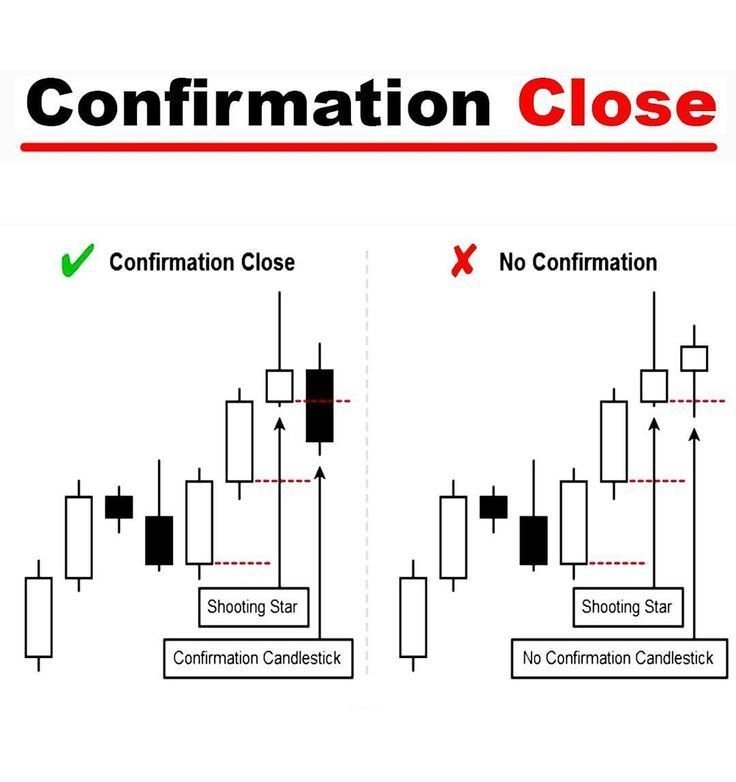
Confirmation matters!✅ Candlestick pattern alone isn’t enough — wait for confirmation close to validate continuation or reversal. Avoid false signals, trade with confidence!🚀📉 🩷 & 🔁 to share knowledge #PriceAction #CandlestickPatterns #TechnicalAnalysis #StockMarket
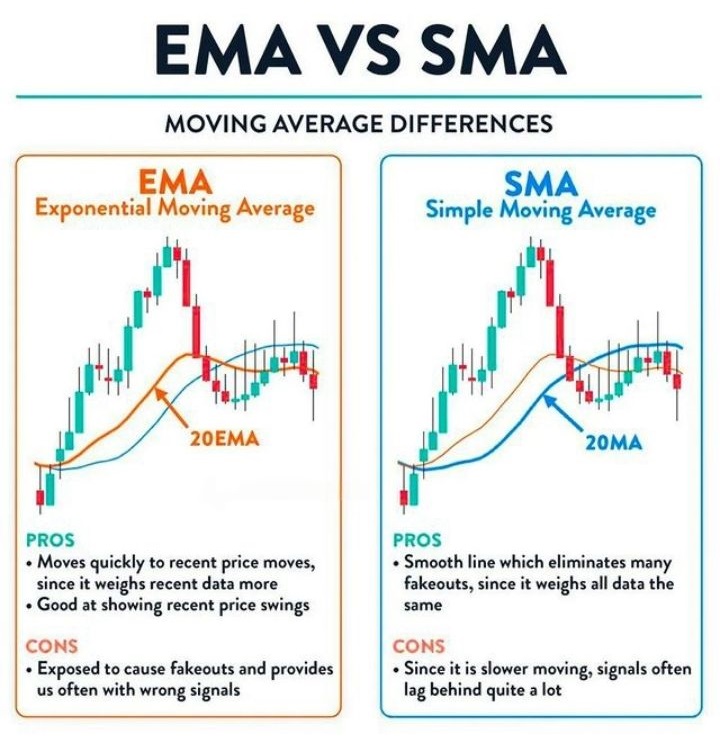
📊 EMA vs. SMA – Which One Do You Use? 🎯 Choose based on your trading style! What's your favourite? ❤️ & 🔄 to share knowledge #Trading #TechnicalAnalysis #StockMarket #EMA #SMA #Investing 🚀📈

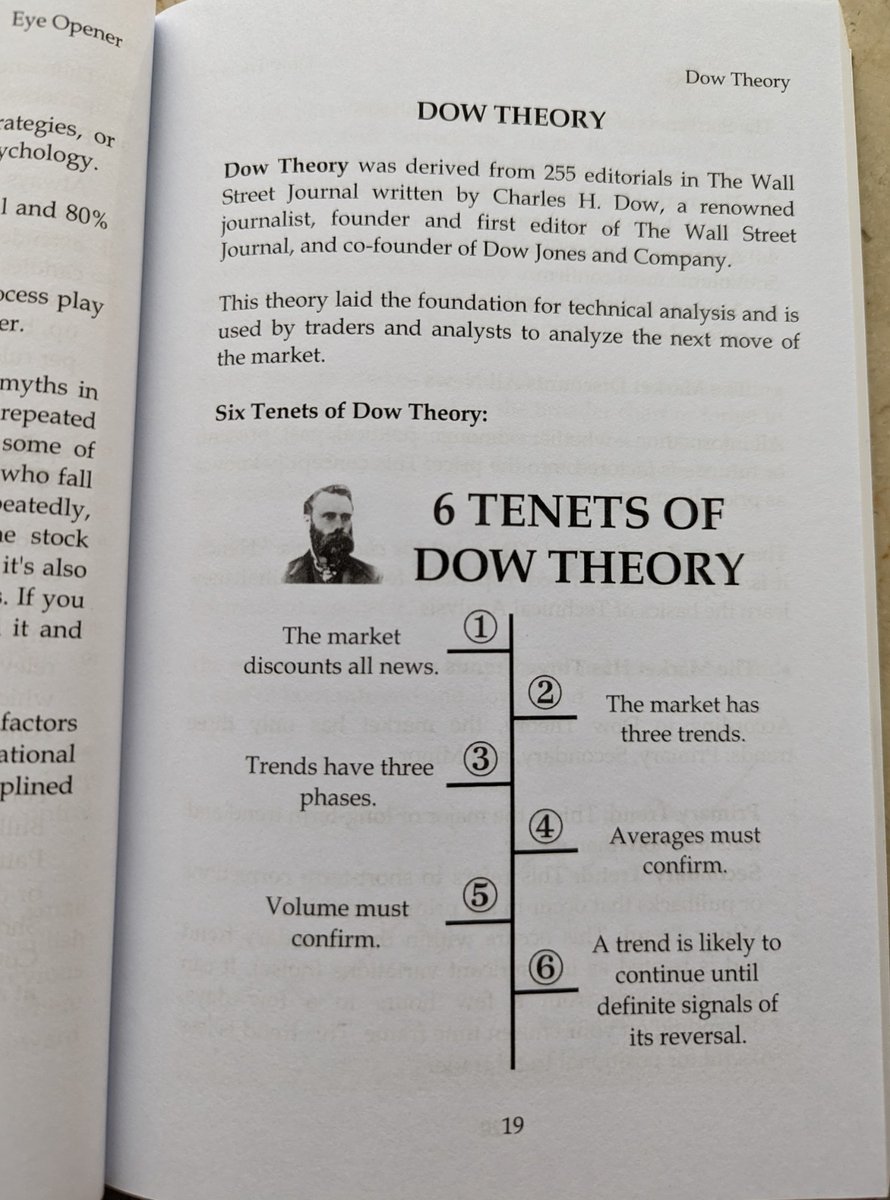
6⃣ Tenets of Dow Theory Nicely Explained. It is foundation of #TechnicalAnalysis! It helps : ✅ Understand market trends ✅ Identify trend phases ✅ Confirm trends with volume & averages ✅ Spot trend reversals early Courtesy : Advanced Technical Analysis Book by Ravi Patel.

Indicator of the Day (video): NYSE 10 Percent Volume Index #MarketIndicator #StockMarket #TechnicalAnalysis #Trading hedgefundtips.com/?p=6389

6⃣ Tenets of Dow Theory Nicely Explained. It is foundation of #TechnicalAnalysis! It helps : ✅ Understand market trends ✅ Identify trend phases ✅ Confirm trends with volume & averages ✅ Spot trend reversals early Courtesy : Advanced Technical Analysis Book by Ravi Patel.
Using of #MovingAverage 5 EMA - Short Term Trend 10 EMA - Strong Momentum 20 EMA - Dynamic Support & Resistance 50 EMA - Long Term Support & Resistance 100 EMA - First Hurdle between 50 & 200 EMA 200 EMA - Last Defence ❤️ & 🔄 to share knowledge #StockMarket #TechnicalAnalysis


Altcoins can drop 20-30% in a day. Trading with >5x leverage? You're getting liquidated. Learn technical analysis—it's key to growing your capital, even while you sleep. #CryptoTrading #TechnicalAnalysis
Confirmation matters!✅ Candlestick pattern alone isn’t enough — wait for confirmation close to validate continuation or reversal. Avoid false signals, trade with confidence!🚀📉 🩷 & 🔁 to share knowledge #PriceAction #CandlestickPatterns #TechnicalAnalysis #StockMarket


$MOG is at the end of its macro Wave 2. Wave 2 is always the deepest and scariest pullback. Pain, boredom, slow bleed, silence, fear, disbelief. Wave 2 is designed to destroy the non-believers. Wave 3 will be the biggest and most violent expansion ever. This is the same spot…

#RSI isn’t just a number—it's a momentum roadmap! RSI < 30 = Oversold📉 RSI > 70 = Overbought📈 RSI > 50 = Bullish | RSI < 50 = Bearish📊 Divergence = Reversal signal📌 Courtesy : Guide to Technical Analysis & Candlesticks Book by Ravi Patel #TechnicalAnalysis #StockMarket


📊 EMA vs. SMA – Which One Do You Use? 🎯 Choose based on your trading style! What's your favourite? ❤️ & 🔄 to share knowledge #Trading #TechnicalAnalysis #StockMarket #EMA #SMA #Investing 🚀📈

#EURJPY continues to face bearish risks despite a brief recovery attempt on Monday. Which levels are in focus now? Check out our technical analysis 👉 spkl.io/6016AebUE #XM #TechnicalAnalysis Your capital is at risk.
🦀 Crab Harmonic Pattern signals powerful reversals! ✔️ Bullish🟢- Look for long opportunities📈 ✔️ Bearish🔴- Prepare for short setups📉 To learn more read 📘Trading Harmonic Patterns with Technical Analysis by @rohanshah619 #StockMarket #TechnicalAnalysis #HarmonicTrading

#EURJPY continues to face bearish risks despite a brief recovery attempt on Monday. Which levels are in focus now? Check out our technical analysis 👉 spkl.io/6016AebUE #XM #TechnicalAnalysis Your capital is at risk.

🔍 US Stock🇺🇸 VCP Pattern Scan | 2025-11-25 ✅ VCP Patterns Detected: 20 stocks ... 📊 Breakout Ready: 8 📉 Volume Dry-up: 0 📈 Tightening: 4 #VCP #USstocks #TechnicalAnalysis alpharvestpro.com/wp-content/upl…
alpharvestpro.com
US Stocks VCP Pattern Analysis | Minervini Footprint
Weekly VCP pattern detection with strict Minervini criteria

goldfxpro.com/gold-price-for… #XAUUSD #GoldMarket #technicalanalysis #priceactiontrading #ForexMarket #MarketOutlook #tradingeducation #FXPrimeAcademy #financialmarkets #MarketStructure #intradayanalysis
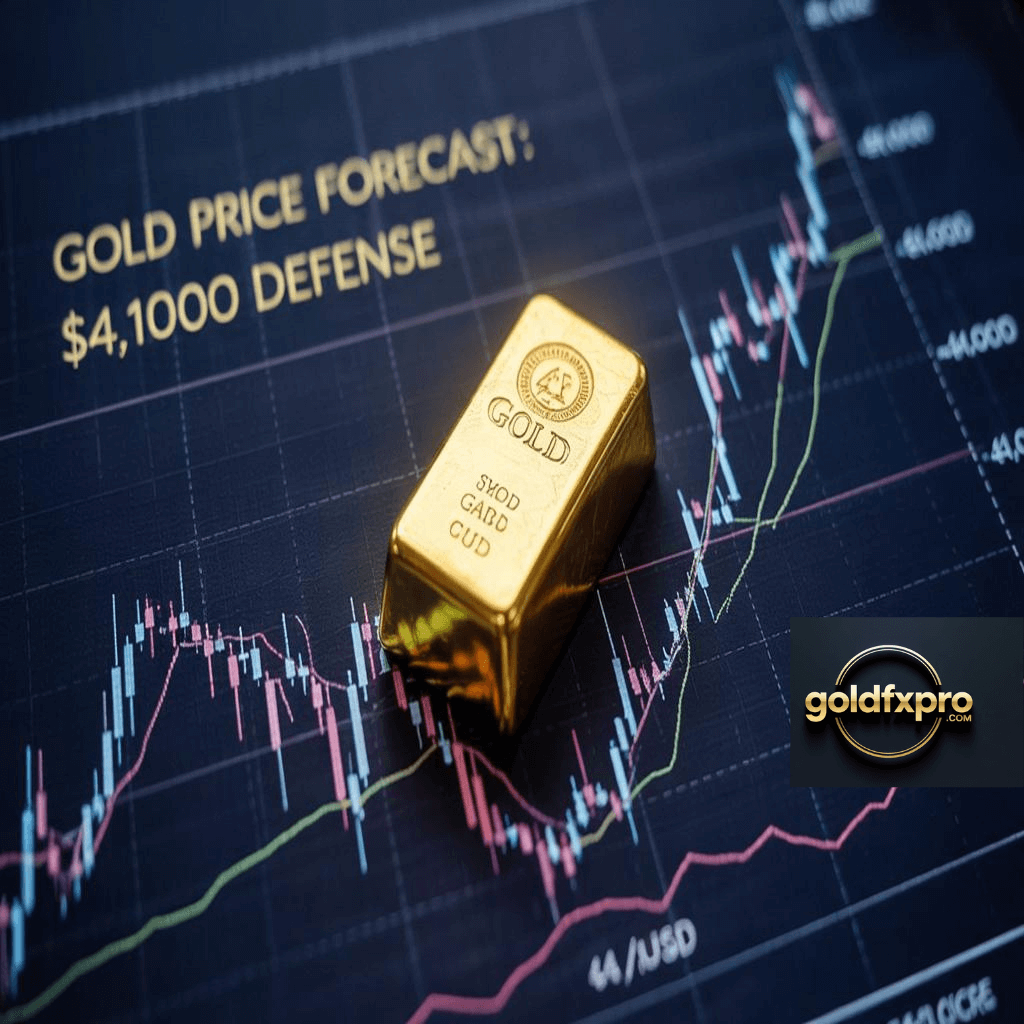

goldfxpro.com/gold-price-for… #XAUUSD #GoldMarket #technicalanalysis #priceactiontrading #ForexMarket #MarketOutlook #tradingeducation #FXPrimeAcademy #financialmarkets #MarketStructure #intradayanalysis


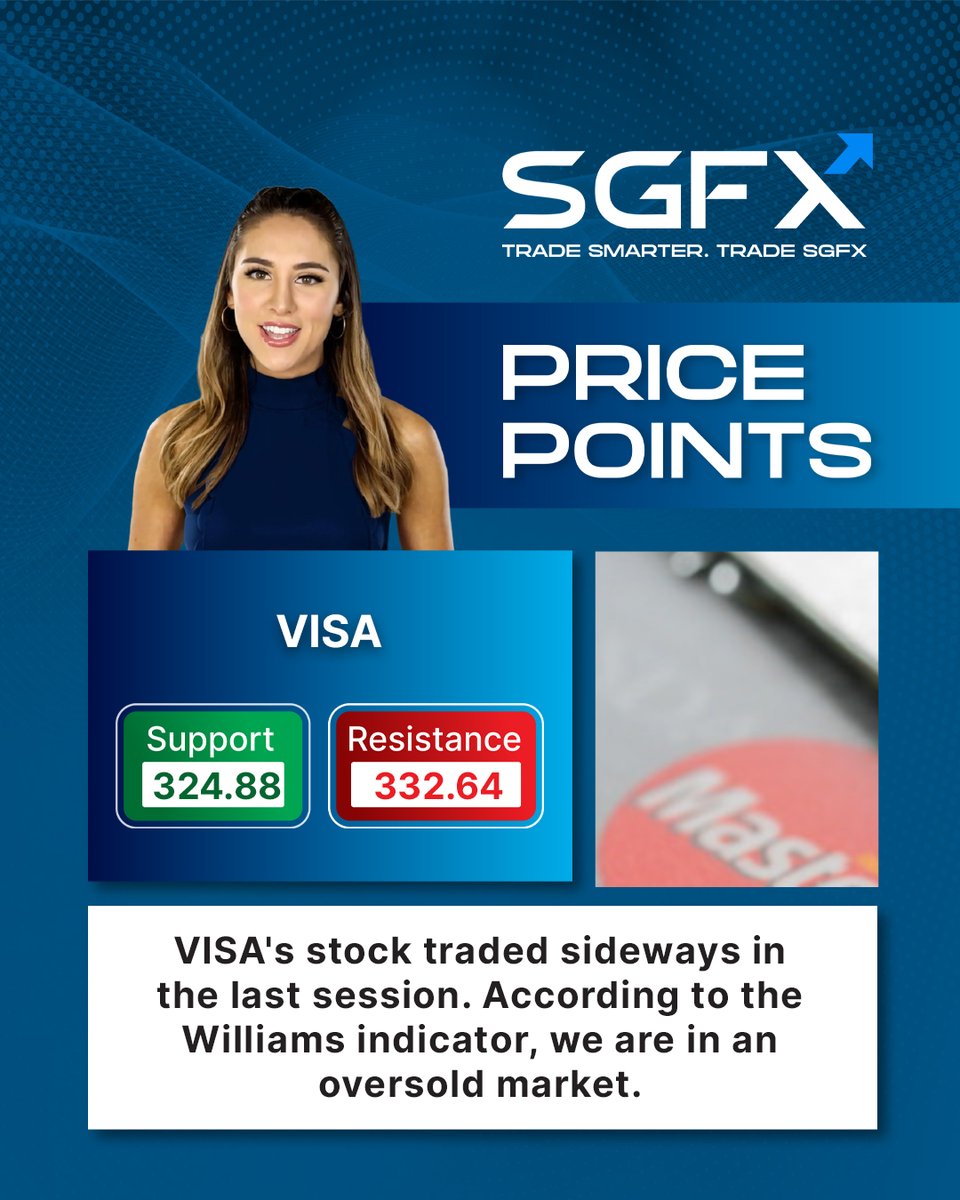
• XAG/USD: Overbought zone after a 1.6% jump • WTI/USD: ROC shows a positive signal • VISA: Williams indicator flags an oversold market . Stay ahead with timely insights. . #TechnicalAnalysis #MarketUpdate #SGFX


Indicator of the Day (video): Elliot Wave Pattern Theory #MarketIndicator #StockMarket #TechnicalAnalysis #Trading hedgefundtips.com/?p=7058
Btc came back😪 . I don already cancel order. Nothing spoil sha. #TradingJourney #BTCUSDT #technicalanalysis
Using of #MovingAverage 5 EMA - Short Term Trend 10 EMA - Strong Momentum 20 EMA - Dynamic Support & Resistance 50 EMA - Long Term Support & Resistance 100 EMA - First Hurdle between 50 & 200 EMA 200 EMA - Last Defence ❤️ & 🔄 to share knowledge #StockMarket #TechnicalAnalysis

Güçlü bir trading zihniyeti ve psikolojisi nasıl sürdürülebilir? Duyguları tutarlı bir şekilde yaşayabilmek için, sağlam bir trading (alım-satım) zihniyeti oluşturmalısın. Bizi takipte kalın… 😎 #Forex #Trader #TechnicalAnalysis #USD #EURUSD #GBPUSD #Gold #XAUUSD

Identify Price Rejection Like a Pro! 🔼 Upper wick = sellers dominating (resistance zone) 🔽 Lower wick = buyers stepping in (demand zone) Wicks reveal hidden pressure—spot them, trade smarter!🎯 🩷 & 🔁 to share knowledge #PriceAction #CandlestickPatterns #TechnicalAnalysis
Confirmation matters!✅ Candlestick pattern alone isn’t enough — wait for confirmation close to validate continuation or reversal. Avoid false signals, trade with confidence!🚀📉 🩷 & 🔁 to share knowledge #PriceAction #CandlestickPatterns #TechnicalAnalysis #StockMarket

Master the art of reading the markets 📊 Understanding these 4 essential candlestick patterns Pin Bar, Engulfing, Black Crows, and Inside Up —can unlock powerful reversal signals. #TechnicalAnalysis #CandlestickPatterns #TradingSignals


#Forex #CHFJPY #TechnicalAnalysis #TradingEducation #PriceAction #TraderMindset #Markets We do not want to trade the Financial markets like this it hurts your brain too much


🧈🤏😼🌔 You can follow @ramacaf457k77! I took his advice and entered the market at the right time, making $28,000 last week. Thanks to him! SP500 MNDR #BullMarket 💱 $INTC #TechnicalAnalysis ⭕ $NFLX #FinancialAdvisor 🚦 $NBIS #Crypto 🩱 $IREN
🧼🧇💏🆘 Thanks to @hanya_1991! I followed his advice and entered the market at the right time, which allowed me to earn $30,000 in two days. stock IPO #stock 🏂 $AMD #TechnicalAnalysis 📟 $BYND #Earnings 🕓 $GRAB #Crypto ➰ $KO

⬜🍶🩹 Thanks to @hanya_1991! I followed his advice and entered the market at the right time, which allowed me to earn $30,000 in two days. stock IPO #stock 🔡 $GOOGL #TechnicalAnalysis 🚰 $UNH #Gold 🎑 $NFLX $MNDR 🍔 $COIN
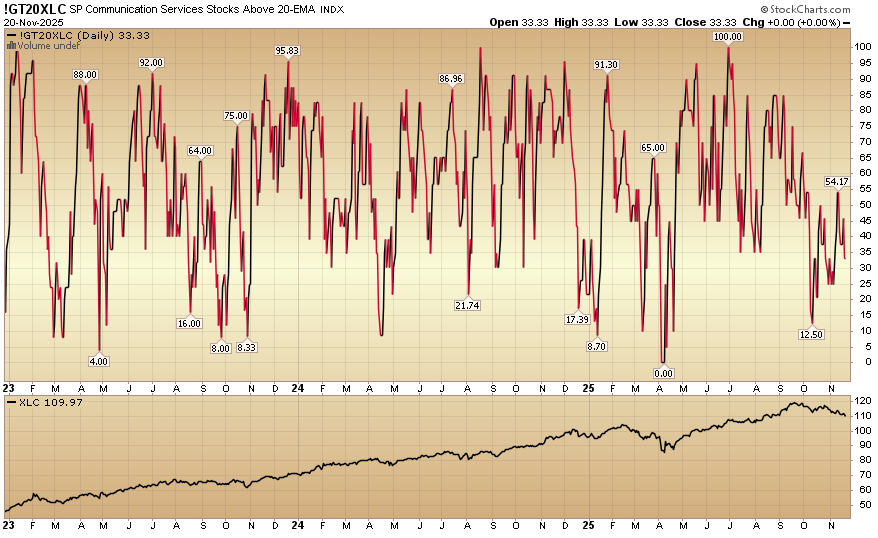
Indicator of the Day (video): S&P Communication Services Stocks Above 20 EMA #CommunicationServices #MarketIndicator #TechnicalAnalysis #Trading hedgefundtips.com/?p=6930

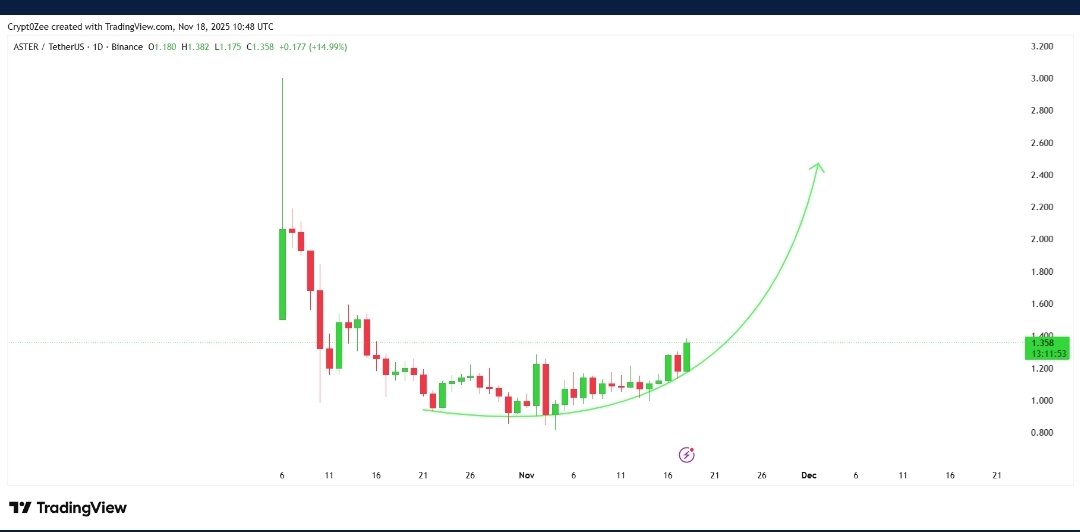
Daily $ASTER: Breakout push underway. Target remains $2.40 - $2.60. $ASTER is strong. 🎯 #ASTER #TechnicalAnalysis
Something went wrong.
Something went wrong.
United States Trends
- 1. #GMMTV2026 588K posts
- 2. MILKLOVE BORN TO SHINE 92K posts
- 3. #WWERaw 77.1K posts
- 4. Finch 14.7K posts
- 5. Brock Purdy 14.3K posts
- 6. AI Alert 8,064 posts
- 7. TOP CALL 9,306 posts
- 8. Bryce 21.3K posts
- 9. Keegan Murray 1,541 posts
- 10. Alan Dershowitz 2,744 posts
- 11. Barcelona 137K posts
- 12. Timberwolves 3,905 posts
- 13. Check Analyze 2,418 posts
- 14. Token Signal 8,594 posts
- 15. Gonzaga 4,124 posts
- 16. Panthers 37.8K posts
- 17. Dialyn 7,767 posts
- 18. Enemy of the State 2,595 posts
- 19. Market Focus 4,715 posts
- 20. Niners 5,931 posts