#dataart search results

Good afternoon my dear friends 💙 @GlintAnalytics Glint’s new color tool is the palette your data deserves. It’s like turning a spreadsheet into a masterpiece. Show us your first vibrant dashboard and join the art movement! #DataArt ❤️🔥 @cookiedotfun


We’ve just released a product update for data visualization! Glint's new color picker lets analysts create stunning, crystal-clear dashboards that tell compelling stories. Beautiful data = better insights = smarter decisions ✨

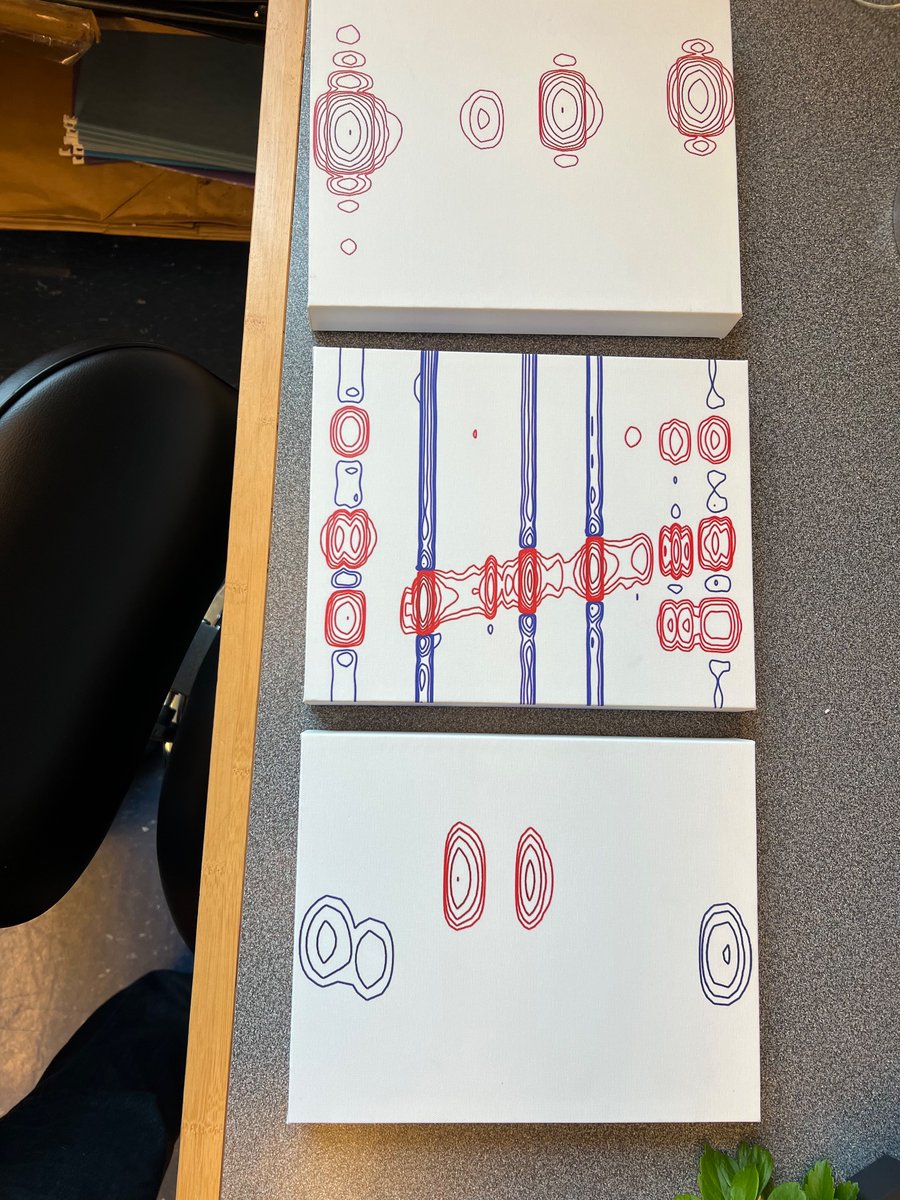
I always thought 2D nmr spectra looked cool, so I printed the first ones ever collected in our lab on canvas and hung them above the chemistry hoods. #dataart


Женщины в #Кыргызстан выполняют в 5 раз больше неоплачиваемой работы по уходу, зарабатывают на 20% меньше и выходят на пенсию с меньшими доходами. 🎨 Kattama от @LexTitova — впечатляющая арт-работа #DataArt, наглядно показывающая неравенство. 🔗 unwo.men/EJPb50XkYI1


Women in #Kyrgyzstan do 5x more unpaid care work, earn 20% less, & retire with less. 🎨 Kattama by @LexTitova is a powerful #DataArt piece that makes this inequality visible. 🔗 Explore the artwork to learn more: unwo.men/B9nO50Xg5jb #DayOfCare | #WomenCount


📢 UPDATED MAP🗺! Some of my compatriots complained that I didn't include the Esequibo on this map. Unfortunately, most of the R packages do not recognize those borders. I added one provided by Orogenesis. Here is an updated version! #DataArt🎨📊

📢 New Map Alert! Just finished this detailed 3D hydrologic map of Venezuela🇻🇪. See the country's rivers like never before! It's time for another #1Week1Project📅💻, find out how you can make your own gorgeous map too! Let's open a 🧵👇🏽 #HydrologicMap💧🗺 #DataArt🎨📊

What does Colombia’s economy look like from space? 🛰 It's now time to start traveling across Latin America, and this is my first map of Colombia🇨🇴 with data from the Local GDP Estimates around the World by Rossi-Hansberg, and Jialing Zhang (2025). #DataArt🎨 #EconomicMaps🗺

🎗️ Convexity is a powerful #DataArt piece honoring the courage of women in Kazakhstan facing breast cancer. This #BreastCancerAwarenessMonth, let’s honor their stories & push for early detection and better care that reaches every woman. 🔗 unwo.men/zkjK50XcSWm #WomenCount


"Mind-blowing market analysis! 📈💀 Green and red candlestick charts pulse within a translucent skull, set against a stark black backdrop. #MarketMind #DataArt #TechVision"


📢 New Map Alert! Just finished this detailed 3D hydrologic map of Venezuela🇻🇪. See the country's rivers like never before! It's time for another #1Week1Project📅💻, find out how you can make your own gorgeous map too! Let's open a 🧵👇🏽 #HydrologicMap💧🗺 #DataArt🎨📊

🌌✨ Diving into the new Kaspa NG, New Generation Block DAG Visualizer – it's mesmerizing! The smooth flow and intricate patterns offer a captivating way to see the Kaspa network in action. Truly a work of digital art! And that's how TN11 10BPS looks now. #KaspaKNG #DataArt…

When you accidentally run a logistic regression without changing the variable type and make accidental aRt instead. I call this one "Logistic Waves" #dataArt


✨ Illusion of Balance suspends gender stereotypes in midair. Through Kazakh proverbs, this felt-star mobile reveals how literature casts men as heroes, women as caretakers. What if we rewrote the script? 🔗 Discover more #DataArt: eca.unwomen.org/en/digital-lib… #WomenCount | #Tirek


🌌 “Our Energy Nexus” is featured in #InfoPlus2025! This interactive installation by Chloe Prock & friends reimagines energy as a collective force, turning pollution data into shared hope + action. informationplusconference.com/2025/exhibitio… #datavis #dataart


Why it pops? Gen art boosts engagement 60%—Taylor’s AI visuals trend #1. Keep human soul in the loop. Export GIFs for Reels! #VisualDesign #FutureOfArt #DataArt #Chiefs #TaylorSwift #NFL

Des montagnes de données 🌄 Ces cartes 3D transforment la densité de population en un paysage fascinant grâce à l’outil open source Rayshader. #DataArt #Cartographie #TechCréative

Good afternoon my dear friends 💙 @GlintAnalytics Glint’s new color tool is the palette your data deserves. It’s like turning a spreadsheet into a masterpiece. Show us your first vibrant dashboard and join the art movement! #DataArt ❤️🔥 @cookiedotfun
We’ve just released a product update for data visualization! Glint's new color picker lets analysts create stunning, crystal-clear dashboards that tell compelling stories. Beautiful data = better insights = smarter decisions ✨

"Where art meets intelligence — the moose stands as a symbol of quiet strength and data wisdom. 🦌✨" #DataArt #CreativeAI #DigitalWisdom #TechAesthetics @DataHaven_xyz

Женщины в #Кыргызстан выполняют в 5 раз больше неоплачиваемой работы по уходу, зарабатывают на 20% меньше и выходят на пенсию с меньшими доходами. 🎨 Kattama от @LexTitova — впечатляющая арт-работа #DataArt, наглядно показывающая неравенство. 🔗 unwo.men/EJPb50XkYI1
Women in #Kyrgyzstan do 5x more unpaid care work, earn 20% less, & retire with less. 🎨 Kattama by @LexTitova is a powerful #DataArt piece that makes this inequality visible. 🔗 Explore the artwork to learn more: unwo.men/B9nO50Xg5jb #DayOfCare | #WomenCount

Chikyuchi is a virtual pet inspired by Tamagotchi that connects emotion with environmental data. Its health mirrors the state of the Amazon rainforest, reminding us that both the Chikyuchis and our planet can only heal when we truly care. Project: vincentruijters.com/Chikyuchi #DataArt


repost @_re_pete on IG Part 1 of 29: Art that reacts to my phone flashlight 🤳🏽 #creativetechnology #techart #dataart
What does Colombia’s economy look like from space? 🛰 It's now time to start traveling across Latin America, and this is my first map of Colombia🇨🇴 with data from the Local GDP Estimates around the World by Rossi-Hansberg, and Jialing Zhang (2025). #DataArt🎨 #EconomicMaps🗺

🚀 Professional / Tech Enthusiast tone: Excited to see how @nitrograph is pushing the boundaries of generative design and data visualization. Blending creativity with computation like never before. ⚡️ #DataArt #GenerativeDesign #AI

Time truly leaves its mark, especially when every 'block' is a heartbeat of the future. The combination of @OneAnalog, @wallchain_xyz, and @Cookie3AI turning data into art and stories is seriously exciting. Looking forward to watching this story unfold. #Web3 #DataArt
✨ SITORAXO — это потрясающий #DataArt -трибьют женщинам #Узбекистана, преодолевшим барьеры в политике, бизнесе, науке. Но женщины по-прежнему недопредставлены на руководящих должностях, занимая всего 35% мест в парламенте. 🔗 unwo.men/hukb50XgZt4 #WomenCount | #ArtKazan


When I plotted this map, the first thought that came to mind is that it looked like the "Jardín Lumínico" in Caracas, a work of art made with ceramics by Patricia Van Dalen (@pvandalen). I guess in this case, science imitates art. #DataArt🎨📊


✨ SITORAXO is a stunning #DataArt tribute to women in #Uzbekistan who broke barriers in politics, business, science & more. Yet women remain underrepresented in leadership — holding just 35% of seats in parliament. 🔗Learn more: unwo.men/B9nO50Xg5jb #WomenCount


🎗️ Convexity is a powerful #DataArt piece honoring the courage of women in Kazakhstan facing breast cancer. This #BreastCancerAwarenessMonth, let’s honor their stories & push for early detection and better care that reaches every woman. 🔗 unwo.men/zkjK50XcSWm #WomenCount
I always thought 2D nmr spectra looked cool, so I printed the first ones ever collected in our lab on canvas and hung them above the chemistry hoods. #dataart
Женщины в #Кыргызстан выполняют в 5 раз больше неоплачиваемой работы по уходу, зарабатывают на 20% меньше и выходят на пенсию с меньшими доходами. 🎨 Kattama от @LexTitova — впечатляющая арт-работа #DataArt, наглядно показывающая неравенство. 🔗 unwo.men/EJPb50XkYI1
Women in #Kyrgyzstan do 5x more unpaid care work, earn 20% less, & retire with less. 🎨 Kattama by @LexTitova is a powerful #DataArt piece that makes this inequality visible. 🔗 Explore the artwork to learn more: unwo.men/B9nO50Xg5jb #DayOfCare | #WomenCount

A unique framed & signed Patchwork Kingdom is now available in my store! ✨ There are 4 different ones. I'll only ever print & sign these 4 PKs, hopefully something special for fans of the collection ^_^ See more from "The kingdom of Tunyoro": shop.visualcinnamon.com/collections/fr… #dataart


📢 New Map Alert! Just finished this detailed 3D hydrologic map of Venezuela🇻🇪. See the country's rivers like never before! It's time for another #1Week1Project📅💻, find out how you can make your own gorgeous map too! Let's open a 🧵👇🏽 #HydrologicMap💧🗺 #DataArt🎨📊
✨ Illusion of Balance suspends gender stereotypes in midair. Through Kazakh proverbs, this felt-star mobile reveals how literature casts men as heroes, women as caretakers. What if we rewrote the script? 🔗 Discover more #DataArt: eca.unwomen.org/en/digital-lib… #WomenCount | #Tirek
"Mind-blowing market analysis! 📈💀 Green and red candlestick charts pulse within a translucent skull, set against a stark black backdrop. #MarketMind #DataArt #TechVision"


In 🇰🇿, over 82,000 women & girls bear names reflecting a wish for sons. @unwomenkaz This data-artwork challenges son preference: zippers bloom into blue flowers on a newborn’s shirt—resilient, beautiful, unyielding. 👉 eca.unwomen.org/en/digital-lib… #WomenCount #Tirek #DataArt


tokyo-sequence series experiments 2 tokyo metropolitan museum 2023 #art #data #dataart #tokyo #generativeart #mixedmedia

Something went wrong.
Something went wrong.
United States Trends
- 1. #FinallyOverIt 5,082 posts
- 2. #TalusLabs N/A
- 3. Summer Walker 16.2K posts
- 4. Justin Fields 9,930 posts
- 5. 5sos 21.2K posts
- 6. #criticalrolespoilers 3,997 posts
- 7. Jets 68.4K posts
- 8. Jalen Johnson 8,467 posts
- 9. Patriots 150K posts
- 10. Drake Maye 21K posts
- 11. Go Girl 25.3K posts
- 12. 1-800 Heartbreak 1,290 posts
- 13. Judge 202K posts
- 14. Wale 32.4K posts
- 15. #BlackOps7 15.7K posts
- 16. Robbed You 3,913 posts
- 17. #zzzSpecialProgram 2,506 posts
- 18. TreVeyon Henderson 12.8K posts
- 19. AD Mitchell 2,427 posts
- 20. Disc 2 N/A