#datastorytelling نتائج البحث

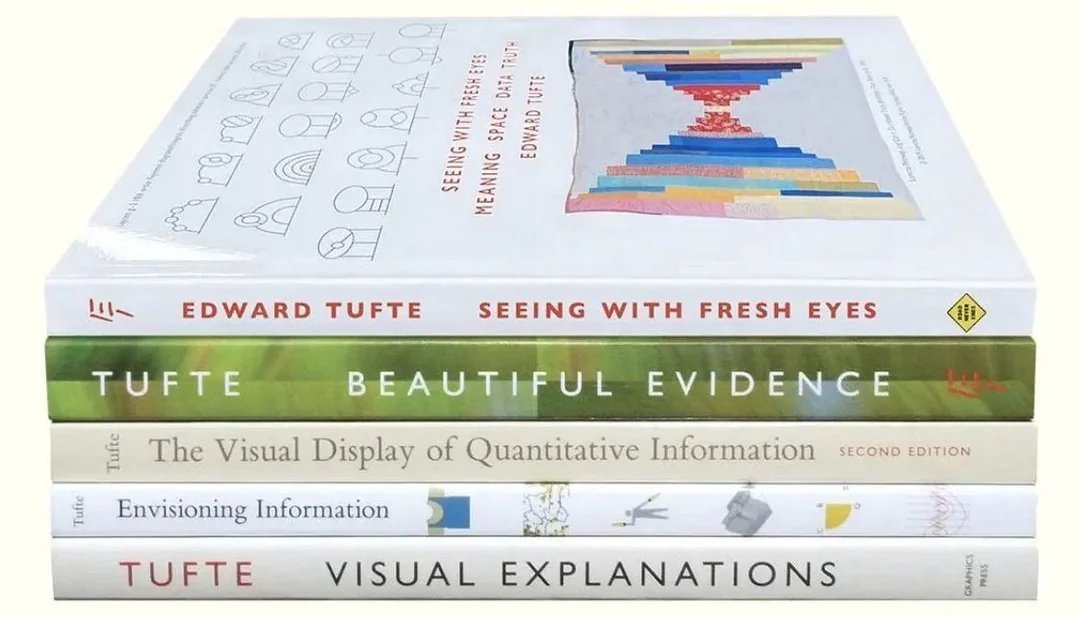
Beautiful #DataViz and #InfoVis books, great for #DataStorytelling and #VisualAnalytics, by @EdwardTufte => see them all at amzn.to/48jd78K + See his online course: edwardtufte.com/tufte/courses

The 2 C’s every data professional should swear by — Context and Caveat. They’re the difference between data and insight. Don’t just analyze numbers, explain the story behind them. 📊💡 #DataAnalytics #DataScience #DataStorytelling #BusinessIntelligence #AnalyticsTips

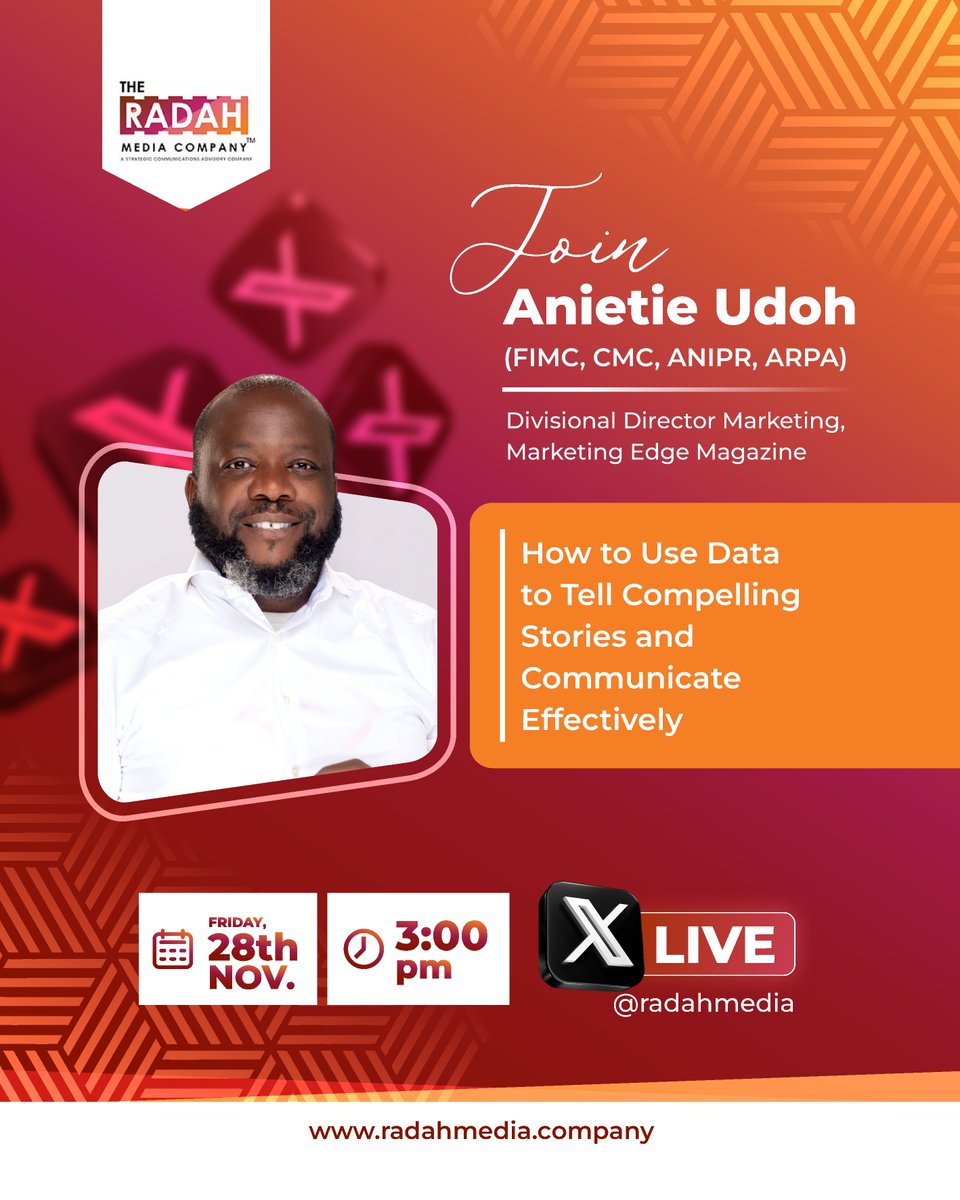
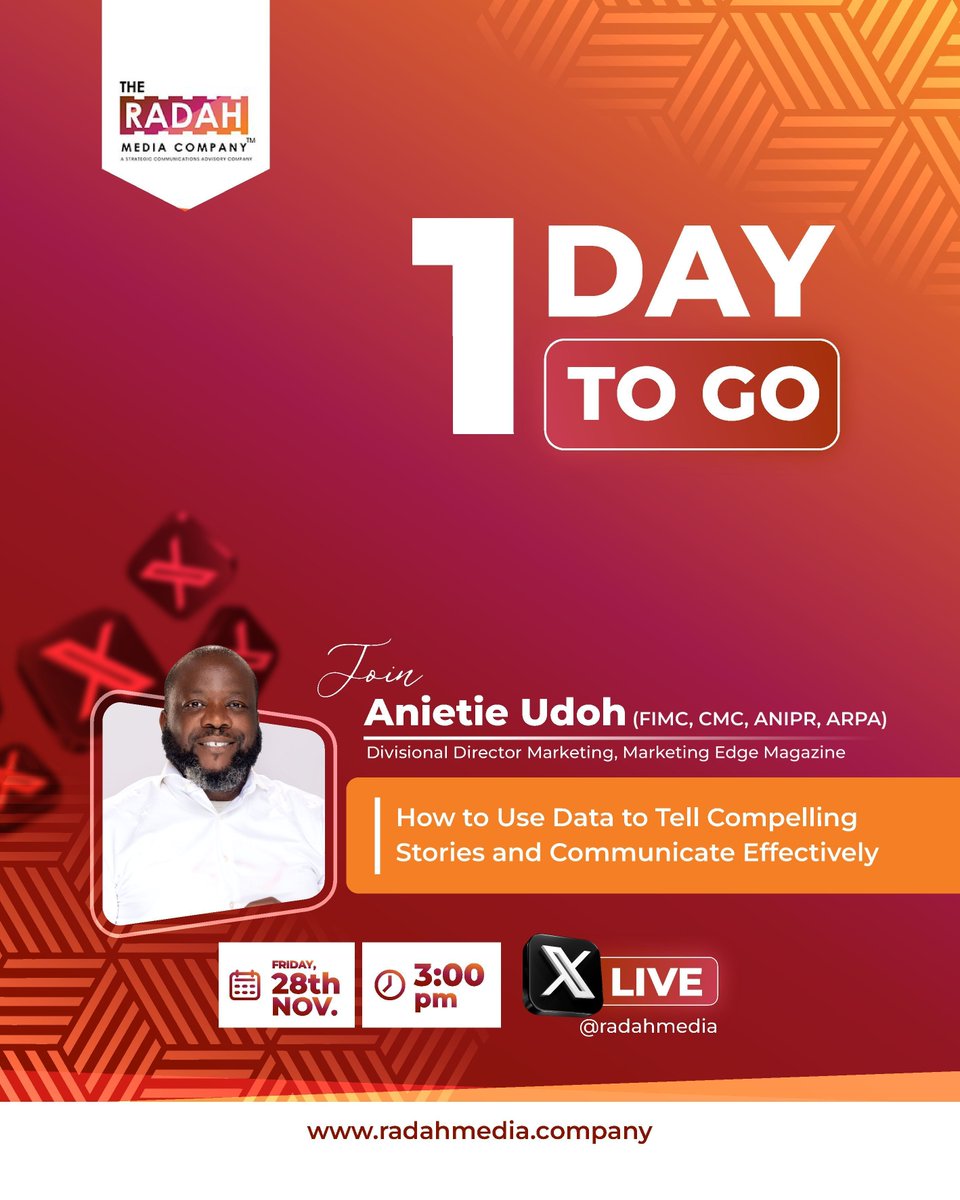
Storytelling is central to good communication, and weaving data into your narratives makes them even more memorable. Join us for a chat this Friday with Anietie Udoh on how to turn data into stories people actually remember. #DECODEDLive #DataStorytelling #StrategicCommunication
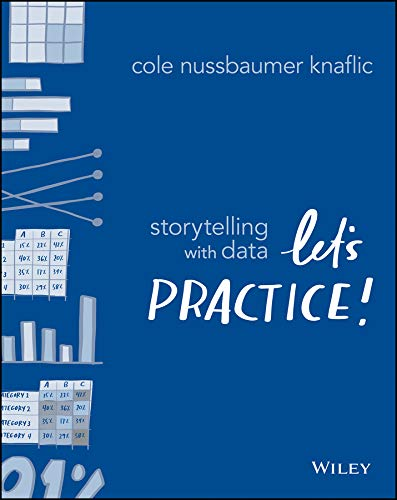
Storytelling with Data — Let's Practice! ➡️ amzn.to/46nSvIu ⬅️ ———— #DataStorytelling #DataViz #DataScience #BI #Infovis #DataScientist #CDO #DataLiteracy #DesignThinking
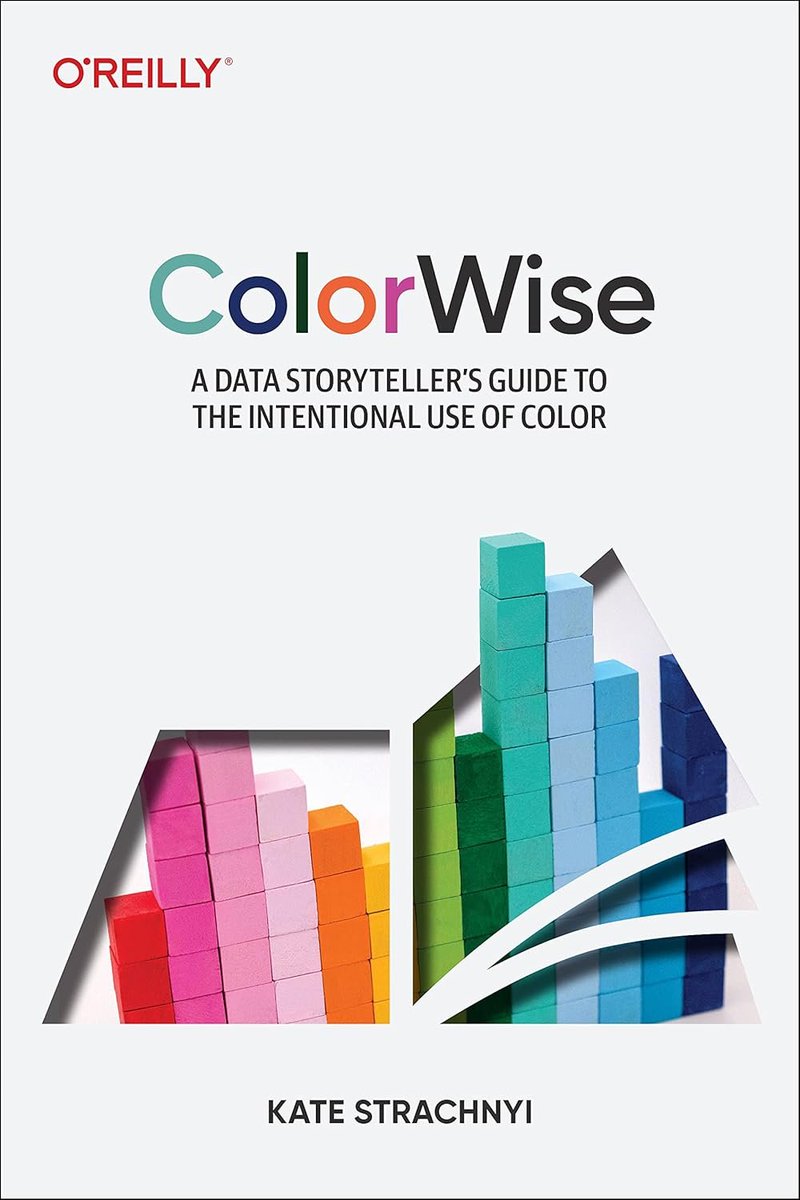
You must see this colorful, informative, and useful book “ColorWise - A Data Storyteller's Guide to the Intentional Use of Color” from Kate Strachnyi @datacated_ — at amzn.to/3BWymMA #Design #DataStorytelling #DataViz

Corporate remote era? 😏 Slide into my DMs with "REMOTE" to discover the wonders of MY digital agency!! #datastorytelling #socialmediamanagement #generativeai

Data informs. Stories connect. Discover how to tell client stories that honor data and humanity equally. 💬 Read here: claritytoimpact.com/how-to-use-pro… #StorytellingTips #ContentWriting #DataStorytelling #Storytelling #ImpactWriting #Nonprofit

💯🌟❤️📊📈 Beautifully published #DataViz books by @jschwabish Better Data Visualizations: amzn.to/3s2jIMX Others (e.g, Data Visualization in Excel): amzn.to/3sPSLCt ————— #DataStorytelling #DataLiteracy #Statistics #DataScience #DataScientists #BI #Analytics


Week 5 @TDataImmersed All about Data Storytelling & analytical thinking ! Refined my dashboard thanks to @DanielTomi11 class. Significant progress made!🧠 @DabereNnamani @JudeRaji_ @msexcel #TDI #DataStorytelling #DataAnalytics


8 #Python Visualization Tricks That Make Your Data Pop: python.plainenglish.io/8-python-visua… by Abdur Rahman on Medium ————— #DataViz #DataStorytelling #DataScience #DataScientist


Week 4 of the Metro Bank Analytics Challenge at #LetsTalkExcelWithFreedom From raw branch data ➝ calculated columns ➝ pivot insights ➝ executive visuals. This week’s focus: Branch Performance & Efficiency #ExcelDashboard #DataStorytelling #Datavisualization #Excel


Data storytelling is a multi-disciplinary approach that combines elements of data science, storytelling, and visual design to communicate information. Learn how #CPD courses can help you become an effective data storyteller. #datastorytelling #training cpduk.co.uk/news/advantage…


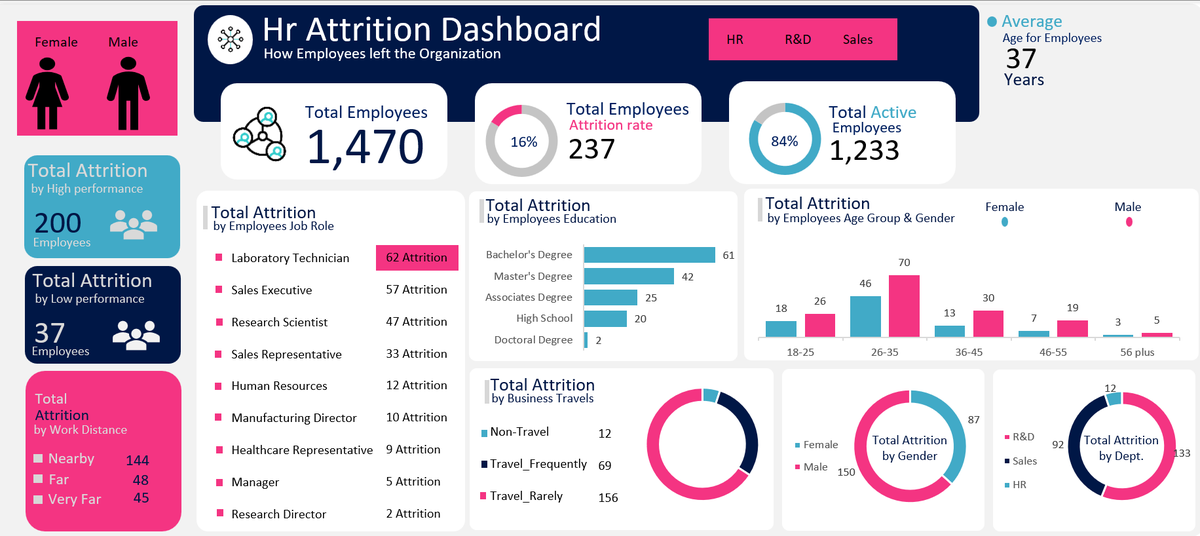
Out of 1,470 employees, 237 left. Surprisingly, over 200 were high performers. Attrition isn’t about weak links, it’s about lost engagement and missed growth. See the full analysis on LinkedIn 👇 linkedin.com/posts/oluwafer… #DataStorytelling #HRAnalytics

Whether you're a founder, marketer, or creator, PixelPlot empowers you to move fast, work smarter and always stay on brand. #DataVisualization #AIforBusiness #DataStorytelling #ProductivityTools #PixelPlotAI #DataMadeSimple #WorkSmarter

Join me for a #DataStorytelling workshop. In-person or virtual. Turn your data into a graphical story! Go beyond the bar chart! 2 x virtual half days: 11th & 12th Nov 🇬🇧 UK/EU/AUS Deets: bit.ly/IIBWAB Reviews: #iibwab

I was exposed to the wonders of PowerPoint for data storytelling first by @G_toluwalase at @dattawithdanny. #datafam explore the simple slides here👇 tinyurl.com/yc2vuh88 #datanalysis #datastorytelling #Powerpoint


Hi #datafam , This or that ? With @iam_daniiell Join @dattawithdanny now for a 1-on-1 mentorship on Data Analysis.


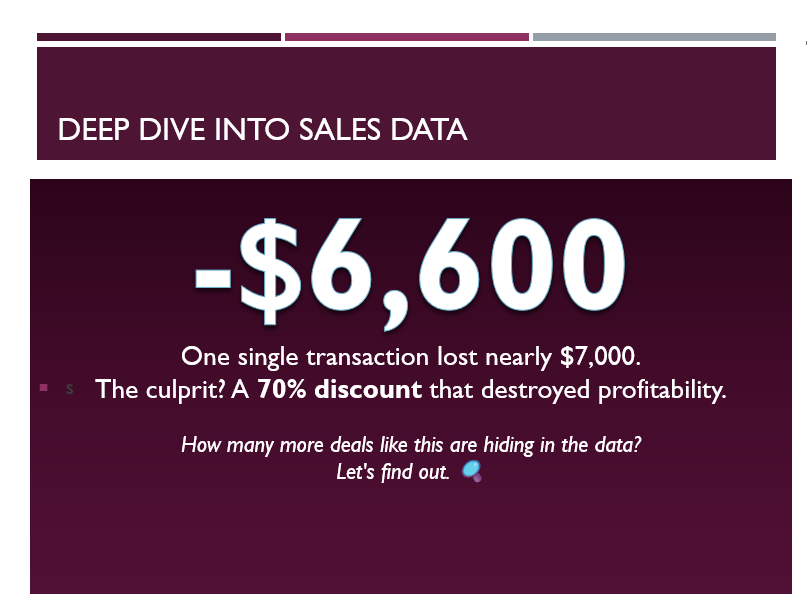
Stage 0 ✅ – @hnginternship Data Analysis Track Used Excel to analyze 4 years of Superstore sales data Consumers = biggest profit drivers 💰 Discounts >30% = consistent losses ⚠️ Turning data into stories that drive decisions! 🔗drive.google.com/file/d/1AT1lLC… #DataStorytelling

It's been a minute since I last dived into @PowerBI I spent my weekend digging into the World Happiness dataset from @kaggle and it really brought back my passion for data storytelling. You know what? Money isn't everything. #PowerBI #DataAnalytics #DataStorytelling


📊✨ New blog: Storytelling With Data Discover how to turn dashboards into clear, actionable narratives that drive smarter decisions. Read now and elevate your data game : getsiteware.com/storytelling-w… #DataStorytelling #Analytics #Dashboards #BI #Insights #SiteWare


THE LESSON - If your customers live month-to-month, your revenue will die month-to-month. - Build value so strong that staying feels natural, and leaving feels like losing something great. - Don’t build a cage. Build a commitment. #businessintelligence #datastorytelling

The role of data storytelling in business: transforming complex data into compelling narratives for better decision-making. #DataStorytelling #BusinessInsights

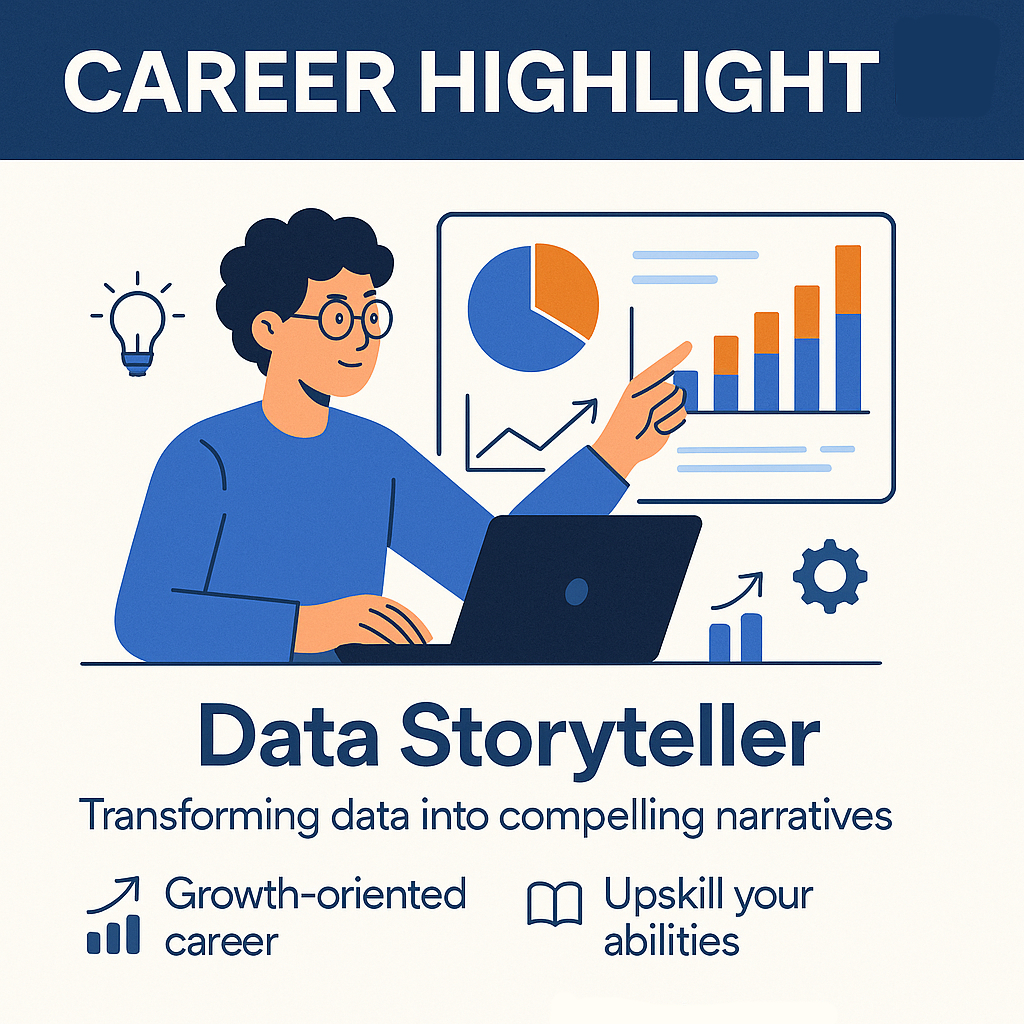
Ever thought about becoming a Data Storyteller? Transform complex data into compelling narratives, turning numbers into stories that drive decisions! Start your journey with AllRounder.ai, your smart learning companion! #DataStorytelling #Analytics #Career #AllRounderAI
Just 1 day to go! Join us tomorrow as Anietie Udoh breaks down how to transform raw data into powerful stories that elevate your communication, marketing, and PR impact, live on X at 3 PM WAT. #DECODEDLive #DataStorytelling #TheRadahMedia #Media #PR #Marketing #Communication

Data without narrative is just noise. Anyone can present numbers. But the storyteller? They turn information into influence. Learn to narrate, not just display. #DataStorytelling

#ICYMI "When you are doing visualisations, you have to make them simple for an ordinary person to understand. You use elements like colour, lines and other techniques to make it simple and easy for an ordinary person to understand." @Johnblanshe_m #DataStorytelling…
Data-driven storytelling is still uncommon in many newsrooms. It demands curiosity, a willingness to dig into numbers, and the patience to let data reveal the real story, a path many journalists often shy away from. In this conversation, @davidkangye sits down with…


✅ Keep it clean Avoid clutter, heavy colors, or unnecessary charts. 🎯 Great dashboards make people say: “I get it.” Not: “Where do I start?” #30DaysOfDataStories #ExcelDashboard #DataStorytelling #DashboardDesign #LearnInPublic
Storytelling is central to good communication, and weaving data into your narratives makes them even more memorable. Join us for a chat this Friday with Anietie Udoh on how to turn data into stories people actually remember. #DECODEDLive #DataStorytelling #StrategicCommunication

Data + Story = Impact. Sign up for our 1-day Data Storytelling course and learn how to present technical insights to non-technical stakeholders. Build narratives, design visuals & gain trust. frameworktraining.co.uk/courses/data/b… #DataStorytelling #BI #DataScience


DATA STORYTELLING. La magia de contar datos con historias (o a través de ellas) 📖 Los datos por sí solos no comunican, informan. Las historias transforman #datastorytelling 🟢 En Spotify: open.spotify.com/episode/62W55M… 🔴 En Youtube: youtube.com/watch?v=_attKr… #podcast #storytelling

youtube.com
YouTube
La magia de contar datos con historias 📈📖 CAP. 28

If stakeholders forget your data minutes after the meeting, you don’t need more charts—you need better stories. Great guide on turning change data into decisions. #ChangeManagement #DataStorytelling #ChangeAnalytics zurl.co/HrNkw

Excel isn’t just for tables - it’s a compass. Filter, summarize, calculate, visualize. With purpose, raw data becomes insight. #ExcelTips #DataStorytelling


Data informs. Stories connect. Discover how to tell client stories that honor data and humanity equally. 💬 Read here: claritytoimpact.com/how-to-use-pro… #StorytellingTips #ContentWriting #DataStorytelling #Storytelling #ImpactWriting #Nonprofit
Storytelling with Data — Let's Practice! ➡️ amzn.to/46nSvIu ⬅️ ———— #DataStorytelling #DataViz #DataScience #BI #Infovis #DataScientist #CDO #DataLiteracy #DesignThinking
Storytelling is central to good communication, and weaving data into your narratives makes them even more memorable. Join us for a chat this Friday with Anietie Udoh on how to turn data into stories people actually remember. #DECODEDLive #DataStorytelling #StrategicCommunication
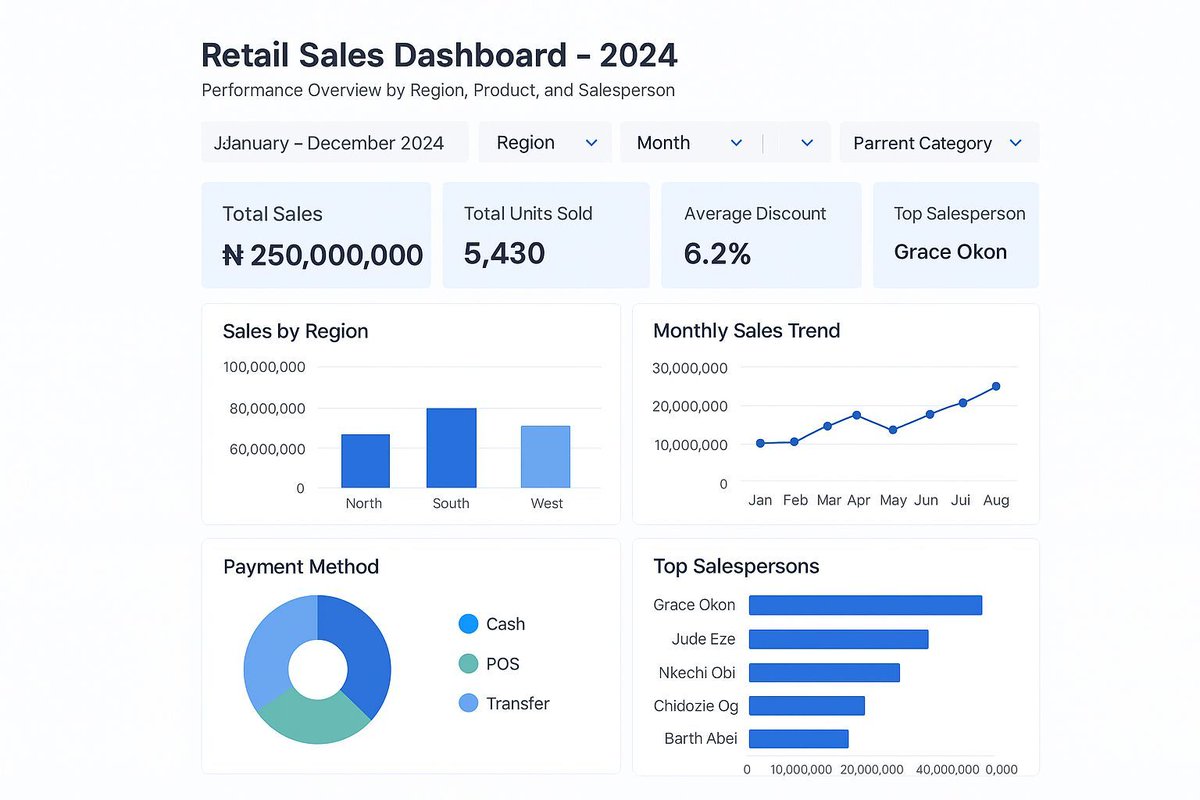
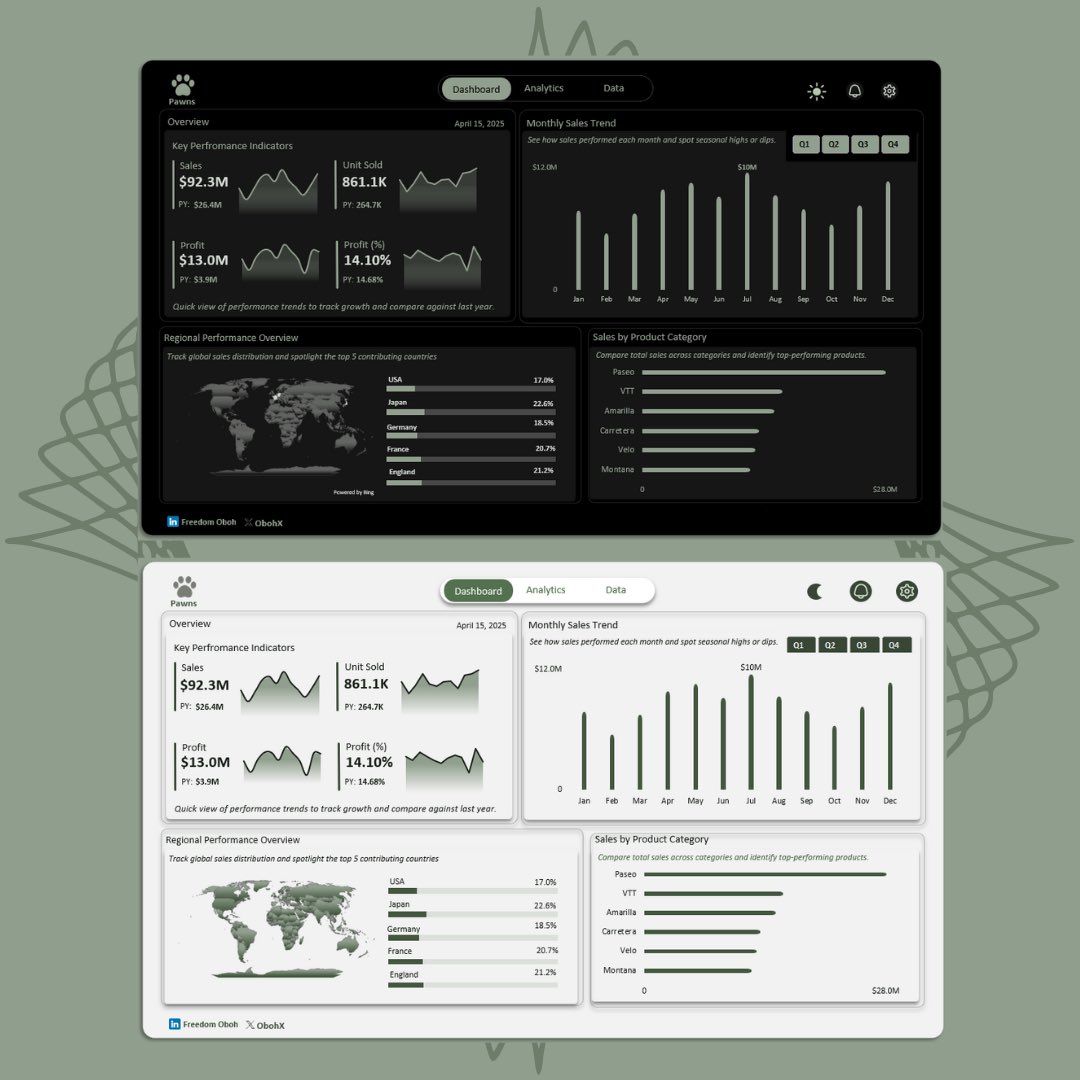
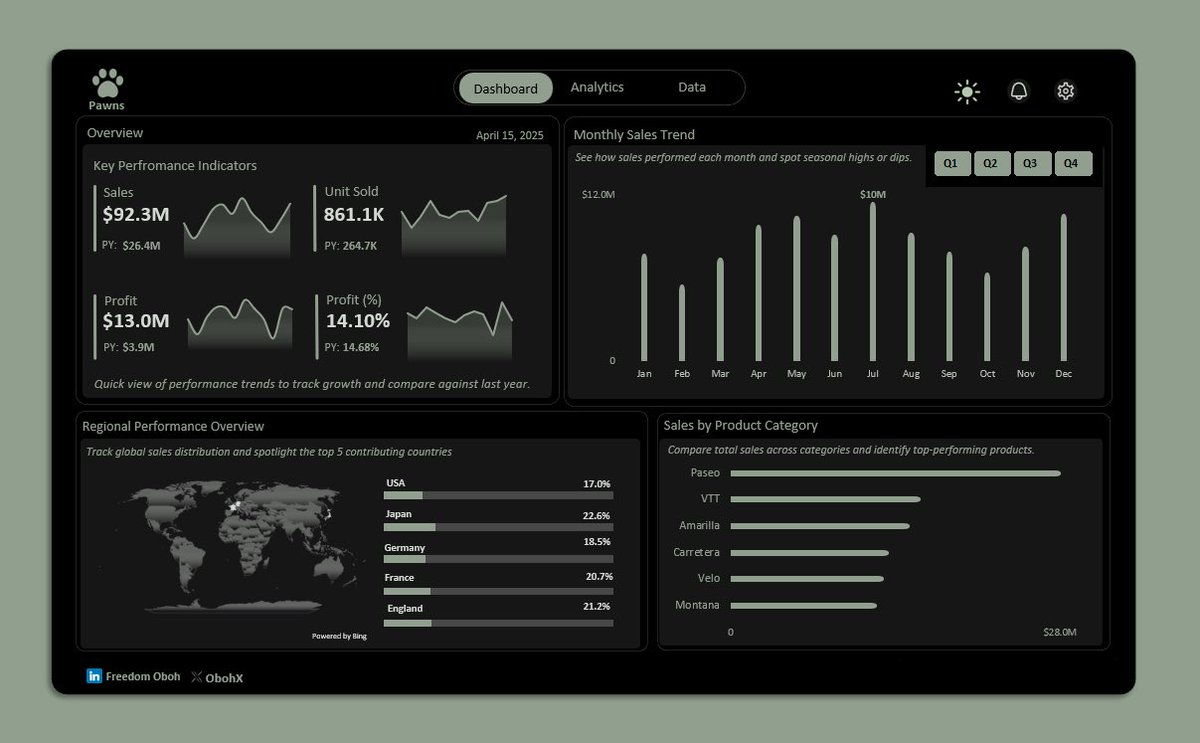
Hey #Datafam ! 🤟 Another @msexcel dashboard, now with both light & dark mode 🌗 Clean design, clear storytelling, from KPIs and monthly trends to product performance and regional breakdowns. Every piece was built with intention. #ExcelDashboard #DataStorytelling #Excel

Beautiful #DataViz and #InfoVis books, great for #DataStorytelling and #VisualAnalytics, by @EdwardTufte => see them all at amzn.to/48jd78K + See his online course: edwardtufte.com/tufte/courses
Data storytelling is a multi-disciplinary approach that combines elements of data science, storytelling, and visual design to communicate information. Learn how #CPD courses can help you become an effective data storyteller. #datastorytelling #training cpduk.co.uk/news/advantage…
Week 5 @TDataImmersed All about Data Storytelling & analytical thinking ! Refined my dashboard thanks to @DanielTomi11 class. Significant progress made!🧠 @DabereNnamani @JudeRaji_ @msexcel #TDI #DataStorytelling #DataAnalytics
Loaded data with Power Query, analyzed and summarized with Pivot Tables, added dynamic titles & filters. Enjoy your weekend! 🫶❤️ #ExcelDashboard #DataStorytelling #Datavisualization #Analytics #Excel #growth

You must see this colorful, informative, and useful book “ColorWise - A Data Storyteller's Guide to the Intentional Use of Color” from Kate Strachnyi @datacated_ — at amzn.to/3BWymMA #Design #DataStorytelling #DataViz

I am participating in FP20 Analytics Challenge 25 For this challenge, I worked on building an Inventory Management Dashboard using Power BI. #InventoryManagementAnalysis #DataStorytelling

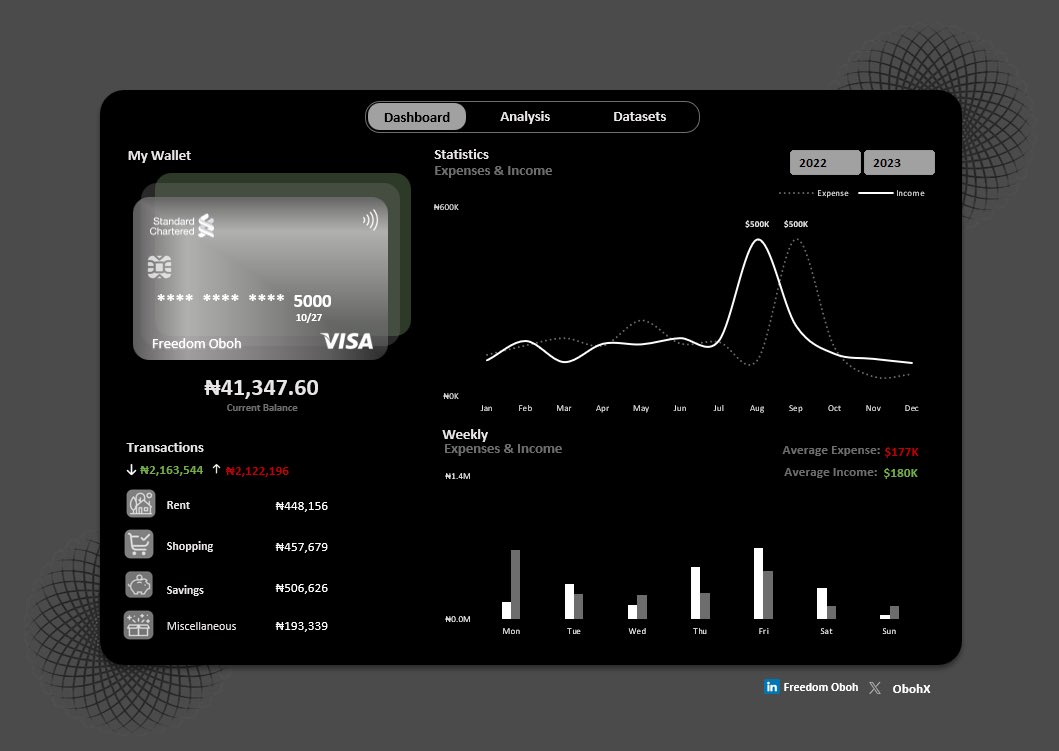
Hey #Datafam 🫶 A BIG thanks to everyone who worked on the personal finance tracker, y’all are mad creative! 👏🏽 Got a bit jealous 😂 so I grabbed a bank statement dataset, cleaned it, added new columns, and built this sleek dashboard… all in Excel ✨ #Excel #DataStorytelling
It's been a minute since I last dived into @PowerBI I spent my weekend digging into the World Happiness dataset from @kaggle and it really brought back my passion for data storytelling. You know what? Money isn't everything. #PowerBI #DataAnalytics #DataStorytelling
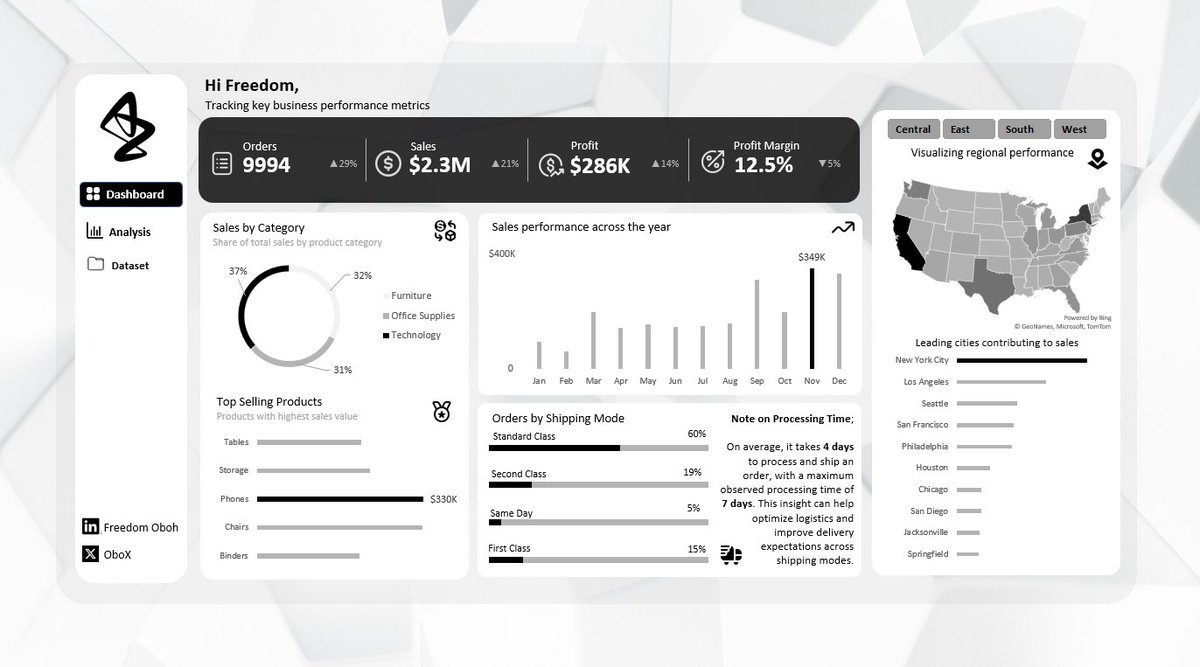
Built an @msexcel dashboard to analyze e-commerce operations and guess what caught my eye? Order vs. Shipping Date. Turns out, the average processing time is 4 days, with some taking up to 7 days. Eye-opening for logistics decisions. #Excel #Datavisualization #DataStorytelling
8 #Python Visualization Tricks That Make Your Data Pop: python.plainenglish.io/8-python-visua… by Abdur Rahman on Medium ————— #DataViz #DataStorytelling #DataScience #DataScientist

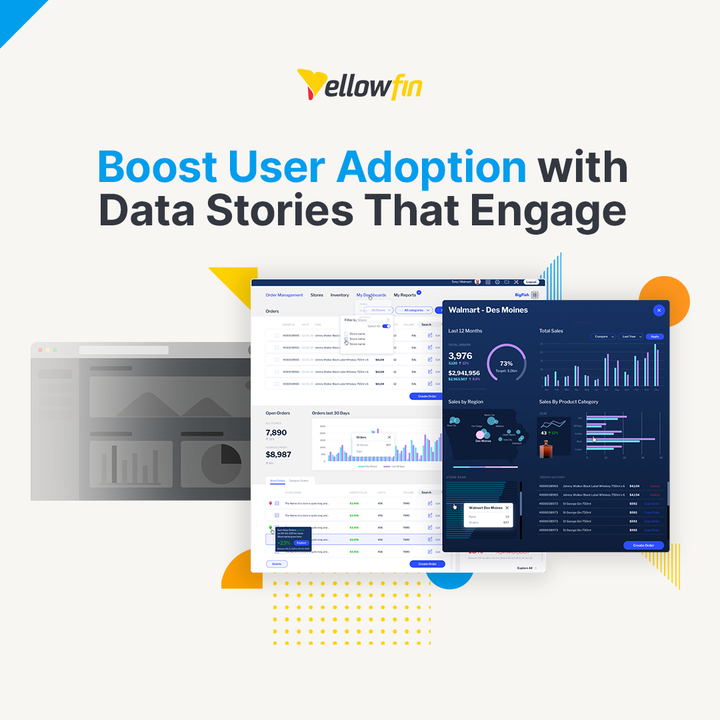
Dashboards only show data. With Yellowfin Stories & Presentations, you can tell the story behind it. Transform insights into impact. 👉 bit.ly/3WNHsWz #DataStorytelling #Analytics #YellowfinBI
Hey #Datafam Been a minute, but I had to sneak this in 😌 A clean, interactive Sales Overview Dashboard, fully filterable by Sales Rep. Simple. Sleek. Straight to the point. Neutral tones? Winning my heart lately 😂 #ExcelDashboard #DataStorytelling #Datavisualization #Excel

💯🌟❤️📊📈 Beautifully published #DataViz books by @jschwabish Better Data Visualizations: amzn.to/3s2jIMX Others (e.g, Data Visualization in Excel): amzn.to/3sPSLCt ————— #DataStorytelling #DataLiteracy #Statistics #DataScience #DataScientists #BI #Analytics

Over the past few days, I worked on analyzing customer behavior and revenue analysis using Excel. The goal was to understand who our customers are, how are shop and where revenue is being generated the most #DataAnalytics #Datastorytelling #Excel #DataAnalyst

I was exposed to the wonders of PowerPoint for data storytelling first by @G_toluwalase at @dattawithdanny. #datafam explore the simple slides here👇 tinyurl.com/yc2vuh88 #datanalysis #datastorytelling #Powerpoint
Hi #datafam , This or that ? With @iam_daniiell Join @dattawithdanny now for a 1-on-1 mentorship on Data Analysis.
Something went wrong.
Something went wrong.
United States Trends
- 1. Penn State 18.7K posts
- 2. #twitchrecap 12.3K posts
- 3. #TADCFriend 1,547 posts
- 4. Romero 22.2K posts
- 5. Slay 19.7K posts
- 6. Pat Kraft 2,180 posts
- 7. Paul Dano 1,115 posts
- 8. Zion 9,544 posts
- 9. #GivingTuesday 31.5K posts
- 10. Fulham 44.9K posts
- 11. Lewandowski 27.7K posts
- 12. Larry 61.7K posts
- 13. Tarantino 7,586 posts
- 14. Sabrina Carpenter 42.7K posts
- 15. Adam Thielen 3,983 posts
- 16. Alek Manoah N/A
- 17. Pedri 58.4K posts
- 18. Franklin 66.5K posts
- 19. Rashford 10.7K posts
- 20. Blanca 30.3K posts