#learningdata search results

A follow up on my personal Project. Analyzed a Neuro-psych Dataset, the insights were amazing💯 People generally think Depression is the most diagnosed diagnosis, but Data Proves otherwise. Schizophrenia shows to be highest even across all genders. #DataAnalytics #LearningData


Hey Twitter fam 👋 I’m uche lennox a Data Analyst who enjoys finding stories hidden inside data 📊 Currently learning, building, and sharing my journey in data analytics, visualization & insights. Follow along if you love data too! 🚀 #DataAnalysis #LearningData


Day Eight of Learning Data Analysis📊 At first, the dataset looked like nothing more than endless rows and columns. But once I started cleaning it up and creating reports with pivot tables in Excel, the numbers begins to tell a story. #LearningData #Excel #Data


Excited to start my journey as a Data Analyst! I’ve just set up my portfolio where I’ll soon share projects in Excel, SQL, Power BI & Python. Can’t wait to learn, build, and share my progress here! omdiwakar.netlify.app #DataAnalytics #Portfolio #LearningData #datasciencefun
New Dashboard Alert! Analyzed 41,540 admissions across 8 Saudi hospitals: ✅ 60% male patients ✅ 18–45 age group drives emergency visits ✅ Seasonal peaks in Spring & Summer ✅ Targeted recommendations to improve care & reduce readmissions #DataAnalytics #LearningData #Data


¡Día 17 del reto #100DaysOfData completado! 🎉 Terminé el primer módulo del curso "Intermediate Data Modeling in Power BI". Aprendimos a crear llaves combinadas y exploramos un caso de modelado con dos tablas de hechos. 💪 #DataModelling #LearningData #DataAnalytics


📌 How can we improve both, India's public and private schools? In the first video in our series on #PublicDisclosure, Prof. @karthik_econ talks about the role of #LearningData disclosure in improving all schools - whether public or private. He shares how systemic changes can…


journey too! Any advice, resources, or beginner-friendly projects you recommend? 🙏 Let’s grow together. #DataAnalytics #DataScience #LearningData #100DaysOfCode #SQL #Python
Data Modelling!!!! I remember when I found it hard to comprehend😅😅 Now it's a Breeze 💪 This shows daily Improvements. I'll post the Visualization on what I'm working on soon!! #DataAnalytics #LearningData #Datamodeling

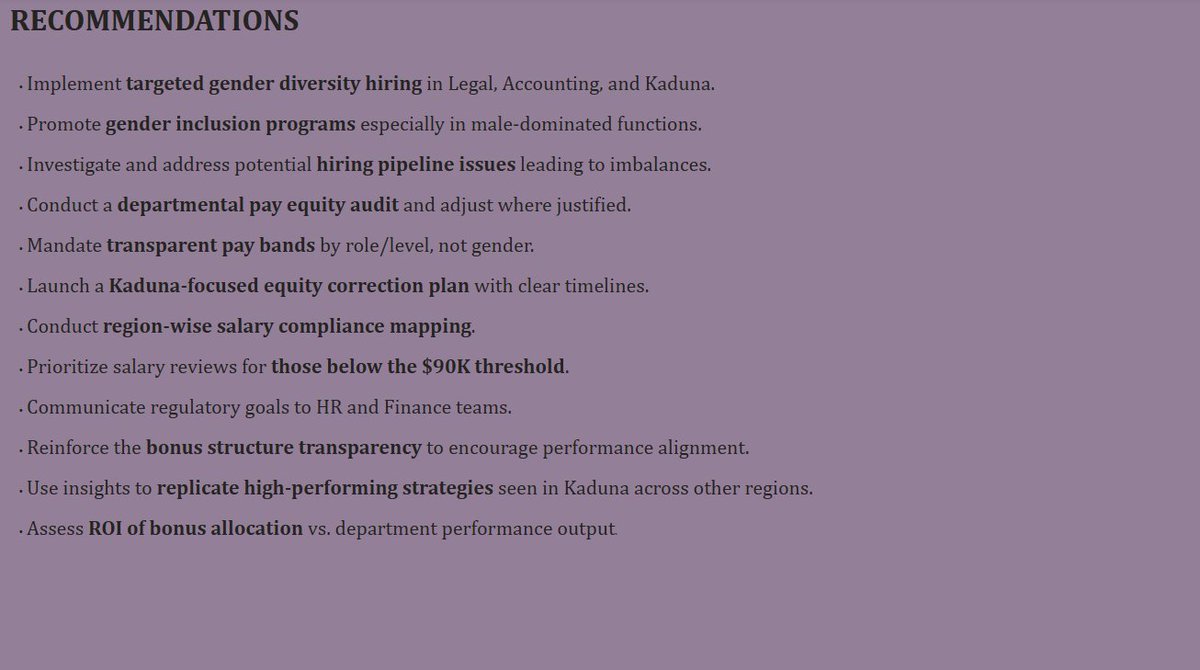
Wrapped up an HR Analytics dashboard in Power BI! ✅ Salary structure ✅ Gender pay gap ✅ $90K compliance ✅ Bonus allocations ✅ Dept/Region breakdown 🔍 Data-driven decisions start here. #PowerBI #DataAnalytics #LearningData


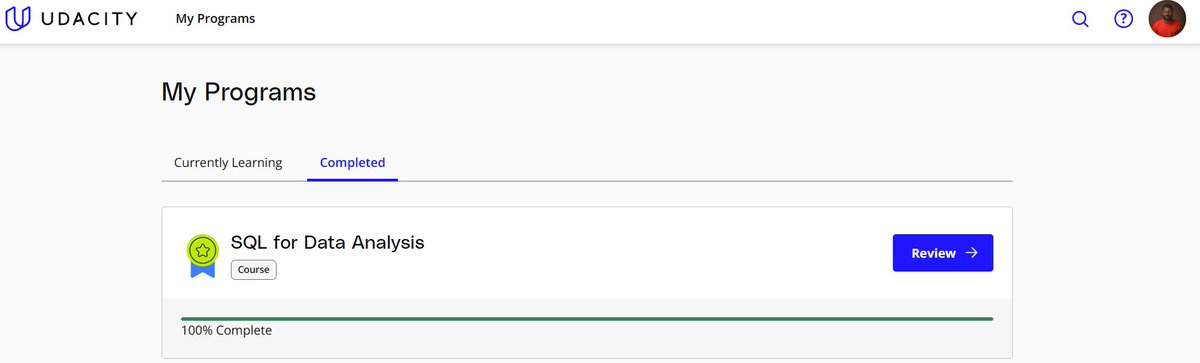
Today, i finished my first SQL course on Udacity. It took me about a month to go through the entire outline. I learned about Basic aggregations, SQL joins, Subqueries and Windows functions. #DataScience #learningdata #LearnDataAnalyticswithTina

📅 Day 15 of #100DaysOfDataAnalysis Today, I started learning SQL , a tool that helps you ask questions from data 🧠💻 I’m excited to keep learning and growing! #SQL #LearningData #DataForBeginners #DataCommunity


How is your org using #LearningData—and are you ready for what’s next? #LearningAnalytics is evolving fast: ✔ AI-powered personalization ✔ Predictive insights for skill gaps ✔ Smarter impact metrics ✔ Ethical data use It’s time to transform, not just track.


😌Excited to dive into the Data world! 📊 Currently on a journey of learning Data Analysis and uncovering insights from the numbers. 📈 #DataAnalytics #LearningData

D𝐢𝐟𝐟𝐞𝐫𝐞𝐧𝐜𝐞 between 𝐚 𝐃𝐚𝐭𝐚 𝐀𝐧𝐚𝐥𝐲𝐬𝐭 and 𝐃𝐚𝐭𝐚 𝐒𝐜𝐢𝐞𝐧𝐭𝐢𝐬t👇 ⚡️Analyst: Makes sense of data to drive decisions ⚡️Scientist: Builds models and predicts outcomes Where do you see yourself?? #DataCareers #LearningData
Was searching for videos on designing interactive and functional dashboards in Excel and came across "Kenji Explains". This guy breaks the process down. Let me go and learn. I'm coming. I might do a thing. #LearningData #LearnDataAnalyticsWithTina

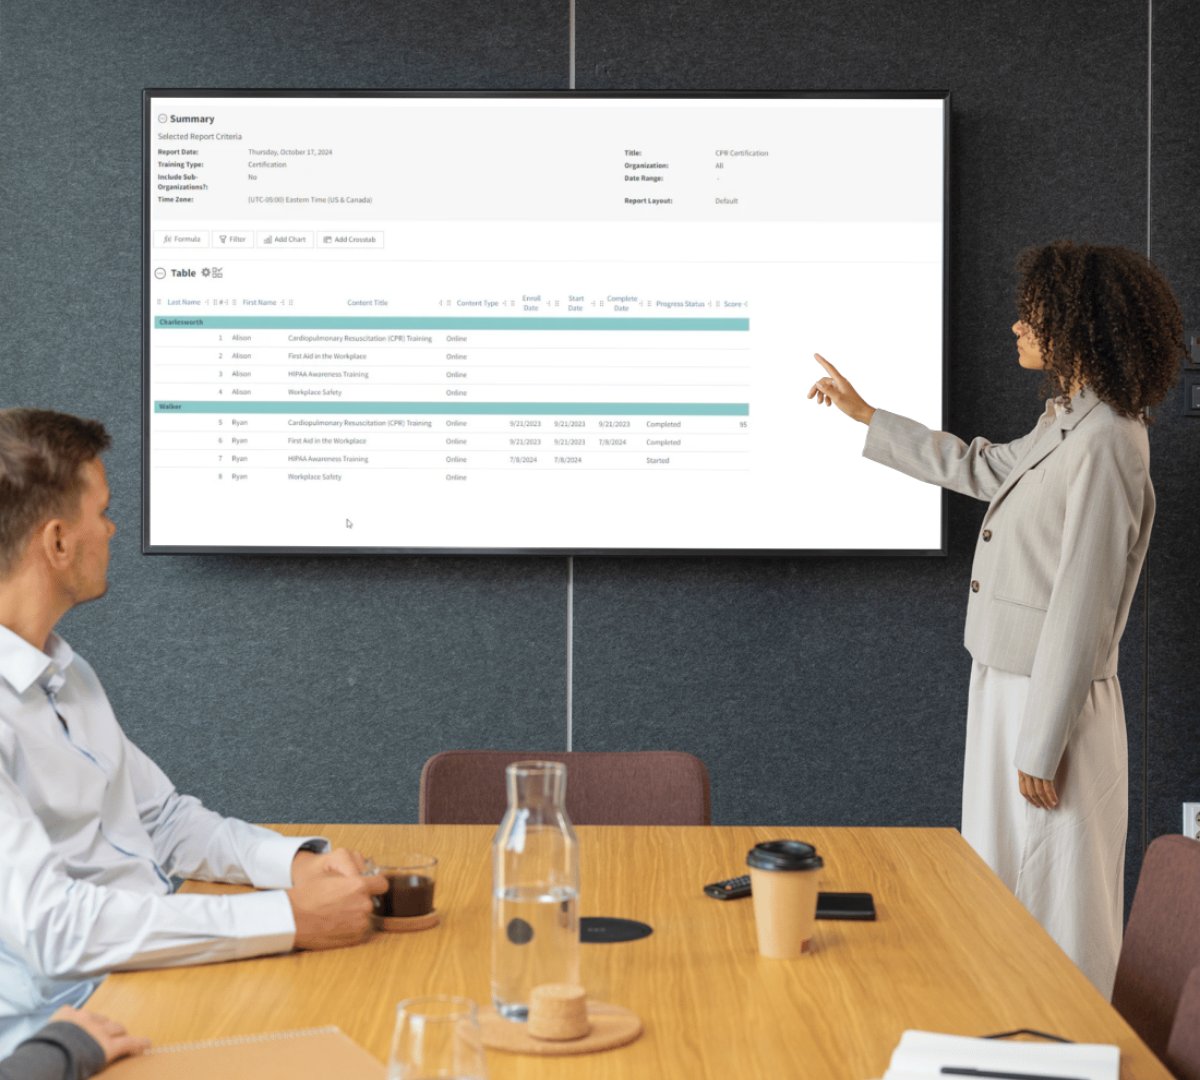
Real‑time dashboards in Meridian LMS let you drill down into learner performance and compliance metrics at the click of a button. bit.ly/4meaPgn #Analytics #LearningData
Hey Twitter fam 👋 I’m uche lennox a Data Analyst who enjoys finding stories hidden inside data 📊 Currently learning, building, and sharing my journey in data analytics, visualization & insights. Follow along if you love data too! 🚀 #DataAnalysis #LearningData
Day Eight of Learning Data Analysis📊 At first, the dataset looked like nothing more than endless rows and columns. But once I started cleaning it up and creating reports with pivot tables in Excel, the numbers begins to tell a story. #LearningData #Excel #Data

Your tools don’t make you good. Your curiosity does. Keep asking ‘what happens if…’ #DataTips #LearningData

Thread 🧵 #DataAnalysis #LearningData Today we’re talking about The Data Analysis Process — the journey data takes from being raw & messy to being meaningful & actionable.
📌 How can we improve both, India's public and private schools? In the first video in our series on #PublicDisclosure, Prof. @karthik_econ talks about the role of #LearningData disclosure in improving all schools - whether public or private. He shares how systemic changes can…

Is your L&D data truly impacting results? In our latest article, we explore 5 key learning analytics to unlock deeper insights, pinpoint gaps & prove ROI. Get the insights: hubs.ly/Q03z-3J10 #LearningAndDevelopment #LearningAnalytics #LearningData #ROI

📅 Day 15 of #100DaysOfDataAnalysis Today, I started learning SQL , a tool that helps you ask questions from data 🧠💻 I’m excited to keep learning and growing! #SQL #LearningData #DataForBeginners #DataCommunity
D𝐢𝐟𝐟𝐞𝐫𝐞𝐧𝐜𝐞 between 𝐚 𝐃𝐚𝐭𝐚 𝐀𝐧𝐚𝐥𝐲𝐬𝐭 and 𝐃𝐚𝐭𝐚 𝐒𝐜𝐢𝐞𝐧𝐭𝐢𝐬t👇 ⚡️Analyst: Makes sense of data to drive decisions ⚡️Scientist: Builds models and predicts outcomes Where do you see yourself?? #DataCareers #LearningData
Real‑time dashboards in Meridian LMS let you drill down into learner performance and compliance metrics at the click of a button. bit.ly/4meaPgn #Analytics #LearningData
but to genuinely transform how decisions are made, turning raw information into actionable insights that drive real impact. #DAMPWTO #LearningData #DataIsBeautiful
Wrapped up an HR Analytics dashboard in Power BI! ✅ Salary structure ✅ Gender pay gap ✅ $90K compliance ✅ Bonus allocations ✅ Dept/Region breakdown 🔍 Data-driven decisions start here. #PowerBI #DataAnalytics #LearningData
New Dashboard Alert! Analyzed 41,540 admissions across 8 Saudi hospitals: ✅ 60% male patients ✅ 18–45 age group drives emergency visits ✅ Seasonal peaks in Spring & Summer ✅ Targeted recommendations to improve care & reduce readmissions #DataAnalytics #LearningData #Data

Day 2 - Understanding the Evolution of Data Stacks To master the future of data, I started by studying its past. Here’s a quick breakdown of the 3 eras of data stacks, and why it matters 👇🏾 #DataEngineering #DataStacks #LearningData #AI
A follow up on my personal Project. Analyzed a Neuro-psych Dataset, the insights were amazing💯 People generally think Depression is the most diagnosed diagnosis, but Data Proves otherwise. Schizophrenia shows to be highest even across all genders. #DataAnalytics #LearningData
Data Modelling!!!! I remember when I found it hard to comprehend😅😅 Now it's a Breeze 💪 This shows daily Improvements. I'll post the Visualization on what I'm working on soon!! #DataAnalytics #LearningData #Datamodeling

Get free access to the latest news on Learning Data! Stay informed and up-to-date with top insights and trends. #LearningData #FreeAccess medium.com/learning-data/…
Was searching for videos on designing interactive and functional dashboards in Excel and came across "Kenji Explains". This guy breaks the process down. Let me go and learn. I'm coming. I might do a thing. #LearningData #LearnDataAnalyticsWithTina

The best way to learn is by doing. Don’t wait until you’re "ready" — just start small. #DataTips #AnalyticsForBeginners #LearningData #thedairyofadatawriter #DigitalMarketing #ContentCreation #ContentWriting #copywriting
1. Understand the question before touching the data 2. Practice with small datasets — less scary, more clear 3. One chart at a time — bar, pie, then go big 4. You can start with spreadsheet 5. Use real-life data — like your budget #DataTips #thedairyofadatawriter #data


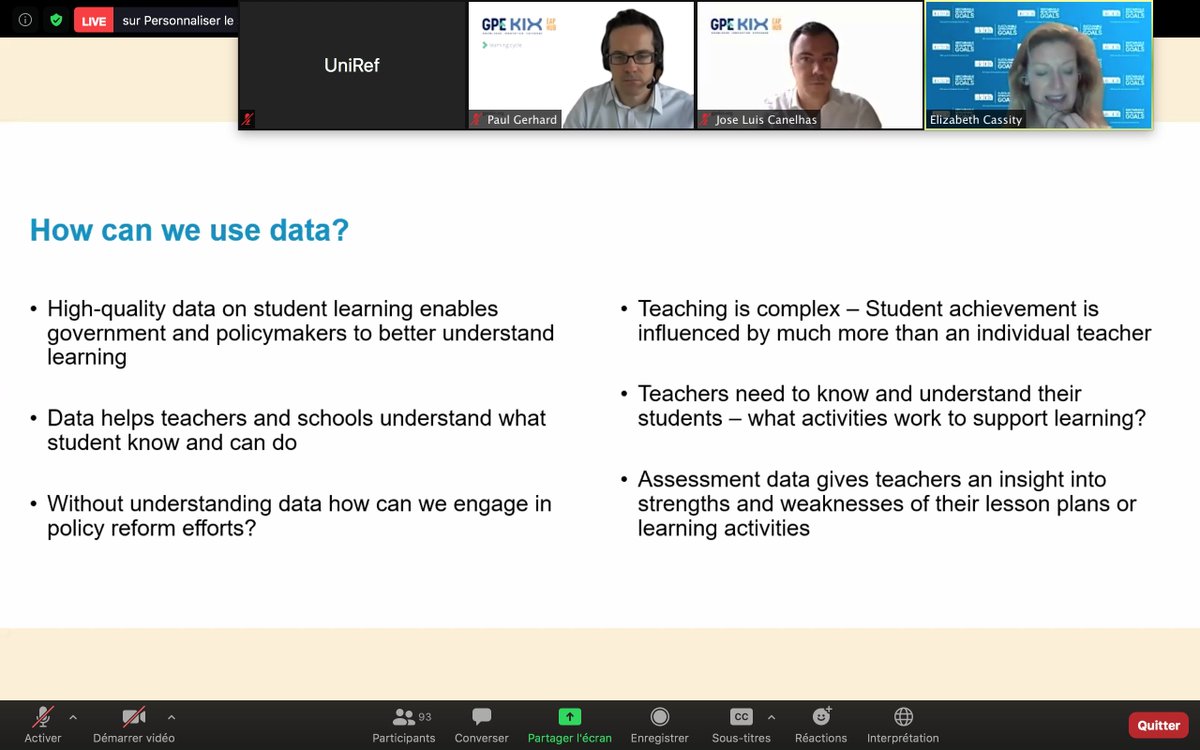
#Empowereducation What is learning and how do you measure it? How can we use Data? webinar #learningdata Using data to improve learning: Engaging with policy and reform with @acereduau and @Norrag Thank you @Norrag!UniRef is always pleased to take part of insightful webinars!

Looking forward to representing @mLevelLearning at the @DBHDD Learning Collaborative this week in Savannah! #microlearning #gamebasedlearning #learningdata


Thank you to @TrainingIndustr for including me into another great edition of your magazine! Check it out at buff.ly/2Y0Sd79 #learningdata


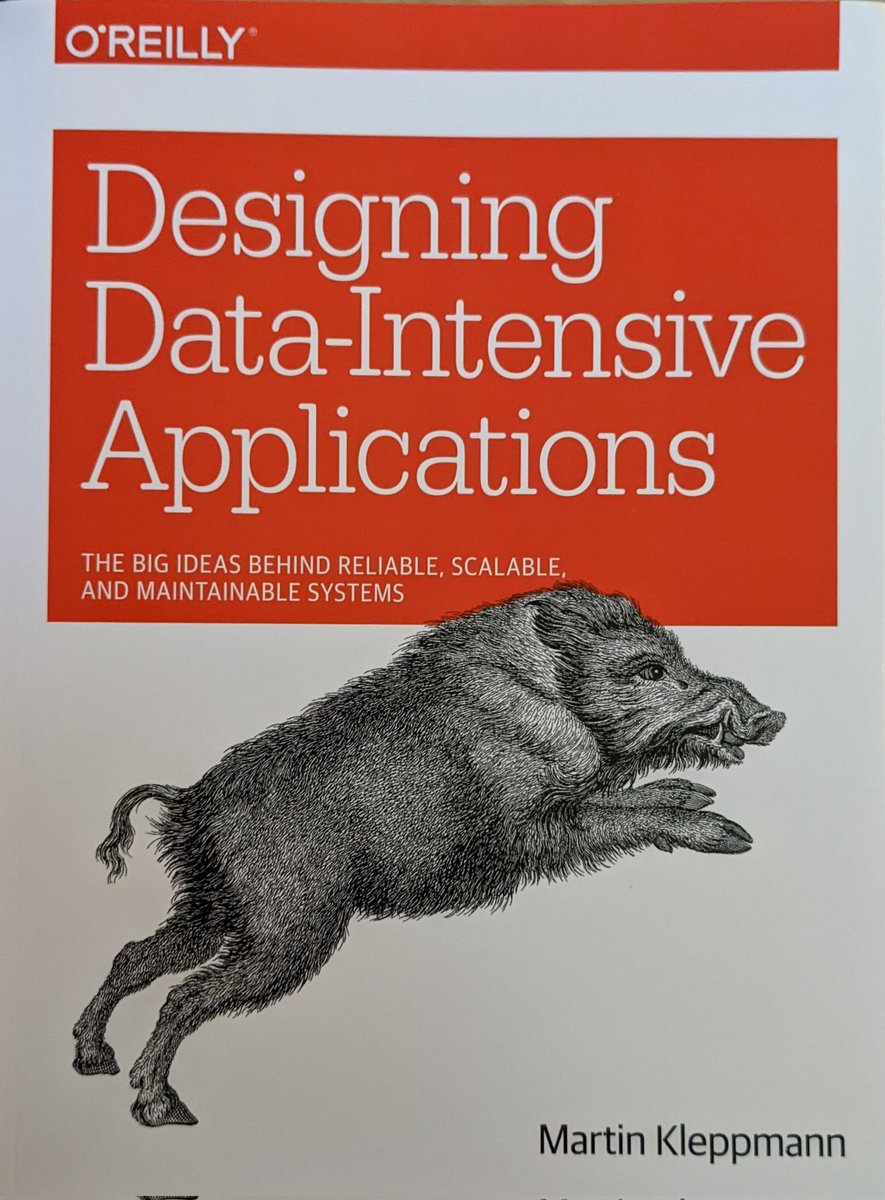
Gave this book to my hubby @atlantabass for Valentine's day, but I am sure I will benefit from this as well. 🙈 #LearningData #DataAnalytics #DataScience #WomenInSTEM
If you'd like to chat further about #xAPI and #learningdata design, be sure to connect with @DuncanWIV! #LDC2019 @learningdevcamp


#LearningData et #LearningAnalytics : on donne la parole aux données de l'ombre qui changent la donne. #RH #formpro #BigData via @sfraysse digital-learning-academy.com/learning-data-…

#xAPI references and resources to help in your design development. #xAPI #learningdata #LDC2019 @DuncanWIV


In need of better business decision making skills? Learn how with @SumTotalSystems free #webcast TODAY, about combining #learningdata with #businessdata to create value in your business decisions.Register Now: okt.to/tKf2wp

When you are using @Claned_ #platform your #learningdata is for you to benefit from. Safely and following #GDPR legal framework. Read the latest #blog on #data and #privacy by @topilitmanen, our Chief Educational Scientist. claned.com/your-can-benef…


Exploiter les #LearningData pour améliorer sa stratégie pédagogique de manière agile. #data via @WIDID_France digital-learning-academy.com/les-learning-d…

Some questions to ask yourself when starting the design process for your #learningdata strategy. @DuncanWIV #xAPI #ldc2019

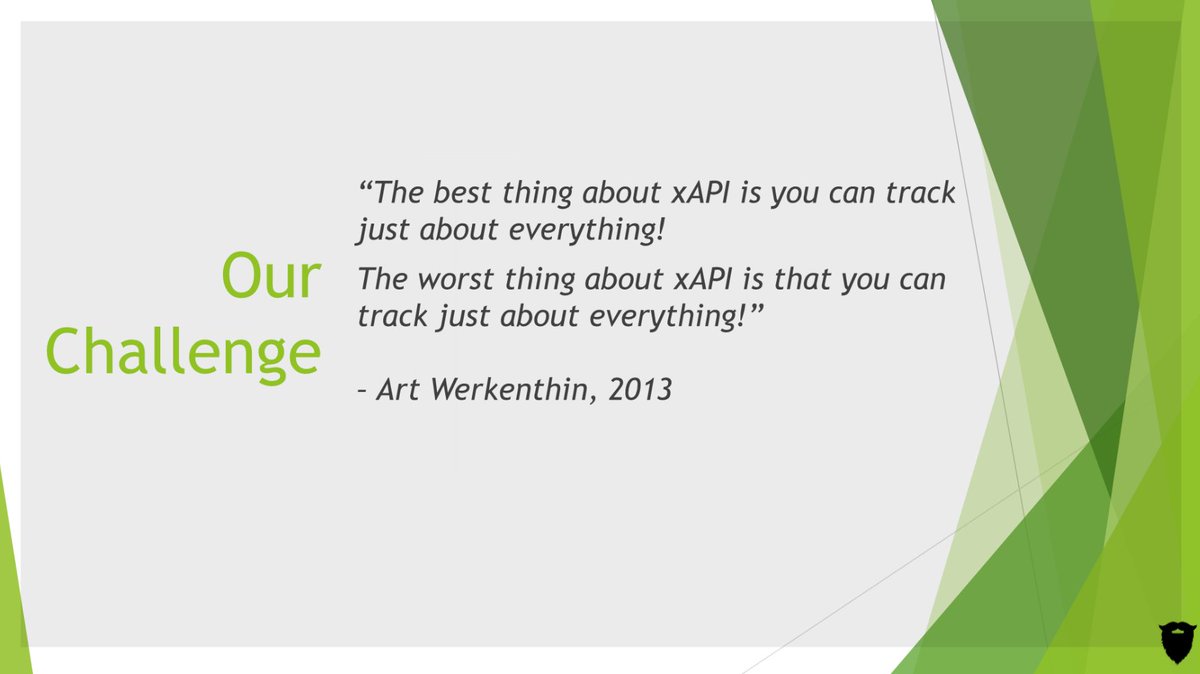
You can quote that from RISC President @AWerkenthin! @DuncanWIV discusses that just because you CAN capture all the data, doesn't mean you SHOULD capture all the data. #learningdata #xAPI #ldc2019

If you'd like to chat more about developing your data strategy or anything #xAPI, don't hesitate to connect with @AWerkenthin and @DuncanWIV. #xAPIParty #learningdata

Example of desired results so that L&D can course correct and/or intervene with #performancesupport. @DuncanWIV #learningdata #xAPI #ldc2019


How is #xAPI Used in the Real World? lttr.ai/jEnA @tlearning #learningdata #learninganalytics #eLearning

Head over to the Alpine room to join the conversation with @DuncanWIV on developing a #learningdata strategy to achieve measurable results and goals! #xAPI @learningdevcamp #ldc2019

Something went wrong.
Something went wrong.
United States Trends
- 1. Northern Lights 46.8K posts
- 2. #hazbinhotelspoilers 2,478 posts
- 3. #Aurora 10K posts
- 4. #chaggie 4,331 posts
- 5. #huskerdust 8,372 posts
- 6. Vaggie 5,538 posts
- 7. #DWTS 53.4K posts
- 8. Carmilla 2,461 posts
- 9. MIND-BLOWING 36K posts
- 10. AI-driven Web3 1,004 posts
- 11. H-1B 37.3K posts
- 12. Superb 22.8K posts
- 13. Justin Edwards 2,563 posts
- 14. H1-B 4,309 posts
- 15. Sabonis 6,275 posts
- 16. SPECTACULAR 25.4K posts
- 17. Wike 225K posts
- 18. Justified 18.2K posts
- 19. Cleto 2,682 posts
- 20. Creighton 2,356 posts