#raincloudplots search results

Sweet. #Raincloudplots tutorial in R is just about done. Now wrapping up our #matlab and #python tutorials. Preprint ASAP!
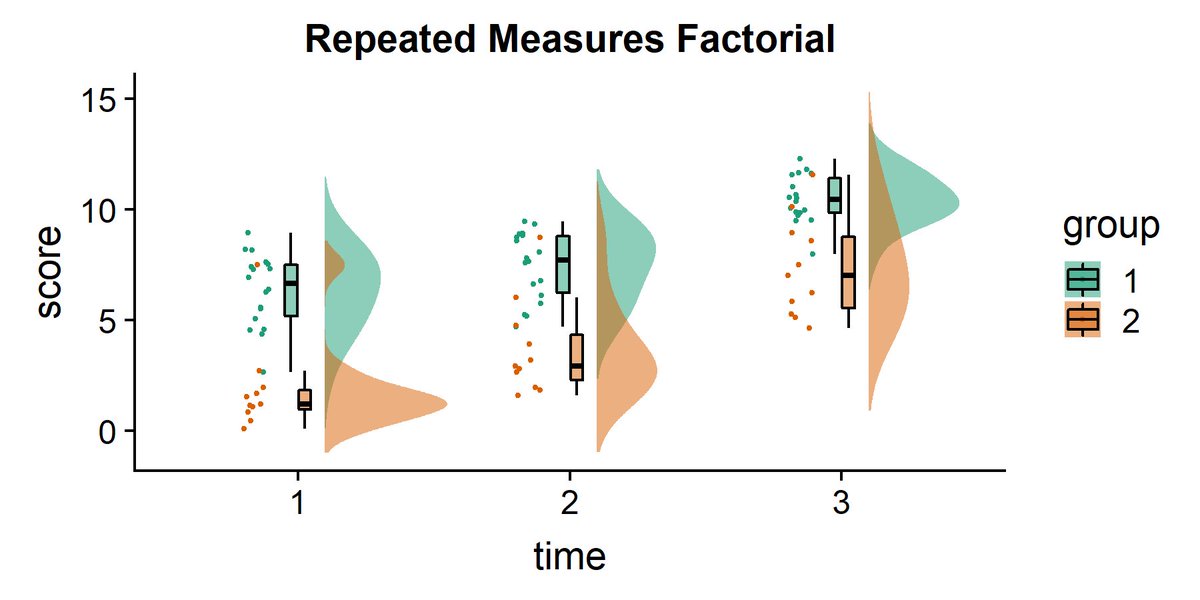


Data visualization is essential for behavioral scientists for communicating data effectively. A new approach called #RaincloudPlots by R may be a milestone in data visualization. It's simple, elegant, and highly informative. (Ref. @micahgallen et al.)


#raincloudplots making an appearance at computational psychiatry #EBPSWorkshop2018, in @ljthomas1991's excellent poster!


🚨📊 ¿Por qué deberías dejar de usar barplots? 🌧️🌈 Si sigues usando gráficos de barras con error para representar datos cuantitativos, estás perdiendo información valiosa. Aquí te explico por qué:👇🧵 #DataViz #RaincloudPlots #Analytics #RStats #DataScience #stats


Finally got #raincloudplots added to my analysis pipeline! Why #plotallthedata is important and meaningful! #dataviz #matlab


Como se ve en la figura (por cierto, #raincloudplots 😍), las creencias de eficacia van aumentando con el tiempo en el grupo autolimitado. Conforme nos recuperamos, le vamos atribuyendo esa mejoría al tratamiento. Recordad: un tratamiento completamente inútil que no hace nada.


But on a positive note, our more recent sample of gambling registrations scored much better than the random sample from Bakker et al. (see plots above), and scores appeared to be improving over time (see #raincloudplots ) (5/n)


2. One poster by the lab: one by @Sjouwerman_R on different reinstatement procedures illustrated by #raincloudplots and Bayesian stats.


One day it bothered me enough that I hacked together what I thought was a better plot, with help from the hive mind. I put up a blog post with some code. People started to contribute more code and ideas. #raincloudplots where born. wellcomeopenresearch.org/articles/4-63

Love these customized #raincloudplots in this new paper on odometry and spatial encoding! pnas.org/content/early/…


In short: order effects made us keep only the first half of the study. We are still powered for Congruency effect but not for regulation-attention questions. We found higher levels of HF-HRV during congruent biofeedback compared to incongruent. #raincloudplots @micahgallen 10/n

Digging the hybrid beeswarm-raincloud plots in this biomedical article on platelet size! #raincloudplots thieme-connect.com/products/ejour…


Really enjoyed my first JAM, where we shared joint speech data in beautiful #Genoa! @action_joint #jam8 Amazing talks by current/former labmates, like @rcanigueral and @culture_ada. Special thanks to @micahgallen and company for facilitating our #raincloudplots @CeciCaiqing

🚨📊 ¿Por qué deberías dejar de usar barplots? 🌧️🌈 Si sigues usando gráficos de barras con error para representar datos cuantitativos, estás perdiendo información valiosa. Aquí te explico por qué:👇🧵 #DataViz #RaincloudPlots #Analytics #RStats #DataScience #stats

Better & Easier Data Viz with #RaincloudPlots in #JASP (In-Depth Guide) 💻📊 youtu.be/AAdXUAl_w6E
youtube.com
YouTube
Better & Easier Data Viz with Raincloud Plots in JASP (In-Depth Guide)

Trying to balance transparency and simplicity when plotting data? Here's a guide for making minimalist #raincloudplots in #ggplot2, with comparisons to other popular #dataviz methods. #rstats #r4ds #ggdist dallasnova.rbind.io/post/efficient…
dallasnova.rbind.io
Efficient data visualization with faded raincloud plots | Dallas Novakowski
The raincloud plot is probably the 'gold standard' in transparent data vizualization, but it requires charting a lot of objects. To improve the legibility of the raincloud, we'll explore a modifica...

OMG, I just noticed that @micahgallen's #raincloudplots are fully integrated with #JASP. How amazing is that?

But on a positive note, our more recent sample of gambling registrations scored much better than the random sample from Bakker et al. (see plots above), and scores appeared to be improving over time (see #raincloudplots ) (5/n)

@CedScherer - loving #raincloudplots (cedricscherer.com/2021/06/06/vis…) I am struggling to flip these sideways (eg +coordflip()) -is this possible?

thank you and the #raincloudplots community for making a great way to represent the data very accessible 😀😀 !
Tagging the amazing #raincloudplots team @rogierK @kirstie_j @davidepoggiali and @jordyvanlangen as they all deserve endless thanks for their invaluable contributions!

Great thread about your favorite type of plots, #raincloudplots ! 🌧️
All through my postdoc, I'd been bothered by bar plots hiding data. Sometimes it was hiding beautiful variability needlessly, sometimes it was exaggerating minute effects. It bothered me endlessly. What a waste I thought.
One day it bothered me enough that I hacked together what I thought was a better plot, with help from the hive mind. I put up a blog post with some code. People started to contribute more code and ideas. #raincloudplots where born. wellcomeopenresearch.org/articles/4-63

Geez, its kinda tough to re-learn R after you haven´t been properly using it for ... a decade or so? I follow a tutorial for making #RaincloudPlots and of course its not working instantly 😅 Had to laugh pretty hard at my first crappy output though - an ugly boxplot😆😭 #RStats


I have to say the #RainCloudPlots (via PtitPrince) were a favorite last minute discovery. 💕 I mean, it's a paper on ☁️ storage. How perfect is that! Thanks to @kirstie_j and co. peerj.com/preprints/2713…
peerj.com
Raincloud plots: a multi-platform tool for robust data visualization
Across scientific disciplines, there is a rapidly growing recognition of the need for more statistically robust, transparent approaches to data visualization. Complimentary to this, many scientists...

@biorxivpreprint doi.org/10.1101/2021.0… compares chunk retrieval times for TIFF, HDF5 and Zarr locally, over HTTP and over S3.

Your gorgeous #raincloudplots advocate for the eradication of bar graphs in general :) pubmed.ncbi.nlm.nih.gov/25901488/

Encouraging results: Plain-language summaries foster credibility in research says this paper with the fancy #raincloudplots #scicomm


Plain-language summaries help lay people better understand the findings of psychology research online.ucpress.edu/collabra/artic…
online.ucpress.edu
Straight From the Scientist’s Mouth—Plain Language Summaries Promote Laypeople’s Comprehension and...
Easily comprehensible summaries of scholarly articles that are provided alongside ‘ordinary’ scientific abstracts, so-called plain language summaries, can be a powerful tool for communicating...

#ggplot2 is one of those things in life that bring me the most satisfaction 🤓📚📊 #DataVisualization #raincloudplots

This means that I have to redo all the figures for my next paper, @micahgallen ! Not sure how much I like that... :D CONGRATS! #Raincloudplots #ShowTheData
Exciting news 🌧️raincloud🌧️ fans! Raincloud plots 2.0 are here! Now with our most common feature request - a standalone R package! And STICKERS! wellcomeopenresearch.org/articles/4-63/…


Data visualization is essential for behavioral scientists for communicating data effectively. A new approach called #RaincloudPlots by R may be a milestone in data visualization. It's simple, elegant, and highly informative. (Ref. @micahgallen et al.)
Sweet. #Raincloudplots tutorial in R is just about done. Now wrapping up our #matlab and #python tutorials. Preprint ASAP!
#raincloudplots making an appearance at computational psychiatry #EBPSWorkshop2018, in @ljthomas1991's excellent poster!
Finally got #raincloudplots added to my analysis pipeline! Why #plotallthedata is important and meaningful! #dataviz #matlab
Como se ve en la figura (por cierto, #raincloudplots 😍), las creencias de eficacia van aumentando con el tiempo en el grupo autolimitado. Conforme nos recuperamos, le vamos atribuyendo esa mejoría al tratamiento. Recordad: un tratamiento completamente inútil que no hace nada.
🚨📊 ¿Por qué deberías dejar de usar barplots? 🌧️🌈 Si sigues usando gráficos de barras con error para representar datos cuantitativos, estás perdiendo información valiosa. Aquí te explico por qué:👇🧵 #DataViz #RaincloudPlots #Analytics #RStats #DataScience #stats
2. One poster by the lab: one by @Sjouwerman_R on different reinstatement procedures illustrated by #raincloudplots and Bayesian stats.
But on a positive note, our more recent sample of gambling registrations scored much better than the random sample from Bakker et al. (see plots above), and scores appeared to be improving over time (see #raincloudplots ) (5/n)
Geez, its kinda tough to re-learn R after you haven´t been properly using it for ... a decade or so? I follow a tutorial for making #RaincloudPlots and of course its not working instantly 😅 Had to laugh pretty hard at my first crappy output though - an ugly boxplot😆😭 #RStats
One day it bothered me enough that I hacked together what I thought was a better plot, with help from the hive mind. I put up a blog post with some code. People started to contribute more code and ideas. #raincloudplots where born. wellcomeopenresearch.org/articles/4-63
Love these customized #raincloudplots in this new paper on odometry and spatial encoding! pnas.org/content/early/…
Really enjoyed my first JAM, where we shared joint speech data in beautiful #Genoa! @action_joint #jam8 Amazing talks by current/former labmates, like @rcanigueral and @culture_ada. Special thanks to @micahgallen and company for facilitating our #raincloudplots @CeciCaiqing
Digging the hybrid beeswarm-raincloud plots in this biomedical article on platelet size! #raincloudplots thieme-connect.com/products/ejour…
Something went wrong.
Something went wrong.
United States Trends
- 1. #FinallyOverIt 5,777 posts
- 2. Summer Walker 18K posts
- 3. 5sos 22.2K posts
- 4. #criticalrolespoilers 4,172 posts
- 5. #GOAI 3,098 posts
- 6. #zzzSpecialProgram 3,073 posts
- 7. Wale 33.1K posts
- 8. Justin Fields 10.1K posts
- 9. #MakeOffer 12.9K posts
- 10. Domain For Sale 13.3K posts
- 11. Bihar 272K posts
- 12. Go Girl 25.7K posts
- 13. 1-800 Heartbreak 1,498 posts
- 14. Drake Maye 21.4K posts
- 15. Judge 205K posts
- 16. Robbed You 4,134 posts
- 17. RIN AOKBAB BEGIN AGAIN 508K posts
- 18. Jalen Johnson 9,200 posts
- 19. GM CT 20.5K posts
- 20. Alignerz 158K posts