#violinplot search results


Can this #violinplot variation be renamed to #fountainnib plots? Violinplot with a log scale on the y axis.


Boxplots within violin plot with faceting and fill R stackoverflow.com/questions/5254… #ggplot2 #facetgrid #violinplot #r #boxplot

ggplot not seperating by value - Violin Plot stackoverflow.com/questions/6554… #dplyr #r #violinplot #tidyr #ggplot2

Restrain scattered jitter points within a violin plot by ggplot2 stackoverflow.com/questions/5106… #ggplot2 #r #violinplot


@_amelie_rocks it looks like we are close to an official approval of #barbapapaplot instead of #violinplot


私はもっぱらこういう使い方ですかね(違) #MATLAB #R2024bPre #violinplot

R2024b prerelease で使えるバイオリンプロットですね! バイオリンプロットがよく使われる分野ってどの辺なんでしょうね(これまであまり出会ったことがない)

Create violin plots, spaceship charts or similar for discrete variables in R using ggplot2 stackoverflow.com/questions/6594… #charts #violinplot #r #ggplot2


Quiero hacer el amor con estos #ViolinPlot Estúpidos y sensuales Q1, Q3 y datos atípicos... Madre mía.


I may not always sleep enough.. but at least I'm efficient! 😴💤 The distribution of my sleep efficiency by hours slept Day 9 : Statistics #30DayChartChallenge #Sleep #ViolinPlot #Distribution #PowerBI #DataViz #DataVisualization


A midway solution is #violinPlot which is getting more popular as it allows for better presentation of data distribution than #boxplots #siop2019


🧬✨ Create beautiful violin plots effortlessly using SRplot – no coding, no scripts, just sleek visualizations in a few clicks. 🚀 Try it now and transform your data today! #ViolinPlot #DataVisualization #NoCodeTools"

Boxplots and violin plots don't agree. I vaguely remember this has something to do with how violin plot source code computes the bounds. Have noticed it in seaborn documentation also. Any inputs/observations? #seaborn #violinplot #boxplot #disagreement #python #dataviz


Evita gráficos de barra y error buff.ly/3Uk1lmd buff.ly/3UoWhwB #boxplot #violinplot #raincloudplot #data #dataviz #datascience


Combining a violin plot & a boxplot for quick data visualisation #plot #R #violinplot #boxplot #Datavisualisation #Modelfitting


I'm gonna have a lecture about data visualization soon tho I don't know how should I describe the "violin plot" without any misunderstanding! #ViolinPlot #DataVisualization


🚨🤔💭 Why do I always have to add a #ViolinPlot on top of a #BoxPlot? 🤯📊🎻 The #BoxPlot already gives a great summary of the distribution, but I love to keep it #Extraordinary! 💥🌟🤩 Don't be afraid to add a little spice to your data visualization! 🔥📈 #Rstats #DataScience…


🧬✨ Create beautiful violin plots effortlessly using SRplot – no coding, no scripts, just sleek visualizations in a few clicks. 🚀 Try it now and transform your data today! #ViolinPlot #DataVisualization #NoCodeTools"
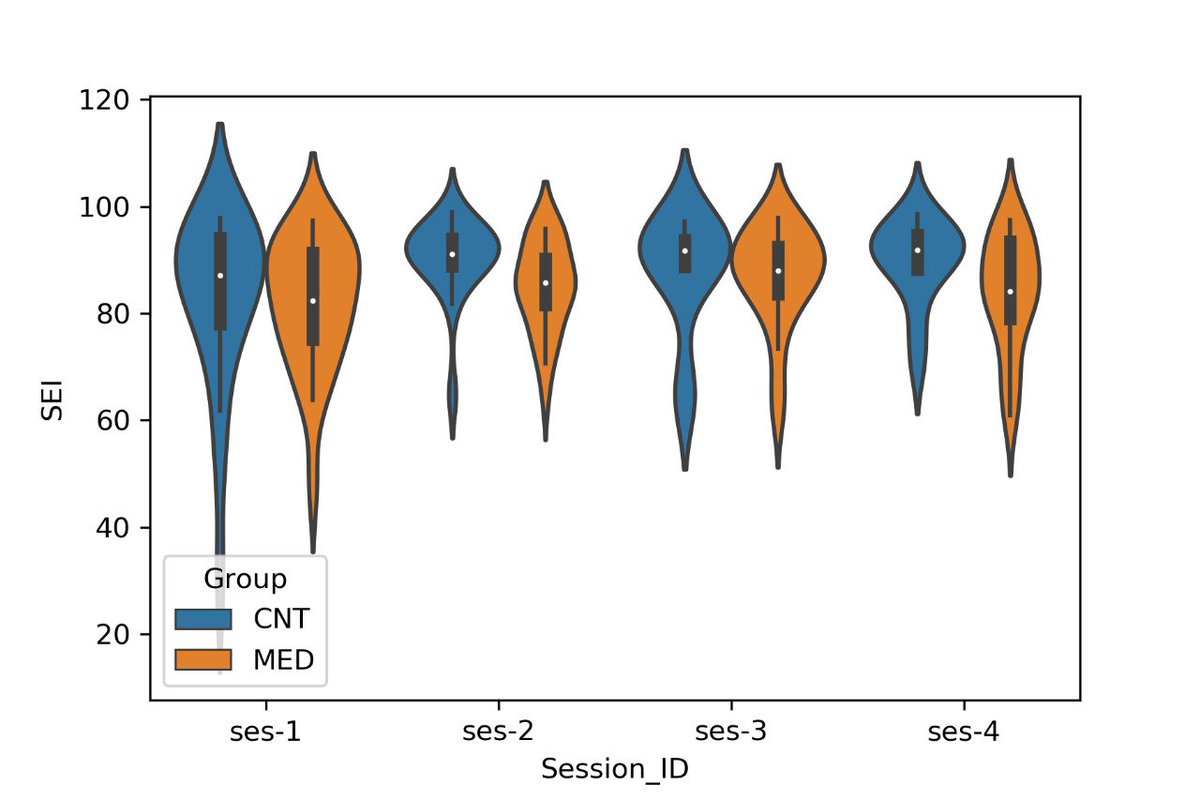
#Seaborn #ViolinPlot #Python I wrote an article titled 'Seaborn Violin Plot with Split:A Complex Visualization for Group Comparison'. ailogsite.netlify.app/2024/10/29/202…
私はもっぱらこういう使い方ですかね(違) #MATLAB #R2024bPre #violinplot
R2024b prerelease で使えるバイオリンプロットですね! バイオリンプロットがよく使われる分野ってどの辺なんでしょうね(これまであまり出会ったことがない)
Quiero hacer el amor con estos #ViolinPlot Estúpidos y sensuales Q1, Q3 y datos atípicos... Madre mía.


DIY violin plot with Highcharts for continuous data set. By @MusMekh Read more here: highcharts.com/blog/tutorials… #violinplot #densityplot #dataviz #datascience #js #a11y


Watching a brilliant talk on resistance in the context of injectable ART from @GerettiAnna - lo & behold! My favourite type of graph....the vulva plot! Violins are SO 2022..... #violinplot #vulvaplot

🚨🤔💭 Why do I always have to add a #ViolinPlot on top of a #BoxPlot? 🤯📊🎻 The #BoxPlot already gives a great summary of the distribution, but I love to keep it #Extraordinary! 💥🌟🤩 Don't be afraid to add a little spice to your data visualization! 🔥📈 #Rstats #DataScience…

6/ Itulah tutorial lengkap tentang bagaimana membuat grafik cantik dengan violin plot di Stata. Selamat mencoba dan semoga bermanfaat! 🌟 #TutorialLengkap #GrafikCantik #ViolinPlot
2/ Sebelum kita mulai membuat grafik, pertama-tama kita perlu memahami apa itu violin plot. Violin plot adalah jenis grafik yang menampilkan distribusi data numerik pada suatu variabel atau beberapa variabel. 📊 #DataNumerik #DistribusiData #ViolinPlot
1/ 📈 Siapa yang tidak suka dengan grafik cantik? Terutama jika grafik tersebut juga memberikan informasi yang berguna. Kali ini kita akan membahas bagaimana membuat grafik cantik dengan menggunakan violin plot di Stata. 🎻 #GrafikCantik #ViolinPlot #Stata

Evita gráficos de barra y error buff.ly/3Uk1lmd buff.ly/3UoWhwB #boxplot #violinplot #raincloudplot #data #dataviz #datascience
@_amelie_rocks it looks like we are close to an official approval of #barbapapaplot instead of #violinplot
Can this #violinplot variation be renamed to #fountainnib plots? Violinplot with a log scale on the y axis.
Boxplots within violin plot with faceting and fill R stackoverflow.com/questions/5254… #ggplot2 #facetgrid #violinplot #r #boxplot
ggplot not seperating by value - Violin Plot stackoverflow.com/questions/6554… #dplyr #r #violinplot #tidyr #ggplot2
Restrain scattered jitter points within a violin plot by ggplot2 stackoverflow.com/questions/5106… #ggplot2 #r #violinplot
Create violin plots, spaceship charts or similar for discrete variables in R using ggplot2 stackoverflow.com/questions/6594… #charts #violinplot #r #ggplot2
A midway solution is #violinPlot which is getting more popular as it allows for better presentation of data distribution than #boxplots #siop2019
Evita gráficos de barra y error buff.ly/3Uk1lmd buff.ly/3UoWhwB #boxplot #violinplot #raincloudplot #data #dataviz #datascience
Boxplots and violin plots don't agree. I vaguely remember this has something to do with how violin plot source code computes the bounds. Have noticed it in seaborn documentation also. Any inputs/observations? #seaborn #violinplot #boxplot #disagreement #python #dataviz

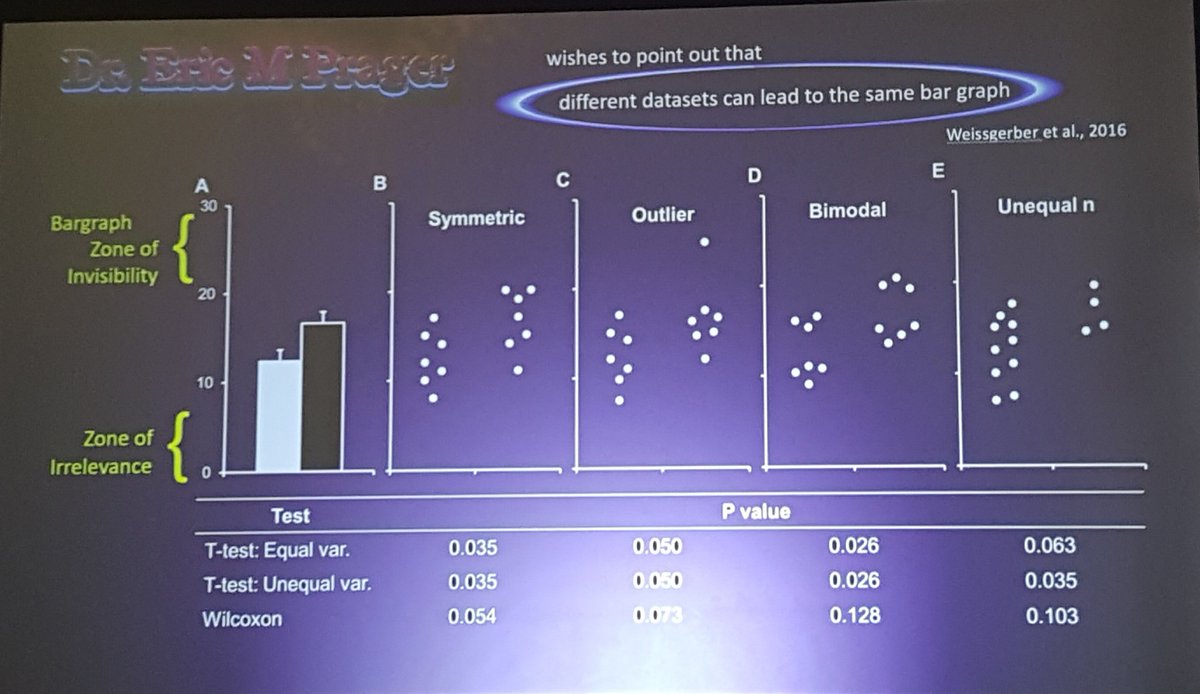
Why NOT to use "dynamite plots"! Four different sets if data look identical when plotted with bar graphs! #boxplot #violinplot #statistics #DrDavidMcArthur #UCNT2019 @Neuroscience @BIRC_at_UCLA @dgsomucla @UCLAHealth @BRI_UCLA @PublicHealth @DOAJplus @OpenAccess
Combining a violin plot & a boxplot for quick data visualisation #plot #R #violinplot #boxplot #Datavisualisation #Modelfitting
Quiero hacer el amor con estos #ViolinPlot Estúpidos y sensuales Q1, Q3 y datos atípicos... Madre mía.

Tweet about how a violin plot can help visualize data more clearly in R. #DataViz #Rstats #violinplot #dataviz #rstats #visualization #visualize

I may not always sleep enough.. but at least I'm efficient! 😴💤 The distribution of my sleep efficiency by hours slept Day 9 : Statistics #30DayChartChallenge #Sleep #ViolinPlot #Distribution #PowerBI #DataViz #DataVisualization
I'm gonna have a lecture about data visualization soon tho I don't know how should I describe the "violin plot" without any misunderstanding! #ViolinPlot #DataVisualization
🚨🤔💭 Why do I always have to add a #ViolinPlot on top of a #BoxPlot? 🤯📊🎻 The #BoxPlot already gives a great summary of the distribution, but I love to keep it #Extraordinary! 💥🌟🤩 Don't be afraid to add a little spice to your data visualization! 🔥📈 #Rstats #DataScience…
Something went wrong.
Something went wrong.
United States Trends
- 1. Northern Lights 44.1K posts
- 2. #Aurora 9,246 posts
- 3. #DWTS 52.8K posts
- 4. #RHOSLC 7,055 posts
- 5. Sabonis 6,214 posts
- 6. H-1B 33.8K posts
- 7. AI-driven Web3 1,031 posts
- 8. Justin Edwards 2,432 posts
- 9. #GoAvsGo 1,561 posts
- 10. Gonzaga 2,966 posts
- 11. #MakeOffer 8,886 posts
- 12. Louisville 18K posts
- 13. Creighton 2,283 posts
- 14. Eubanks N/A
- 15. Lowe 12.8K posts
- 16. Jamal Murray N/A
- 17. Schroder N/A
- 18. Andy 60.6K posts
- 19. JT Toppin N/A
- 20. Cleto 2,480 posts