#visualizedata 搜尋結果

Thanks SPS Department of Tech Services for your work with SPS Student Services on the Atlas Report Center. #SPSConnects #Dots #VisualizeData


Happy #InternationalDayOfMathematics! Math makes the world go round... and it certainly keeps our world spinning at @throughlineinc! 🌎 Without math, there are no algorithms, and without algorithms, there's no AI... and without this innovative tech, how would we #VisualizeData?


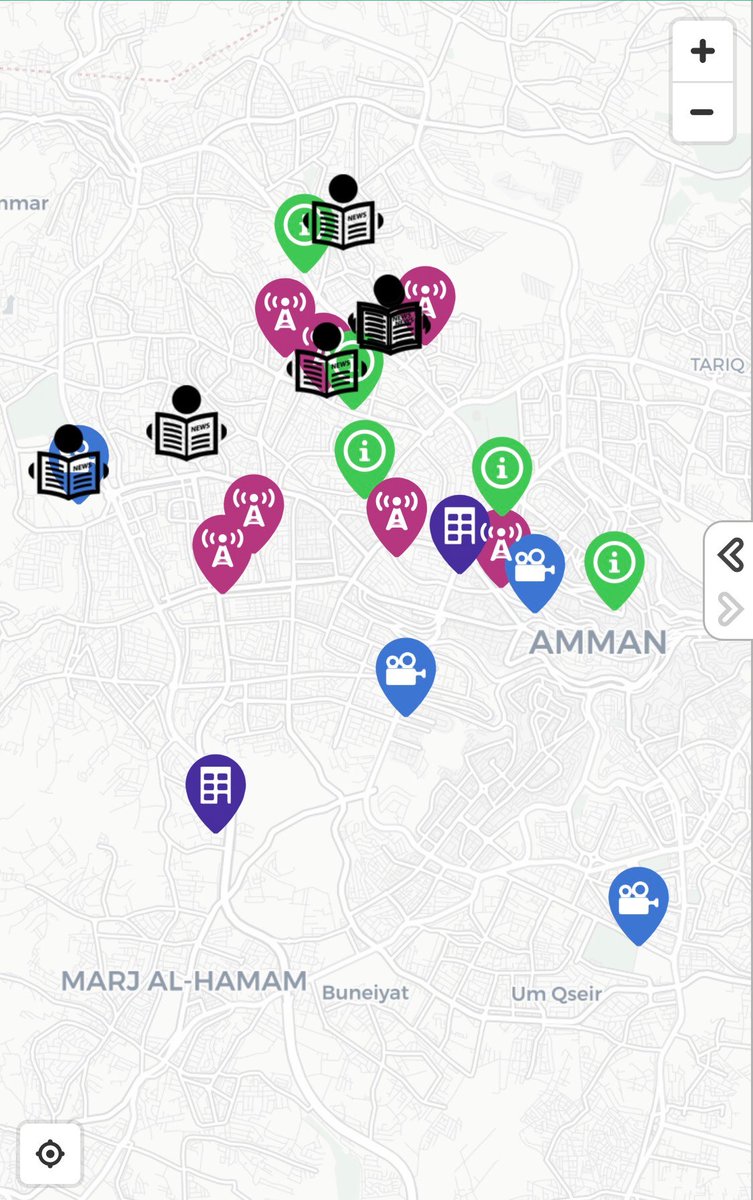
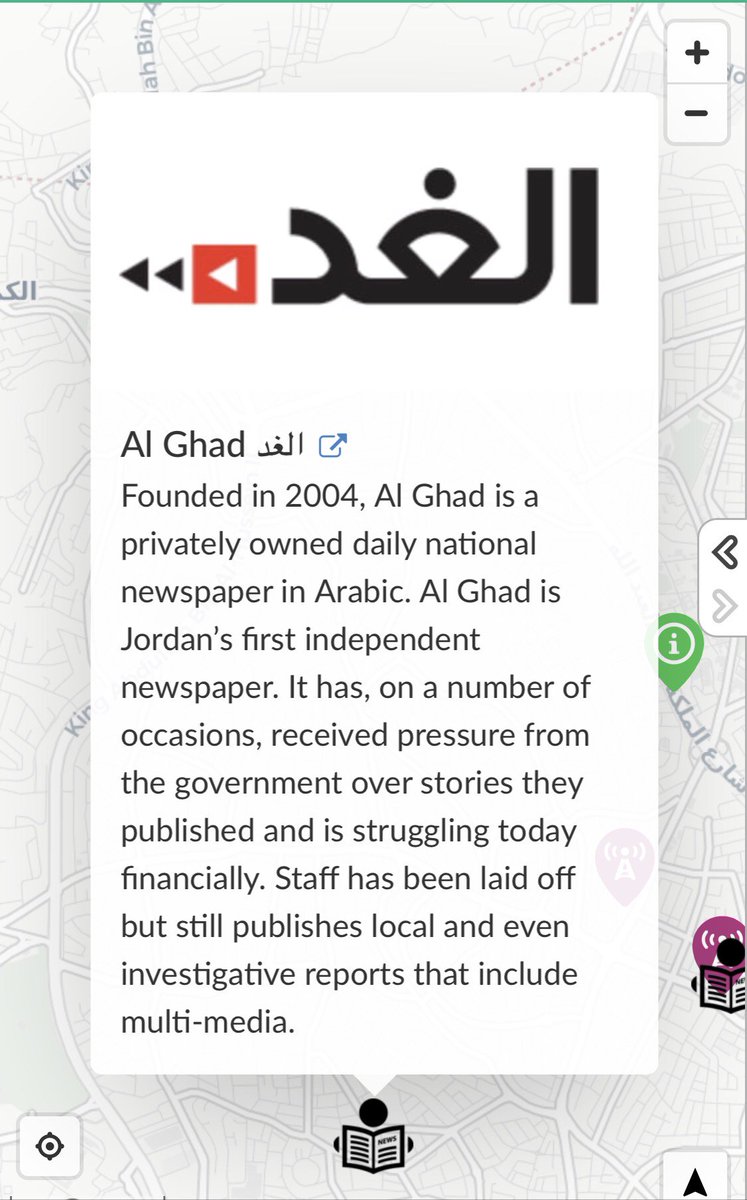
#InteractiveMaps #VisualizeData, locations and bring information to life. We present our latest creation, shedding light on the #media landscape in #Jordan maphub.net/Wishbox-Media/… #Maps #MiddleEast #Journalism #Press #SundayThoughts #pressfreedom #Journalism #SundayMorning #JO

How we partnered with the Yale School of Medicine’s Center for Outcomes Research & Evaluation (CORE) to #visualizedata📈 and communicate #healthcare👩⚕️ outcomes on a national level. Learn more about our work: bit.ly/3zGfqid


Transform data into insights with our powerful Data Visualization services. From complex datasets to impactful visuals, we make information understandable and decisions informed. Elevate your analytics game! #DataVisualization #VisualizeData #DataInsights #VisualAnalytics

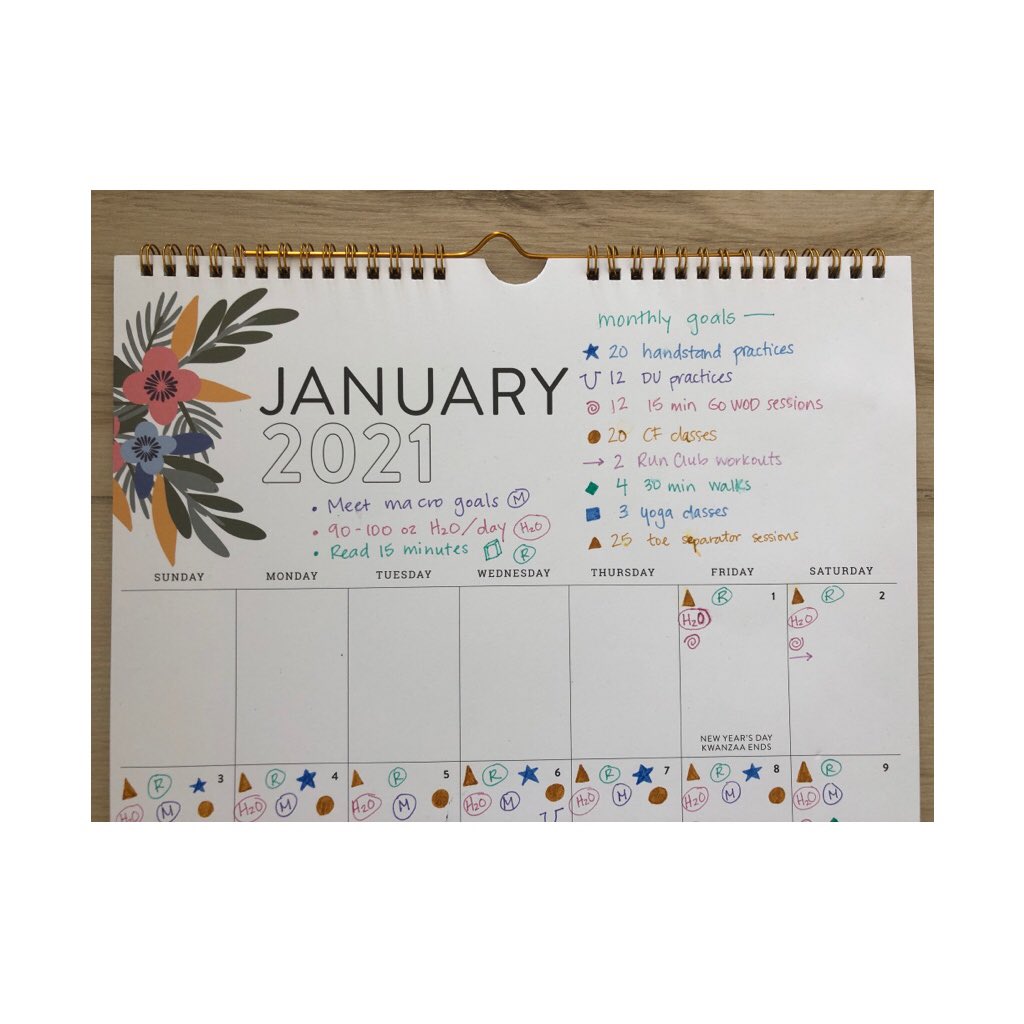
Finally did some visual data tracking for myself throughout January. Have always been interested in this and was inspired by @klbeasley years ago to get this super cool book. Almost by accident I ended up with a solid set of accomplishments this month. #deardata #visualizedata


The enrichment students from @mszimmersclass have been trying out a simple method of visual data tracking over the past week, using some things they try to do regularly. @DAAElementary #visualizedata


📊 Want to master data storytelling? Join our hands-on workshop by Rasagy Sharma! Become a data ninja, no laptops needed—just pen, paper, and your creative vibe! 🚀✨ #DataNinja #VisualizeData #HandsOnWorkshop #makemytrip #paytm #goibibo #redbus #uxdesign #uxnow


Share your thoughts, experiences, and success stories of data storytelling in the comments below. #DataStorytelling #PowerOfData #VisualizeData #TellingStories #DataDrivenInsights #DataNarratives

Infographics simplify complex info, boost brand authority. Ideal for stats, processes, and trends. Share on social media for visibility. #VisualizeData #InfographicMarketing #ShareableContent #IndustryInsights


Visual design is a universal language that can help you do just that - connect the dots between important marketing data points and business conclusions that everyone sitting in that presentation can follow. #visualizedata #data #design #visualdesign #visualdata #powerpoint


Data Analytics Tools Comparison: Python vs R vs SQL rb.gy/wytk9 #DataAnalyticsTools #DataAnalytics #VisualizeData #PythonvsRvsSQL #DataAnalyisSoftware #IW #IWNews #IndustryWired


Silverdaft and VARJO have teamed up to offer a bundle that empowers you for enterprise level VR. Architected for immersive workflows. Get Started TODAY! bit.ly/3cQLHqT @varjodotcom #VR #visualizedata #createwithclarity #seeingisbelieving


I am so proud to work with @bplibrarian and @LauraBFogle in @NCStateCEDMETRC - AND I have the privilege of presenting with them @iste in Philly this year!! #ARVRinEDU #visualizedata #ISTE19


Observability is the ability to understand a system's internal state by analyzing its external outputs, such as logs, metrics, and traces. Read more 👉 lttr.ai/AajCR #IngestLogs #VisualizeData #Observability #Docker

We help companies visualize their data. See things in a whole new light. See things before they are physical and real. See what is possible…... #silverdraftsolutions #visualizedata #AnythingIsPossible

Technology can accelerate your creativity, your vision, your expression. At Silverdraft that's what we do…...we empower you to bring your vision to life. #visualizedata #immersiveworkflows #creativetech #design

You have set up OpenSearch and Data Prepper to ingest and visualize logs in less than 10 minutes. Read the full article: Mastering Observability in 10 Minutes Using OpenSearch ▸ lttr.ai/AajB0 #IngestLogs #VisualizeData #Observability #Docker

Silverdraft enables #AEC companies to visualize and interact with their data so that design flaws can be resolved before you even move a piece of dirt. #visualizedata #designworkflow


🌟 Visualize the Flow: Introducing the Sankey for SankeyMaster! 📊✨ Transform complex data into stunning Sankey diagrams effortlessly with SankeyMaster. #DataVisualization #SankeyCharts #VisualizeData #sankeymaster #sankey 👉apps.apple.com/app/apple-stor…


Infografix - the free AI infographics generator ✨ Use pre-loaded template options to instantly visualize data in alternative ways 😊 Try out a template ➡️ infografix.app #Infografix #AIInfographicsGenerator #VisualizeData #InfographicTemplates

Gain instant clarity from your data with our new Chart View 📊 This powerful feature makes your board come alive, turning complex numbers into actionable insights. Find out more: cake.com/updates/chart-… #ChartView #DataMadeEasy #VisualizeData


📈 Dive into data with precision! From Bar to Line, Stacked Areas to Polar Bars and beyond 🌠 #VisualizeData - Bar: Compare easily 🏧 - Line: Track changes #chartstudio 👉apps.apple.com/app/apple-stor…


Word clouds look good but can mislead decisions if used wrong. Learn how to make word clouds that show real insights and support better outcomes. #DataVisualization #VisualizeData #TextVisualization #VisualAnalytics #DataViz #StoryWithData #WordCloud chartexpo.com/blog/word-cloud
chartexpo.com
Word Cloud: A Visual Everyone Uses, and Often Misuses -
Word clouds look good but can mislead decisions if used wrong. Learn how to make word clouds that show real insights and support better outcomes.
Poor data visualization leads to wrong calls and missed chances. Want visuals that guide, not confuse? See how clarity drives better business moves—read on! #DataVisualization #VisualizeData #InformationDesign #VisualAnalytics #DataViz #StoryWithData chartexpo.com/blog/data-visu…


📊 Elevate Your Data Game with These Top 5 FREE Visualization Tools! 🚀✨ We are proud to have expertise in these tools that can help you create wonders in no time! 🎨📈 #DataVisualization 📊 #AnalyticsTools 🔍 #VisualizeData 🎨 #DataDrivenResults 📈 #MetaSenseMarketing 🚀

Observability is the ability to understand a system's internal state by analyzing its external outputs, such as logs, metrics, and traces. Read more 👉 lttr.ai/AajCR #IngestLogs #VisualizeData #Observability #Docker
Data Prepper is an open-source tool for ingesting logs, metrics, and traces to OpenSearch. Read more 👉 lttr.ai/AajCH #IngestLogs #VisualizeData #Observability #Docker

🌟 Sankey mastery unveiled! 📊 Discover the art of Sankey charts, a dynamic tool for analyzing complex flow data. #DataViz #SankeyMaster #VisualizeData ✨ Transform your data storytelling with these #sankeymaster #sankey 👉apps.apple.com/app/sankeymast…

Mastering Observability in 10 Minutes Using OpenSearch ▸ lttr.ai/AajB3 #IngestLogs #VisualizeData #Observability #Docker

You have set up OpenSearch and Data Prepper to ingest and visualize logs in less than 10 minutes. Read the full article: Mastering Observability in 10 Minutes Using OpenSearch ▸ lttr.ai/AajB0 #IngestLogs #VisualizeData #Observability #Docker
📊 From bar graphs to sunburst charts: Dive into the world of visual data! 🌟 Explore the array of infographics: line charts, pie charts, organ charts, & more! #DataViz #VisualizeData #chartstudio 👉chartstudio.top
📊🎨 Unveil the secrets behind data visualization! From bar charts that break down trends to sunburst charts that reveal nested insights, explore the art of data storytelling. 🌟 #VisualizeData # #chartstudio 👉apps.apple.com/app/chartstudi…

🏆 Visualize Success with Spinify + #SQL! Bring your SQL data to life! Spinify turns abstract numbers into visual success stories, displaying achievements and milestones directly from your databases on engaging, dynamic leaderboards. #VisualizeData #SQLGamification


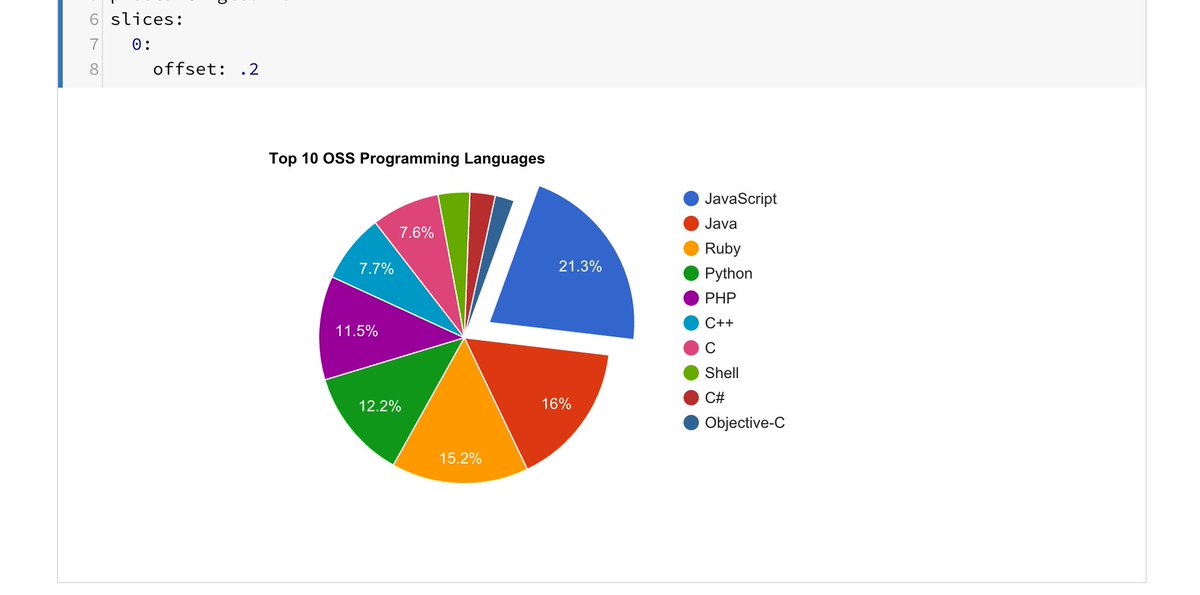
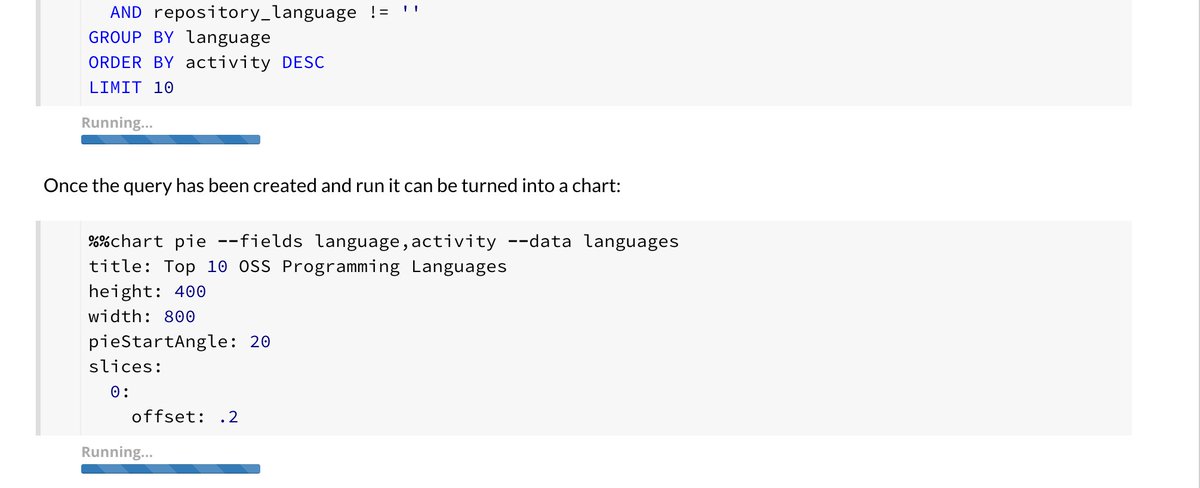
Premier test de google cloud datalab #visualizeData, a tester la facilité (ou pas) de créer des notebook #bigquery


#InteractiveMaps #VisualizeData, locations and bring information to life. We present our latest creation, shedding light on the #media landscape in #Jordan maphub.net/Wishbox-Media/… #Maps #MiddleEast #Journalism #Press #SundayThoughts #pressfreedom #Journalism #SundayMorning #JO
How we partnered with the Yale School of Medicine’s Center for Outcomes Research & Evaluation (CORE) to #visualizedata📈 and communicate #healthcare👩⚕️ outcomes on a national level. Learn more about our work: bit.ly/3zGfqid


Thanks SPS Department of Tech Services for your work with SPS Student Services on the Atlas Report Center. #SPSConnects #Dots #VisualizeData
Dive into Data Visualization with our expert services. We transform intricate data into clear visuals, empowering you to grasp insights effortlessly. Enhance your decision-making process now. #DataVisualization #VisualizeData #DataInsights #VisualAnalytics #DataDrivenDecisions

Harness the power of data with our robust Data Visualization services. From intricate datasets to compelling visuals, we translate information into understanding and empower informed decision-making. #DataVisualization #VisualizeData #DataInsights #VisualAnalytics

Transform data into insights with our powerful Data Visualization services. From complex datasets to impactful visuals, we make information understandable and decisions informed. Elevate your analytics game! #DataVisualization #VisualizeData #DataInsights #VisualAnalytics
📊 Want to master data storytelling? Join our hands-on workshop by Rasagy Sharma! Become a data ninja, no laptops needed—just pen, paper, and your creative vibe! 🚀✨ #DataNinja #VisualizeData #HandsOnWorkshop #makemytrip #paytm #goibibo #redbus #uxdesign #uxnow
Happy #InternationalDayOfMathematics! Math makes the world go round... and it certainly keeps our world spinning at @throughlineinc! 🌎 Without math, there are no algorithms, and without algorithms, there's no AI... and without this innovative tech, how would we #VisualizeData?


Data Analytics Tools Comparison: Python vs R vs SQL rb.gy/wytk9 #DataAnalyticsTools #DataAnalytics #VisualizeData #PythonvsRvsSQL #DataAnalyisSoftware #IW #IWNews #IndustryWired

#Google is launching two tech-powered tools for reporters. It also includes two advanced tools to search for large documents and #visualizedata. More: onpassive.com/blog/onpassive/ #OnPassive #ArtificialIntelligenceTechnology #GoogleLaunchesTools2020 #AITools2020 #JournalistStudio

Something went wrong.
Something went wrong.
United States Trends
- 1. Dodgers 647K posts
- 2. #WorldSeries 314K posts
- 3. Yamamoto 200K posts
- 4. Blue Jays 144K posts
- 5. Will Smith 47K posts
- 6. Miguel Rojas 40.1K posts
- 7. Kershaw 31K posts
- 8. Yankees 15.1K posts
- 9. Baseball 158K posts
- 10. Dave Roberts 12.5K posts
- 11. Kendrick 16.5K posts
- 12. Vladdy 21.4K posts
- 13. Ohtani 84.1K posts
- 14. #Worlds2025 26.7K posts
- 15. Jeff Hoffman 3,539 posts
- 16. Nike 35.2K posts
- 17. Auburn 14.2K posts
- 18. Cubs 7,488 posts
- 19. Miggy 8,184 posts
- 20. Phillies 3,487 posts