
Consolidation Ahead? biber-analytics-crypto.com/p/consolidatio…
Crypto Health biber-analytics-crypto.com/p/crypto-health
Bitcoin Cycles: Short-Term and Long-Term biber-analytics-crypto.com/p/bitcoin-cycl…
November Cycle Review biber-analytics-cockpit.com/p/november-cyc…
Harnessing Cycle Analysis to Pinpoint Key Trading Opportunities biber-analytics-free.com/p/harnessing-c…
Emerging Power: Unraveling the Surge in Chinese Stocks biber-analytics-free.com/p/emerging-pow…
Navigating New Heights: A Technical Look at the S biber-analytics-free.com/p/navigating-n…
Crude Oil Forecast: Navigating Through Market Cycles biber-analytics-free.com/p/crude-oil-fo…
Golden Opportunities: Navigating the Surge biber-analytics-free.com/p/golden-oppor…

Why Did We Buy Tesla Before That Massive Price Move? Read the full article: Tesla: The Poster Child of Electric Vehicle Innovation (biber-analytics-free.com)
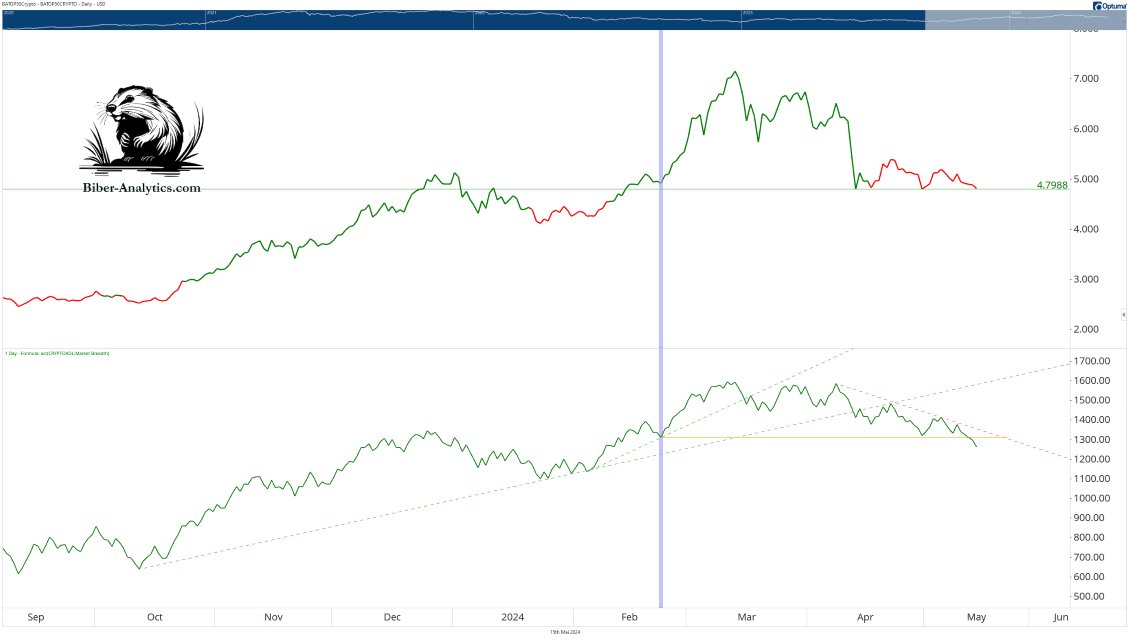

Chart shows Bitcoin vs. its volume-weighted moving average since ETF launch—tracking ETF holder buy prices. Notable daily inflows peaked at $500-1000M in early March, then sharply declined by April end. With recent investors 10% down, will they sell off or hold long-term?

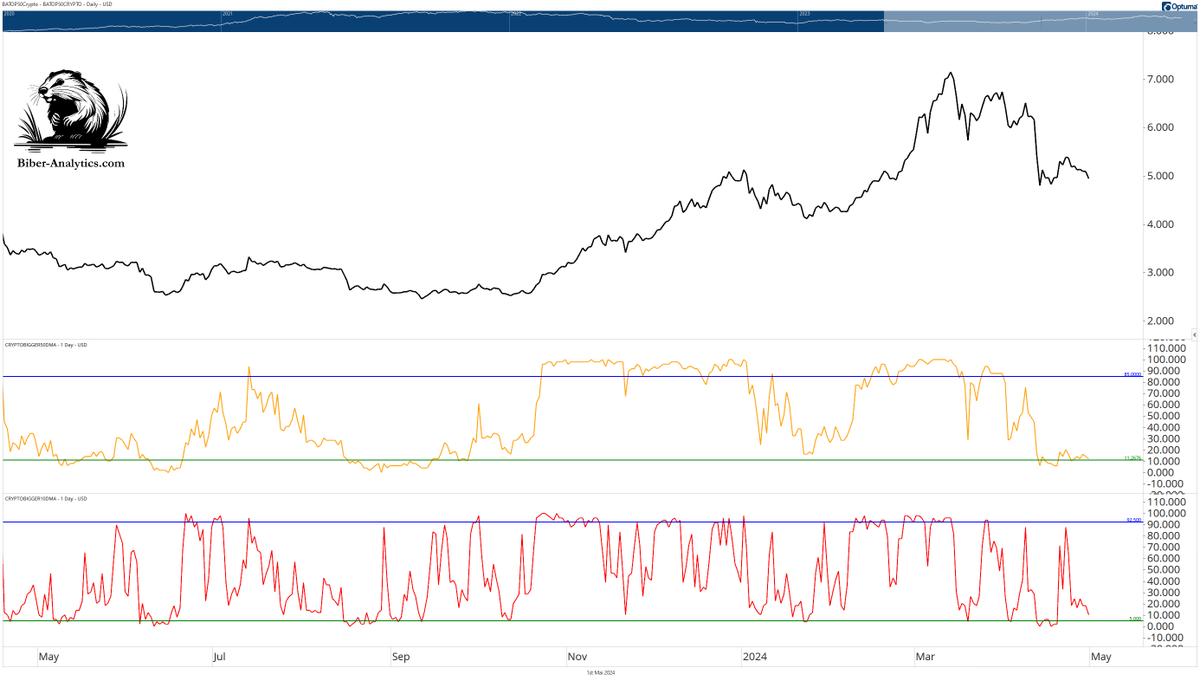
Chart shows coins above 50-day & 10-day moving averages nearing a green line, signaling a potential short-term bottom. Is it really the bottom or the start of a bear market? I use a longer moving average to distinguish. biber-analytics-free.com/subscribe
The tide has turned! Selloff expected! linkedin.com/pulse/selloff-…
linkedin.com
Selloff Expected
I expect a selloff, but how severe will it be? The charts in the current Cockpit Newsletter give us an indication of where the market is headed. The following chart shows the S&P 500.
The hidden risk in today's market: linkedin.com/pulse/clouds-h…
linkedin.com
Clouds on The Horizon
Regional banks are more sensitive to worsening business conditions. The chart below shows the ratio of the broad financials versus the regional banks.
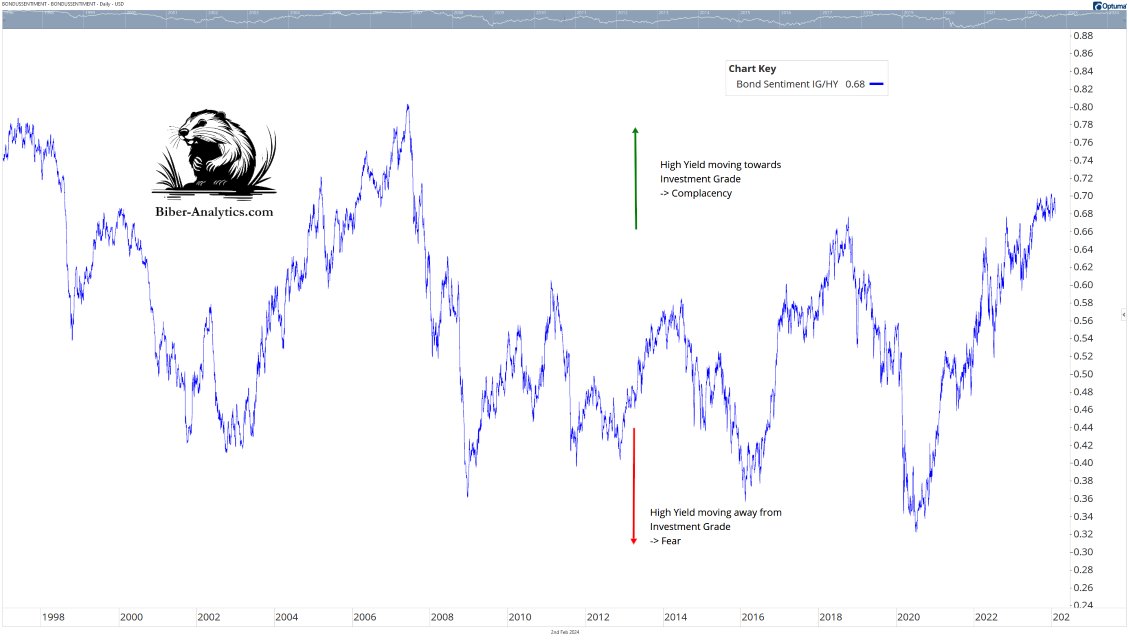
This action-based indicator offers a clearer view of market sentiment than traditional surveys, guiding smarter financial decisions


United States Trends
- 1. Bondi N/A
- 2. #AEWDynamite N/A
- 3. Sam Merrill N/A
- 4. James Van Der Beek N/A
- 5. Dawson N/A
- 6. Massie N/A
- 7. Bates N/A
- 8. #TheMaskedSinger N/A
- 9. SAVE America Act N/A
- 10. Swerve N/A
- 11. Arike N/A
- 12. Culver City N/A
- 13. Varsity Blues N/A
- 14. Sochan N/A
- 15. The Dow N/A
- 16. Kenny Omega N/A
- 17. Paul Reed N/A
- 18. #Unrivaled N/A
- 19. Attorney General N/A
- 20. Diablo 2 N/A
Something went wrong.
Something went wrong.