
#Bitcoin chArtist
@BitcoinChart
I make Bitcoin charts to help you navigate the Bitcoin market. Follow me for statistics-based models and signals.


#Bitcoin 50MARP Indicator is at 208.0% (Hold) Below 0%: All In 0-25%: Strong Buy 25-50%: Buy 50-300%: Hold Above 300%: At Risk

#Bitcoin Normalized Puell Multiple is at 3.3094 (High Risk) Below 0.6: Strong Buy 0.6 - 5: Neutral / Hold Above 5: High Risk

#Bitcoin Bottom to Top Bull Market UPDATE - Day 912 Bitcoin is up +576.2% since the previous cycle bottom of $15,780 on Nov 21, 2022. Day 912 ROI in Previous 4 cycles: Dec 2018 - Nov 2021: +1,104.6% Jan 2015 - Dec 2017: +1,145.2% Nov 2011 - Dec 2013: +56,054.6% Jul 2010 - Jun…

#Bitcoin Fear & Greed Index is at Greed (71) Yesterday: Greed (74) 1 Week Ago: Greed (70) 1 Month Ago: Fear (37)

#Bitcoin Bubble Risk Level is 67.5%. Evaluation: HOLD 0-20: No Risk 20-40: Low 40-60: Neutral 60-80: Moderate 80-100: Bubble Danger

#Bitcoin Equilibrium Value vs Spot Equilibrium: $79,896 Spot Price: $106,700 Overvalued by 33.5% Evaluation: HOLD

#Bitcoin MAY UPDATE Bitcoin is up 10.54% this May, or 3.65% above 8-Year Month-to-Date (MTD) Average ROI of 6.90%. May 20 MTD ROI in the previous 4 years: 2024: 22.34% 2023: -3.47% 2022: -24.00% 2021: -30.11%

#Bitcoin Top To Top Cycles UPDATE - Day 1,290 Bitcoin is up +58.1% since the previous cycle ATH of $67,500 on Nov 8, 2021. Day 1,290 ROI in Previous 3 cycles: 2017 - 2021: +77.3% 2013 - 2017: +118.9% 2011 - 2013: +3,789.1%

Has anyone ever seen this guy make a right call on ANYTHING? 😁

Bitcoin was $16,000 when Peter Zeihan said it had no intrinsic value and was worth -$1,000 It’s now $109,000 - Most successful etf launch ever - Sovereign wealth funds are buying - Strategic Bitcoin Reserves taking off
We're likely to land 12-14x from market bottom closer to year-end $175-225k market top


#Bitcoin Havling Cycles UPDATE - Day 396 Bitcoin is up 64.3% since the halving from $64,931 on Apr 20, 2024. Day 396 ROI in the previous 3 halving cycles: May 11, 2020 - Jun 11, 2021: +332.9% Jul 9, 2016 - Aug 9, 2017: +414.0% Nov 28, 2012 - Dec 29, 2013: +5,937.7%

#Bitcoin Q2 UPDATE Bitcoin is up 25.25% in Q2 2025, or 4.02% above 8-Year Quarter-to-Date (QTD) Average ROI of 21.23%. QTD ROI for Day 50 of Q2 in the previous 4 years: 2024: 2.50% 2023: -4.76% 2022: -36.77% 2021: -31.26%


Must watch

The #Bitcoin halving was exactly 12 months ago. I gave this presentation at MIT the day after the halving... Explaining why it would take 12 months before Bitcoin's price really starts to run. That time is finally arriving. Buckle up!
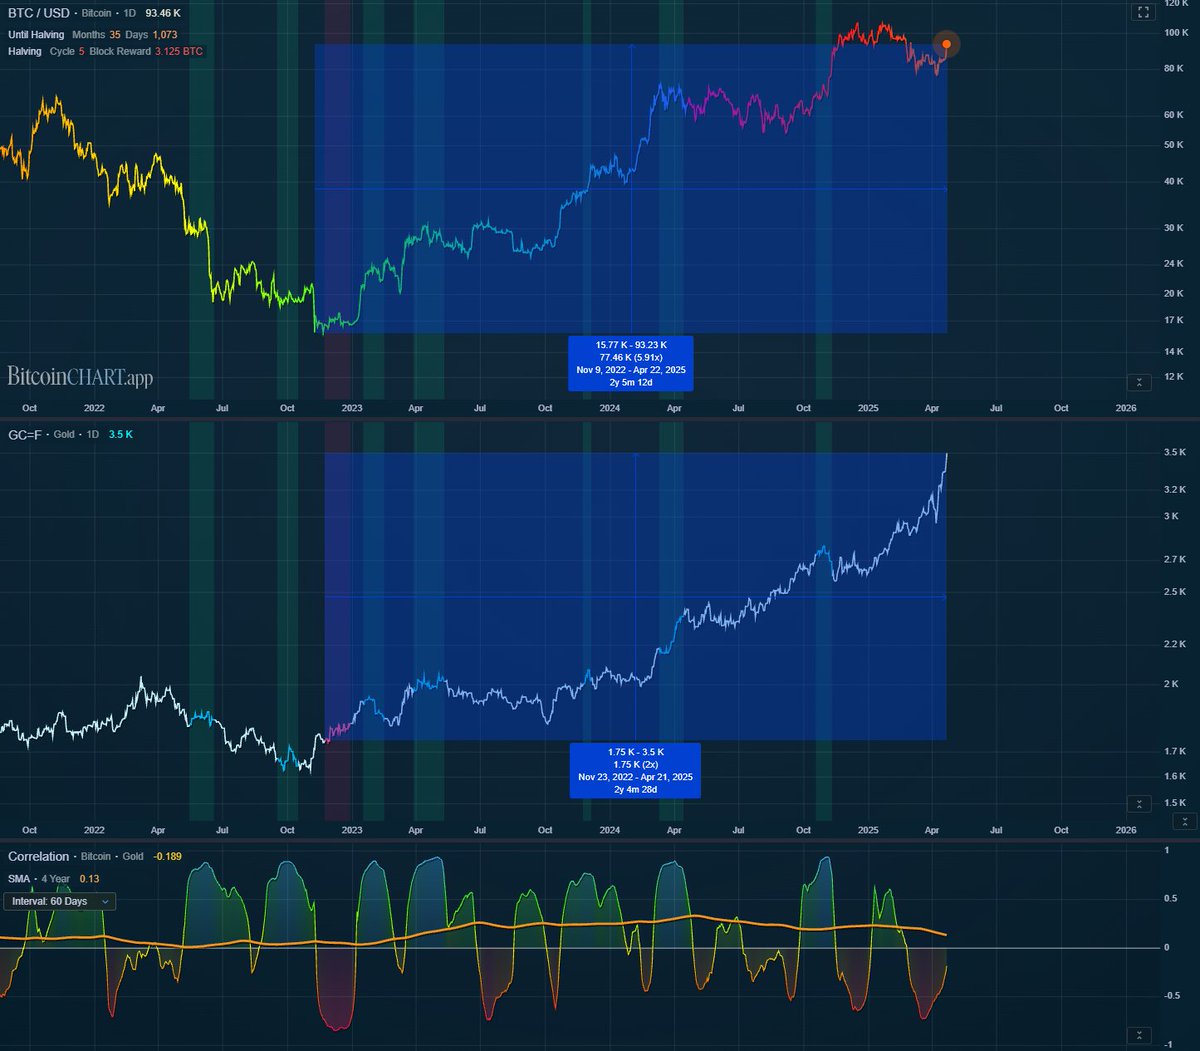
BITCOIN vs GOLD Nov'22 - NOW Bitcoin: $15.7k -> $93.2k = 6X Gold: $1.75k -> $3.5k = 2X I don't want to hear from those dimwits like @PeterSchiff, who are suggesting Gold is outperforming Bitcoin LINK: bitcoinchart.app/bitcoin/gold-c…


United States Trends
- 1. $BNKK 1,002 posts
- 2. Pond 207K posts
- 3. #MondayMotivation 38.2K posts
- 4. Happy 250th 6,249 posts
- 5. $LMT $450.50 Lockheed F-35 1,109 posts
- 6. Good Monday 43.1K posts
- 7. Go Birds 4,522 posts
- 8. Semper Fi 5,871 posts
- 9. $SENS $0.70 Senseonics CGM 1,126 posts
- 10. $APDN $0.20 Applied DNA 1,101 posts
- 11. Obamacare 217K posts
- 12. Victory Monday 2,220 posts
- 13. Rudy Giuliani 27.6K posts
- 14. Edmund Fitzgerald 5,120 posts
- 15. #Talus_Labs N/A
- 16. #SoloLaUniónNosHaráLibres 1,983 posts
- 17. #MondayVibes 2,961 posts
- 18. #USMC 1,040 posts
- 19. Devil Dogs 1,680 posts
- 20. Veterans Day 21.2K posts
Something went wrong.
Something went wrong.