BizDiagram
@BizDiagram
Business Diagrams, Frameworks, Charts and Approaches to help run your businesses
You might like


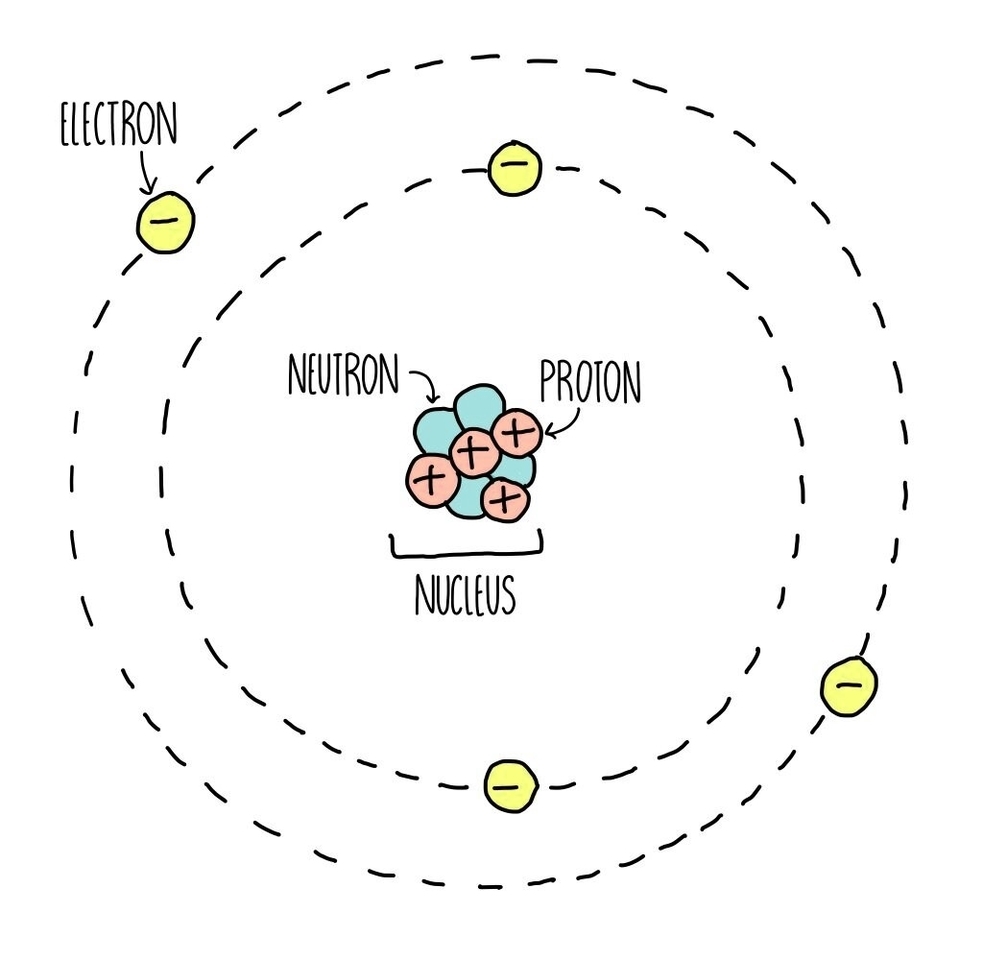
Atomic Structure - chartdiagram.com/atomic-structu… Atomic Structure: Atomic structure refers to the arrangement of subatomic particlesprotons, neutrons, and electronswithin an atom, determining the atom's chemical properties and behavior.
Cameroon GDP per capita - chartdiagram.com/cameroon-gdp-p… This chart demonstrates Cameroon GDP per capita. World Bank is the source of this economic data. Latest GDP per person information for Cameroon.

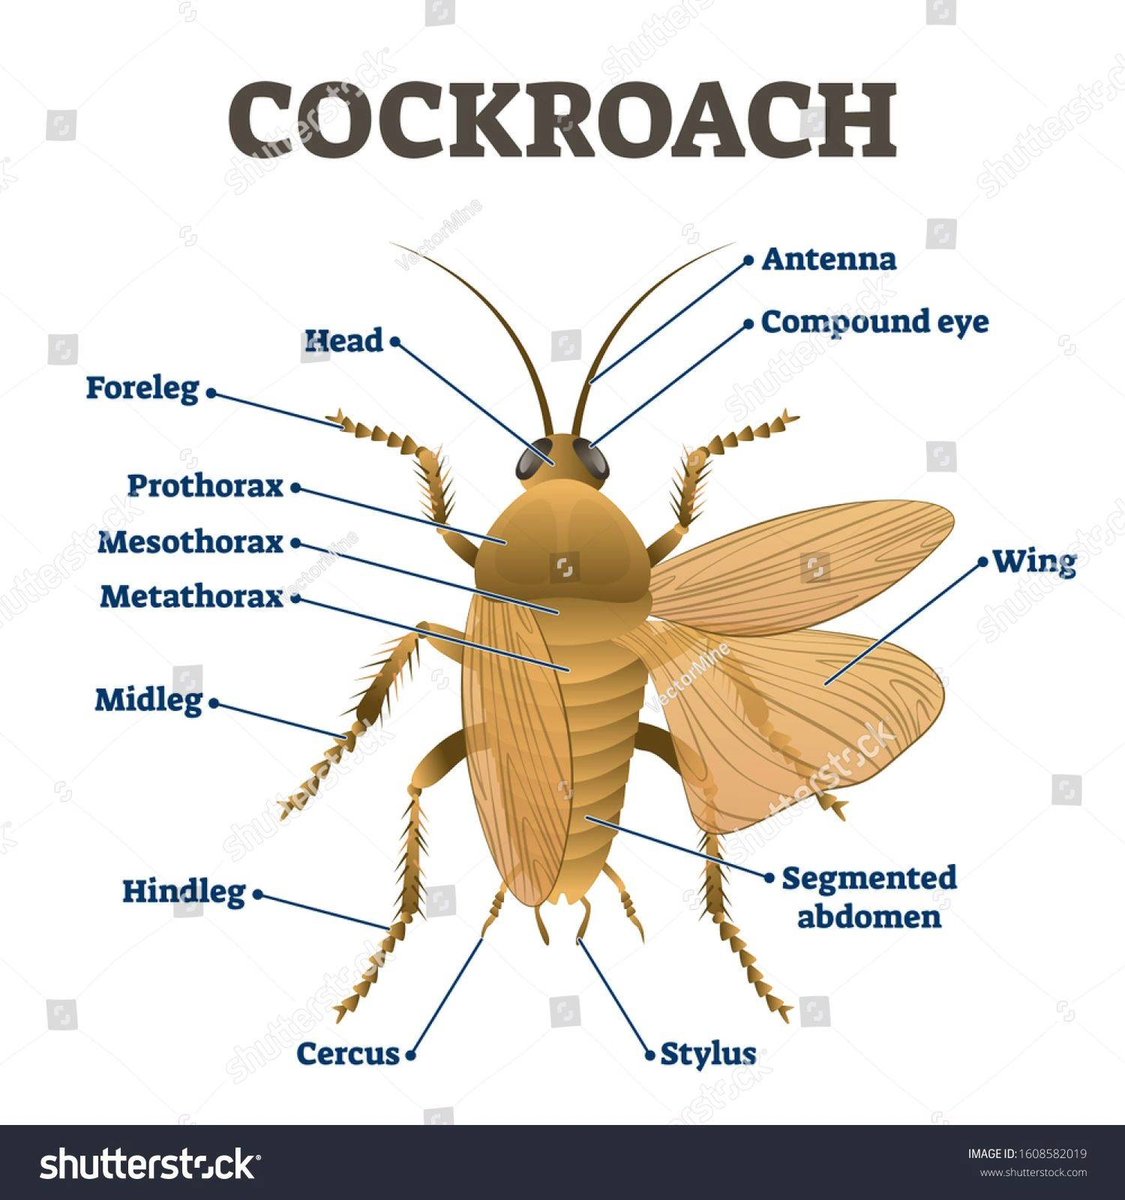
Parts Of A Cockroach - chartdiagram.com/parts-of-a-coc… Parts Of A Cockroach: Parts of a cockroach include the head, thorax, and abdomen, with specialized structures like antennae, compound eyes, and wings for survival in various environments.
Euro area GDP per capita - chartdiagram.com/euro-area-gdp-… This diagram presents Euro area GDP per capita. This is according to World Bank GDP stats by country. Based on the latest economic info provided for Euro area.

Sales Strategy Presentation - chartdiagram.com/sales-strategy… Sales strategy presentation: A sales strategy presentation outlines the approach a company will take to achieve its sales goals. It includes market analysis, target audience identification, sales tactics, and performance m...

Types Of Kpi Indicators - chartdiagram.com/types-of-kpi-i… Types Of KPI Indicators: KPI indicators, or Key Performance Indicators, are metrics used to measure performance against objectives. They include financial KPIs, customer KPIs, process KPIs, and employee KPIs.


Project Controls System Process - chartdiagram.com/project-contro… Project Controls System Process: A project controls system diagram outlines the methods and tools used to monitor and control project performance, including cost estimation, scheduling, risk management, and change cont...

Business Capabilities Model Clarified - chartdiagram.com/business-capab… Business Capabilities Model Clarified: A business capabilities model outlines the essential functions and processes that a business must perform to achieve its objectives. It clarifies the core competencies, reso...

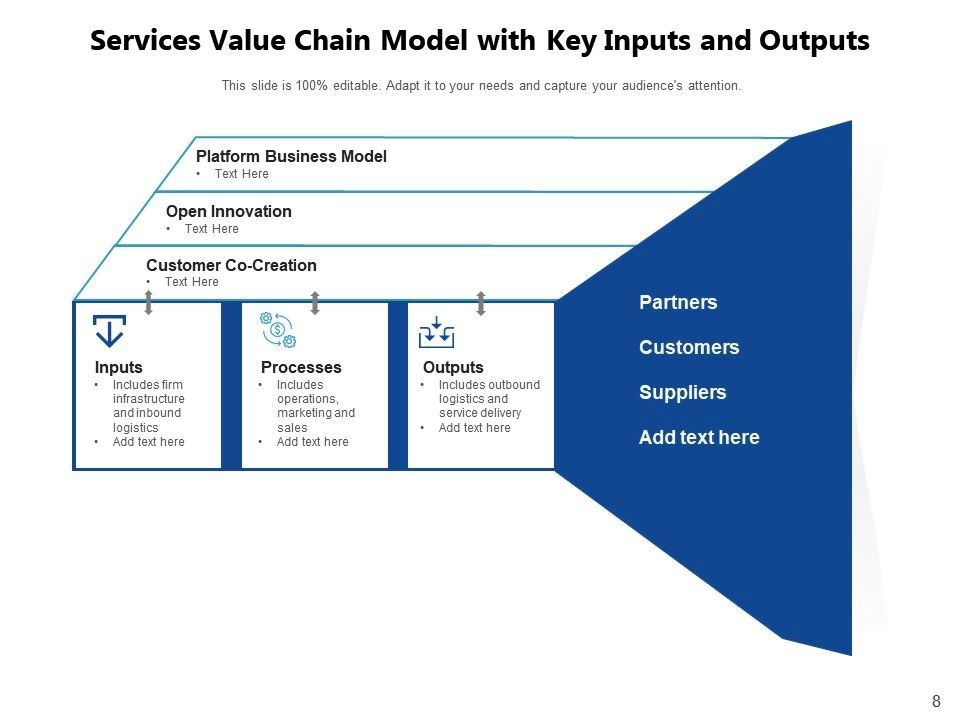
Services Value Chain Analysis - chartdiagram.com/services-value… Services Value Chain Analysis: This model adapts Michael Porters value chain to the service industry, mapping key activities that add value to customersfrom service design and delivery to after-sales support. It helps ...
Lesson Planning - chartdiagram.com/lesson-plannin… Lesson Planning: Lesson planning is a structured approach to organizing and delivering educational content. It involves outlining learning objectives, choosing appropriate teaching methods, and determining the resources needed to faci...

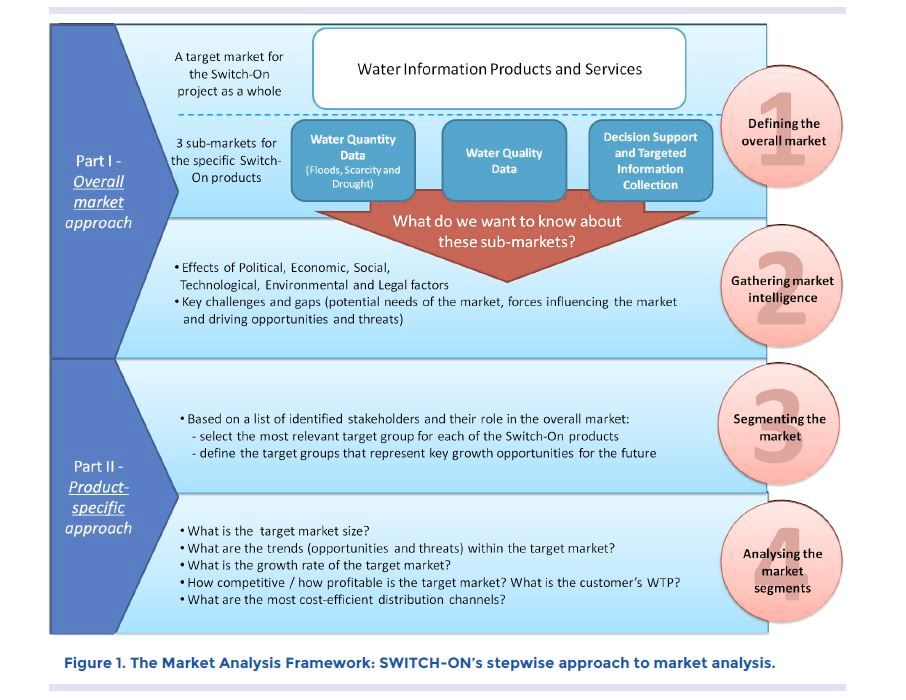
The Switch on Market Analysis Framework - chartdiagram.com/the-switch-on-… The Switch on Market Analysis Framework: This market analysis framework encourages businesses to "switch on" strategic insight by evaluating customer needs, market trends, and competitive positioning. The diagr...
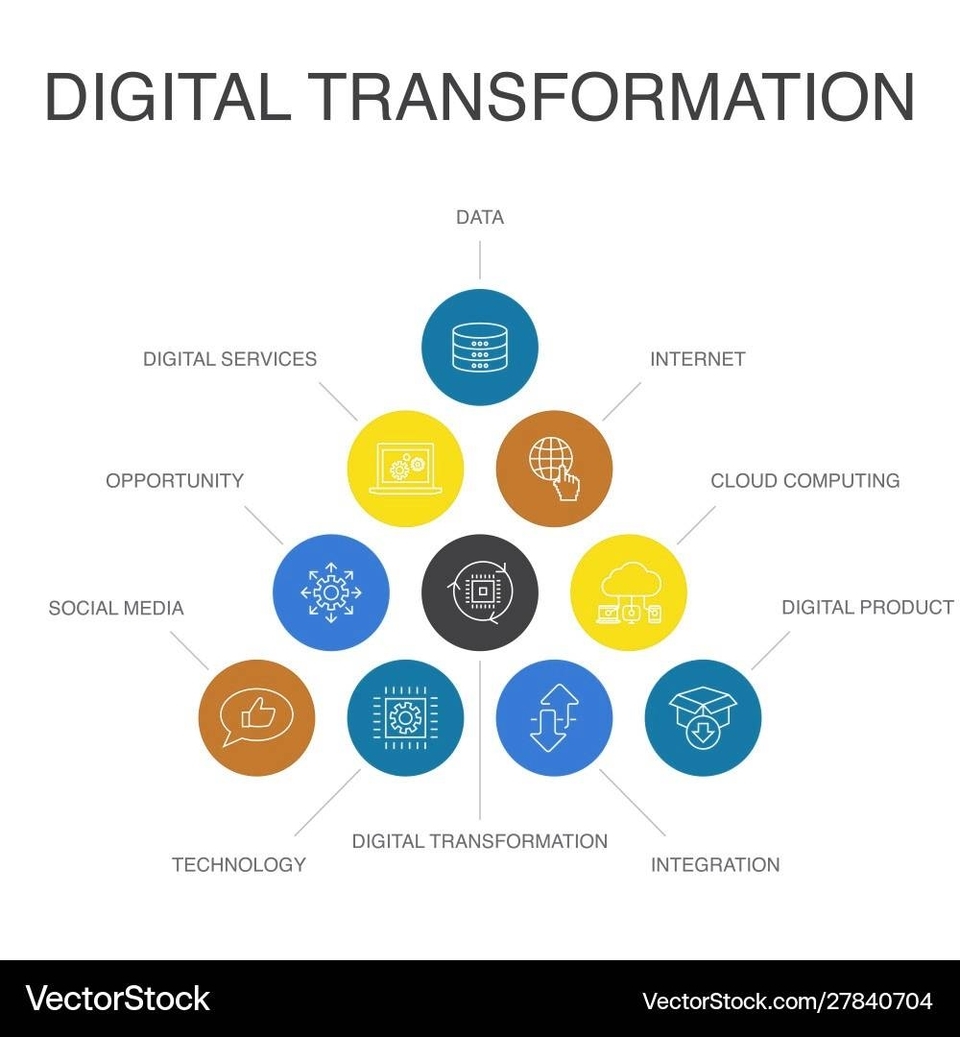
10 Steps Of Digital Transformation - chartdiagram.com/10-steps-of-di… 10 steps of digital transformation: Digital transformation involves steps like defining a clear vision, securing leadership commitment, assessing current capabilities, developing a digital strategy, investing in tec...
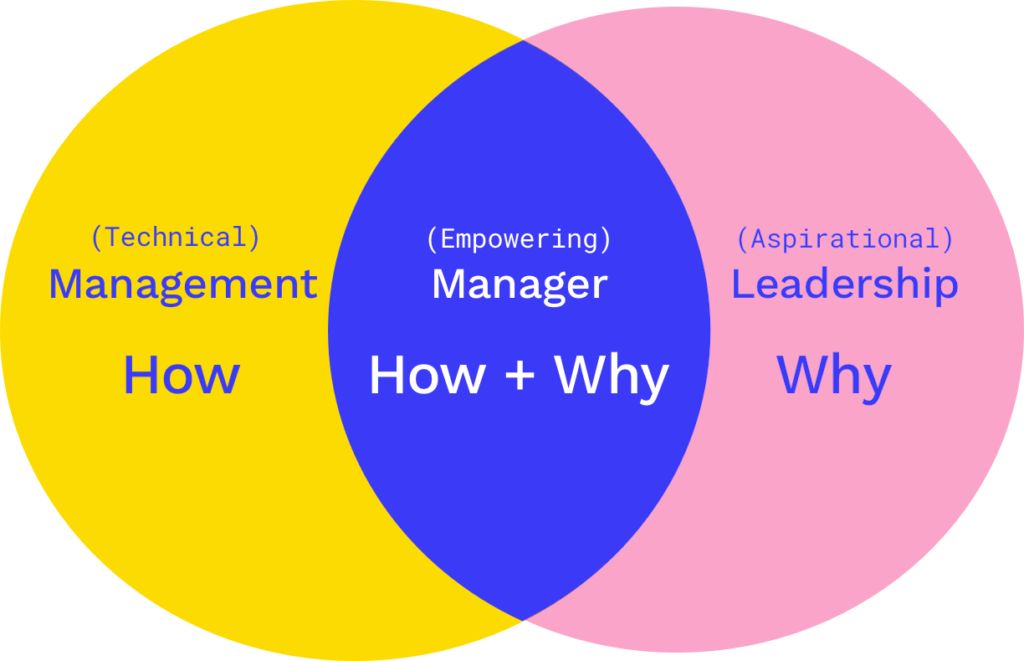
What Makes a Great Leader - chartdiagram.com/what-makes-a-g… What Makes a Great Leader: Great leaders inspire, guide, and empower others. Key traits include vision, empathy, integrity, adaptability, and the ability to make sound decisions. Leadership also involves influencing others t...
Purchase Order Workflow - chartdiagram.com/purchase-order… Purchase Order Workflow: The Purchase Order Workflow diagram illustrates the step-by-step process that occurs when a purchase order is created, reviewed, approved, and processed. It outlines the key stages, including vendor se...

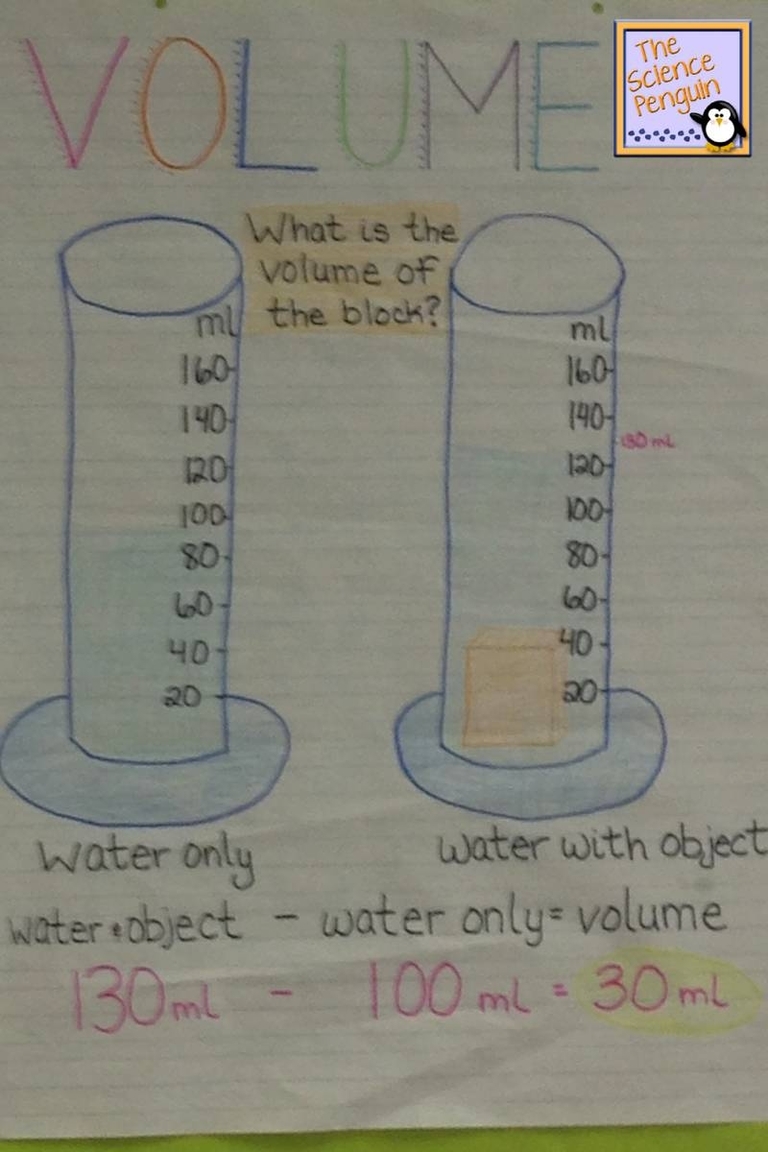
Volume Anchor Chart Science - chartdiagram.com/volume-anchor-… Volume Anchor Chart Science: A volume anchor chart in science visually represents the concept of volume, showing how to measure the amount of space an object occupies using units like liters and cubic meters.
Innovation Canvas Satisfaction vs. Importance Graph - chartdiagram.com/innovation-can… Innovation Canvas Satisfaction vs. Importance Graph: The Innovation Canvas is a strategic tool used to identify areas for innovation by mapping out customer satisfaction and importance of various pr...

6S Lean Workplace Circular Diagram Safety Poster - chartdiagram.com/6s-lean-workpl… 6S Lean Workplace Circular Diagram Safety Poster: A 6S Lean Workplace Circular Diagram is a visual tool used to promote workplace organization and safety through the 6S methodology, which includes Sort...

Presentation Slides Template - chartdiagram.com/presentation-s… Business Presentation Template: A business presentation template is a pre-designed framework that helps professionals create visually appealing and organized presentations. It typically includes slides for the introductio...

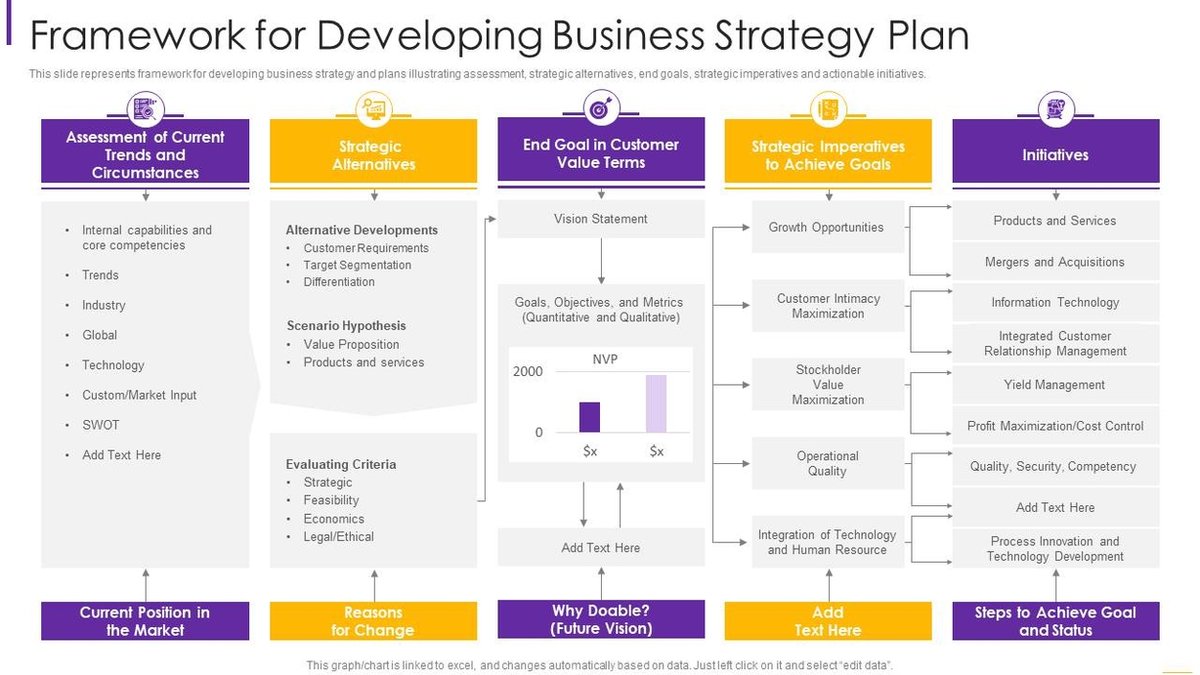
Business Strategy Framework Template - chartdiagram.com/business-strat… Digital Transformation Wheel: The digital transformation wheel is a visual tool that outlines the key components and stages of digital transformation. It includes elements like digital strategy, customer experienc...


United States Trends
- 1. Jets 77.4K posts
- 2. Jets 77.4K posts
- 3. Justin Fields 7,695 posts
- 4. Aaron Glenn 4,028 posts
- 5. #HardRockBet 3,232 posts
- 6. Sean Payton 1,714 posts
- 7. London 199K posts
- 8. Garrett Wilson 3,109 posts
- 9. Bo Nix 2,857 posts
- 10. HAPPY BIRTHDAY JIMIN 132K posts
- 11. Tyrod 1,441 posts
- 12. #OurMuseJimin 177K posts
- 13. #DENvsNYJ 2,010 posts
- 14. #JetUp 1,866 posts
- 15. #30YearsofLove 158K posts
- 16. Peart 1,877 posts
- 17. Bam Knight N/A
- 18. Kurt Warner N/A
- 19. Hail Mary 2,374 posts
- 20. Rich Eisen N/A
You might like


Something went wrong.
Something went wrong.