
Chukwuemeka Uba
@BuildWithEmeka
Data Analytics || SQL • Excel • Python || Breaking down what I learn into simple insights
Vous pourriez aimer


Hi, I’m Chukwuemeka. I’m learning how to work with data. How to clean it, understand it, and make sense of it. I share what I’m learning, the mistakes I make, and the lessons that finally click.


Here’s me shooting my shot as someone who’s always wanted to take a language course. How many K retweets to teach me German??🥺🥺🥺

1k retweets, we teach you German from A1 to B2 and also employ you‼️ You have 72 hours!!

Dear Data Analysts, A real dashboard answers 3 questions: 1️⃣ What happened? 2️⃣ Why did it happen? 3️⃣ What should we do next? If it stops at #1, you didn’t build insight — you built decoration.

Practical Walkthrough of a Data Analytics project (End to End) 1. Problem Definition (Business Understanding) Every analytics project begins with a clear problem statement. At this stage, you answer: What problem are we trying to solve? Who is the stakeholder?
What is the first things to do when you get a dataset?

Do yourself a favor this year: 1. Open laptop 2. Open YouTube or buy a course online 3. Choose tech of your choice 4. Start learning 5. Practice 6. Do some projects 7. Update resume 8. Upload on job portal 9. Start giving interviews 10. Crack few 11. Get an offer Just take an…
Tech is open to everyone. You can start from where you are. The opportunities are global. You would need to showcase your skills. You would eventually find your path and succeed. Don't let anyone tell you otherwise.
Dashboards vs Reports: What Do They Really Mean? Dashboard A dashboard is a single-screen (or very few screens) visual view of key metrics and KPIs. It is designed for quick monitoring, real-time tracking, and fast decision-making. Dashboards focus on what is happening now...🧵

𝗛𝗲𝗿𝗲’𝘀 𝟱 𝗵𝗮𝗰𝗸𝘀 𝗜’𝗱 𝘀𝘁𝗮𝗿𝘁 𝘂𝘀𝗶𝗻𝗴 𝗮𝘀 𝗮 𝗱𝗮𝘁𝗮 𝗮𝗻𝗮𝗹𝘆𝘀𝘁. 𝗚𝗼𝗼𝗱 𝗺𝗼𝗿𝗻𝗶𝗻𝗴, 𝗵𝗮𝗽𝗽𝘆 𝗻𝗲𝘄 𝘄𝗲𝗲𝗸. Most people don’t know these. The ones who do get ahead faster. 𝟭. 𝗕𝘂𝗶𝗹𝗱 𝗶𝗻 𝗽𝘂𝗯𝗹𝗶𝗰 Stop keeping your projects to yourself.…

Just created my first Excel Dashboard. This marks a huge milestone in my data analysis journey. From learning the basics to finally building a full dashboard, the progress feels really amazing.
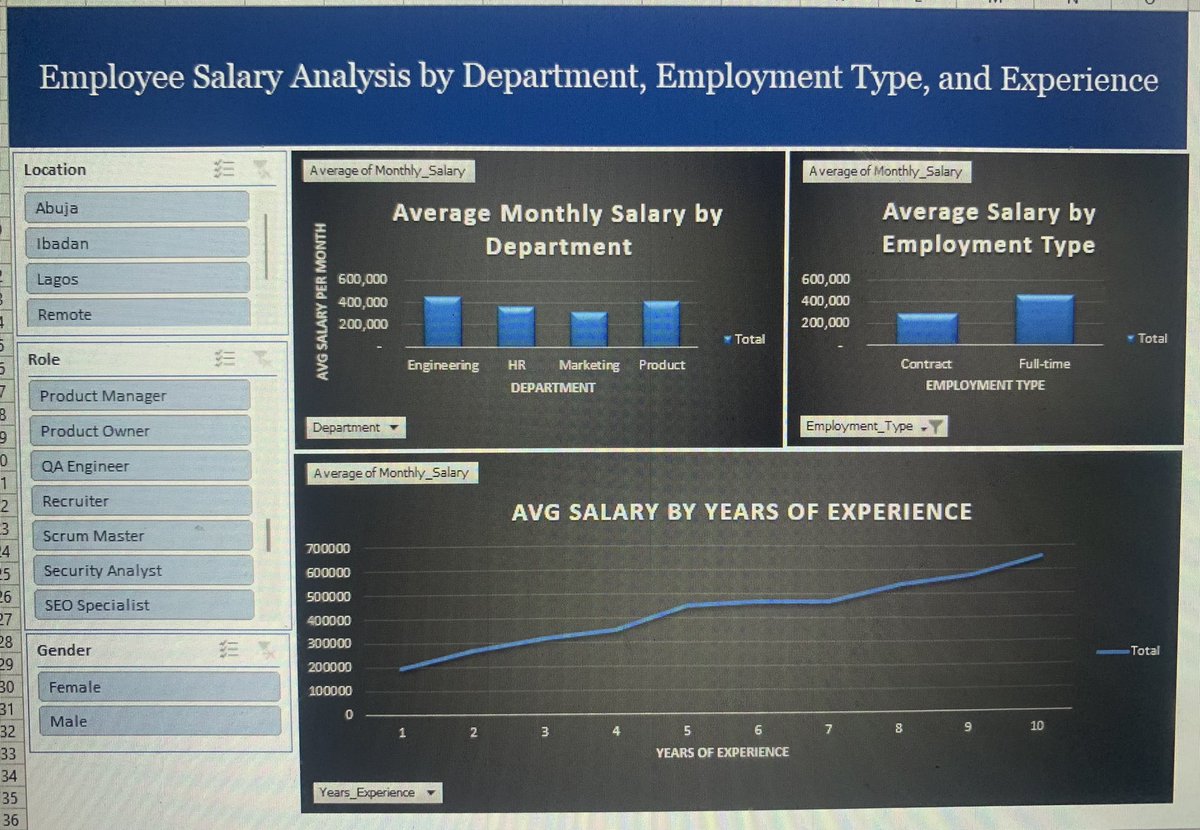
Built this DB in Excel, analyzing avg employee salaries by department, employment type, and years of experience. Insights: Engineering & Products roles earn the highest on avg. Full-time employees earn more than contract staff. Salary increases overtime with experience.

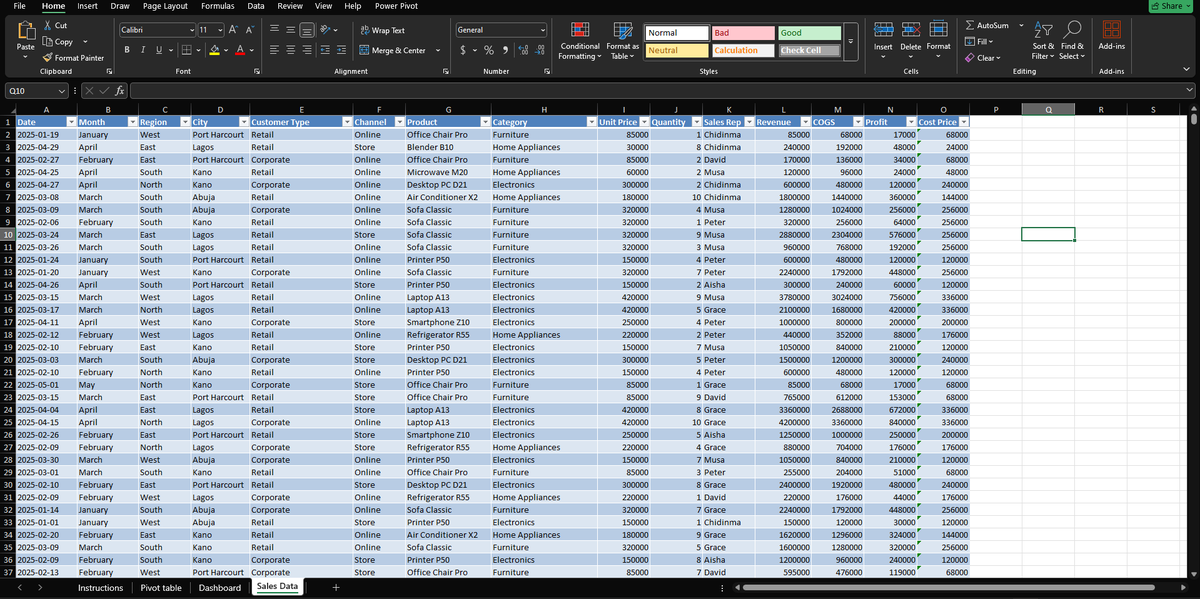
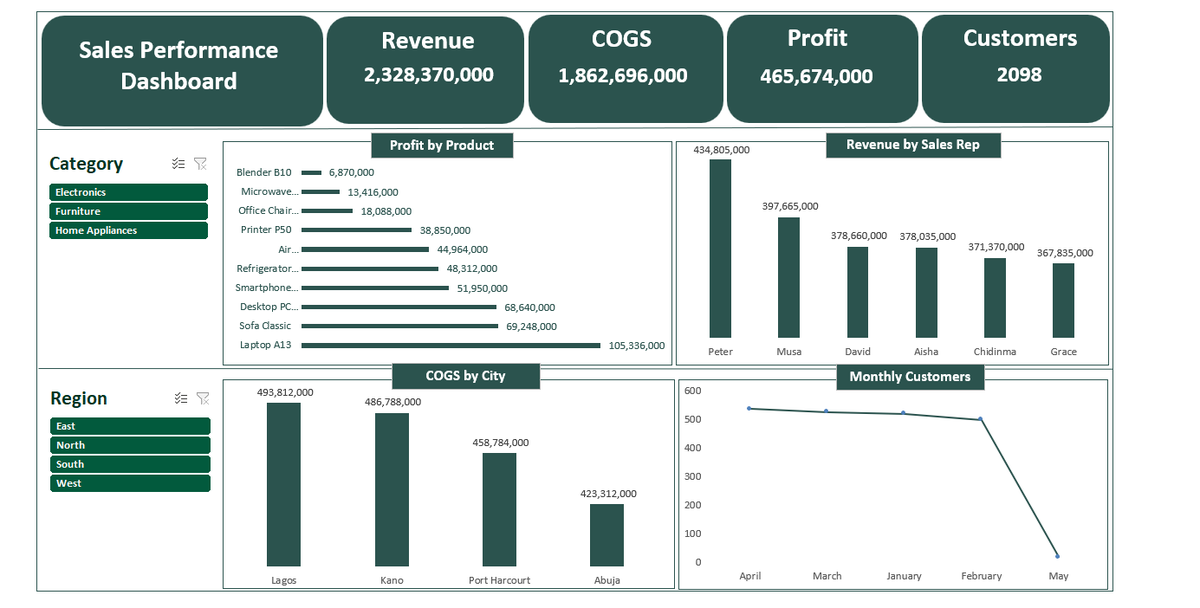
I built an interactive Sales Performance Dashboard in Excel as part of my data analysis training with @TSAcademyOnline @ezekiel_aleke, turning raw sales data into clear, actionable insights.
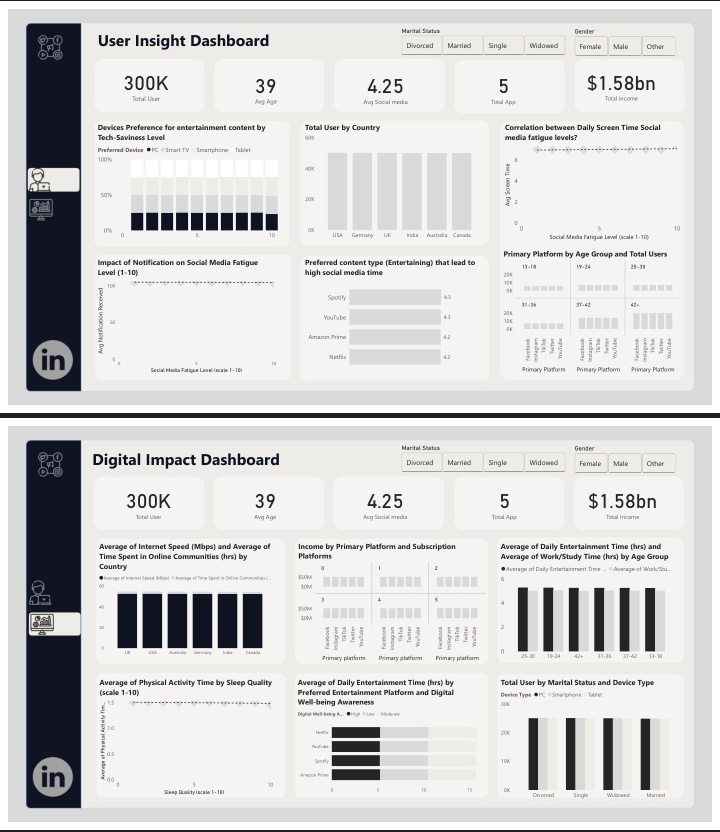
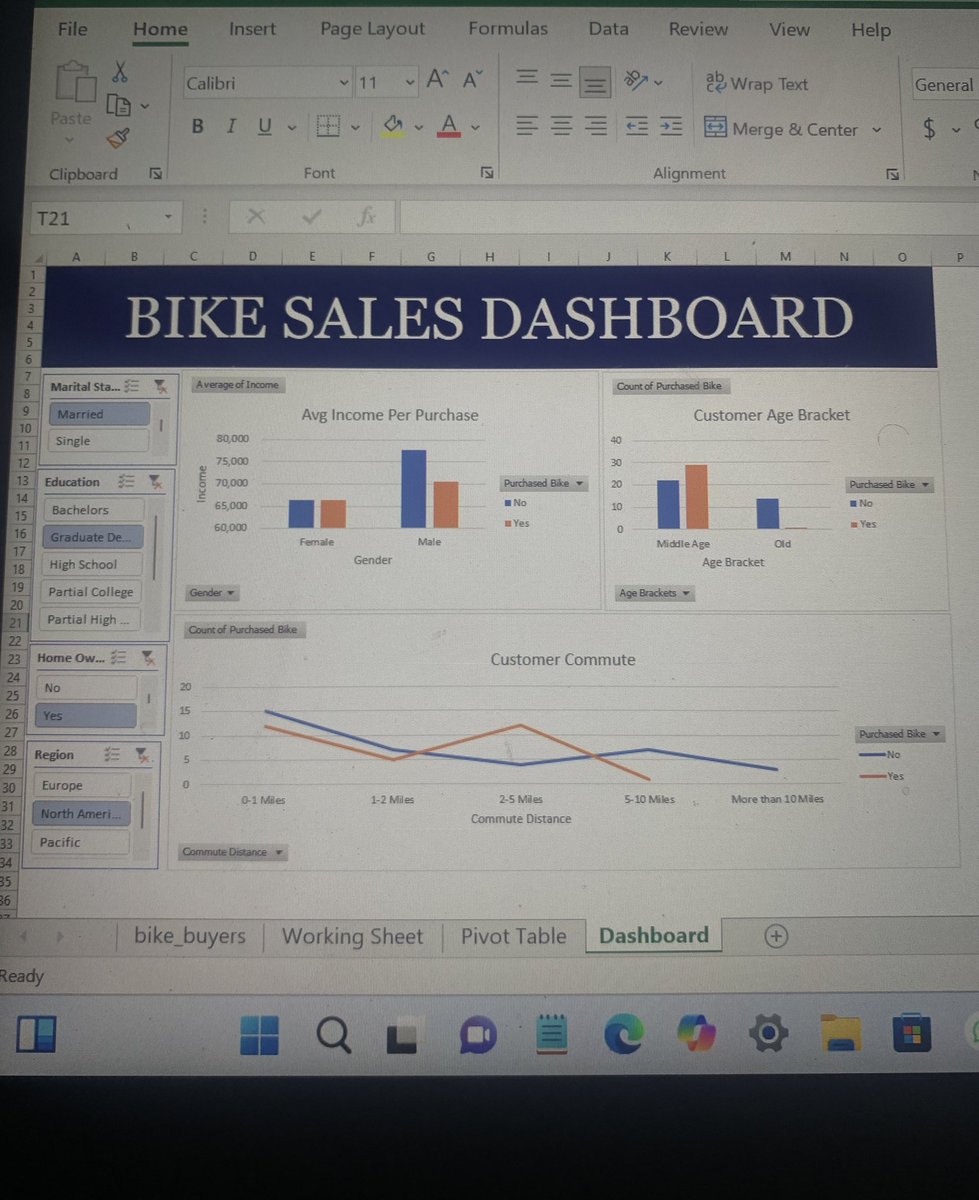
Was looking at this DB and I noticed: • Middle-aged customers are more likely to buy a bike than older customers. • Females who earn high are more likely to buy bikes, while it’s the opposite for males. Surprising. Open to corrections if I misunderstood anything. 🙏
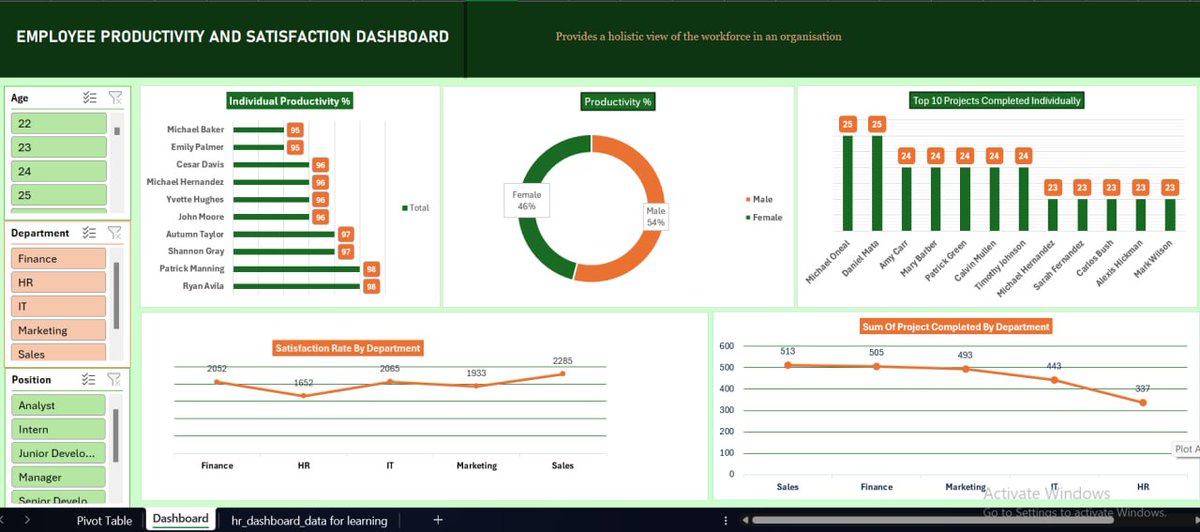
Built my first Excel Dashboard using pivot tables and slicers. Still learning, but proud of the progress. Feedback is welcome. 🙏
Built my first Excel Dashboard using pivot tables and slicers. Still learning, but proud of the progress. Feedback is welcome. 🙏

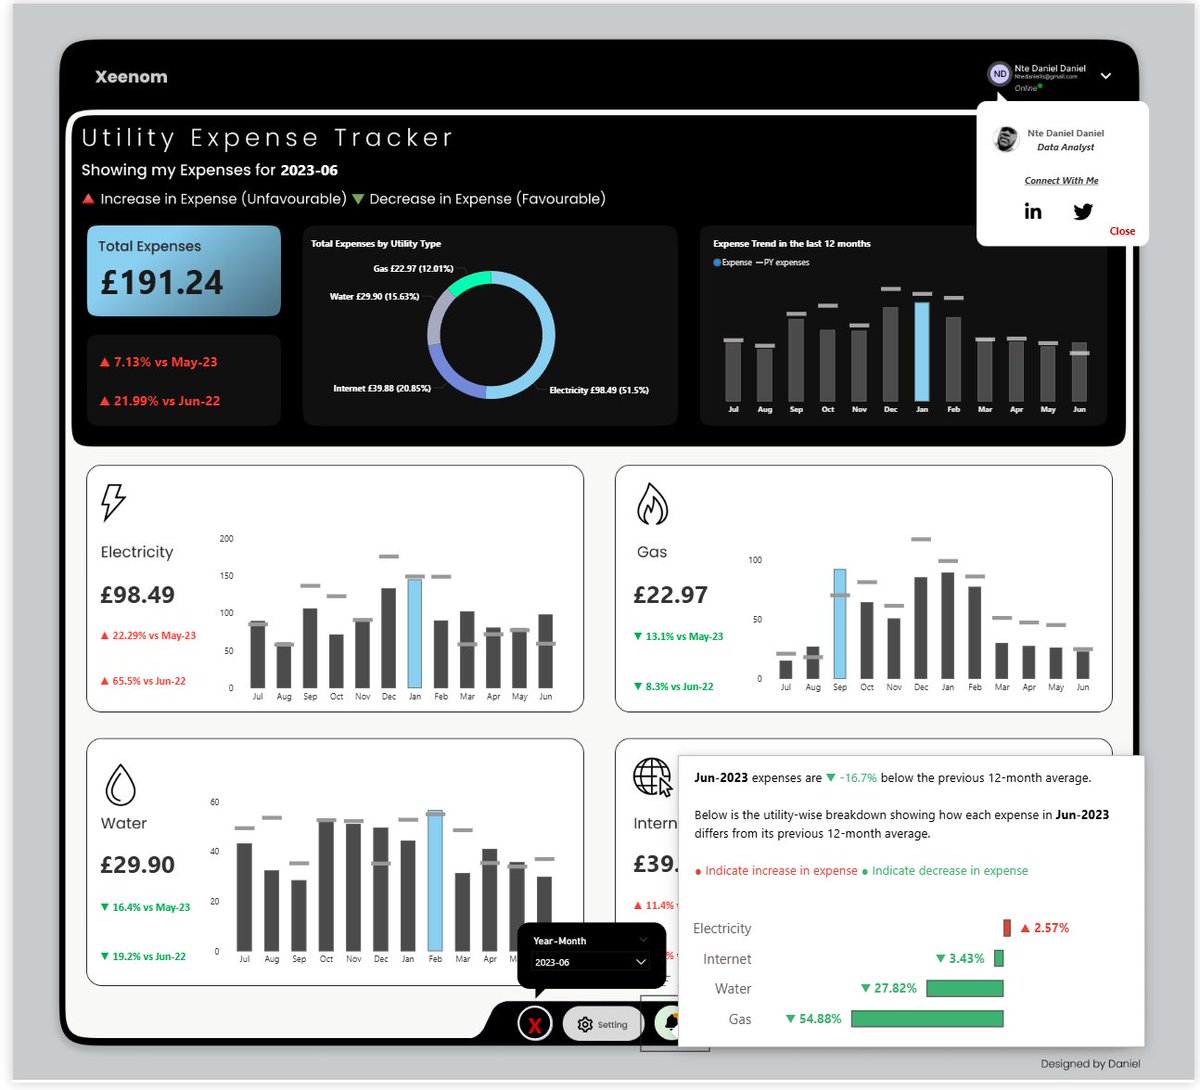
I've built a personal finance tracker Comment TRACKER in the comment section if interested

Please, bookmark, retweet or quote this with anything 🥲 I've been shadow-banned.
How’s it going guys.. please i need a huge favor.. I have been getting twitter notifications on shadow banning my account, and i think it’s affecting me.. Please if you see this, help like, comment and repost my quoted post, and you can also check out the project if it…
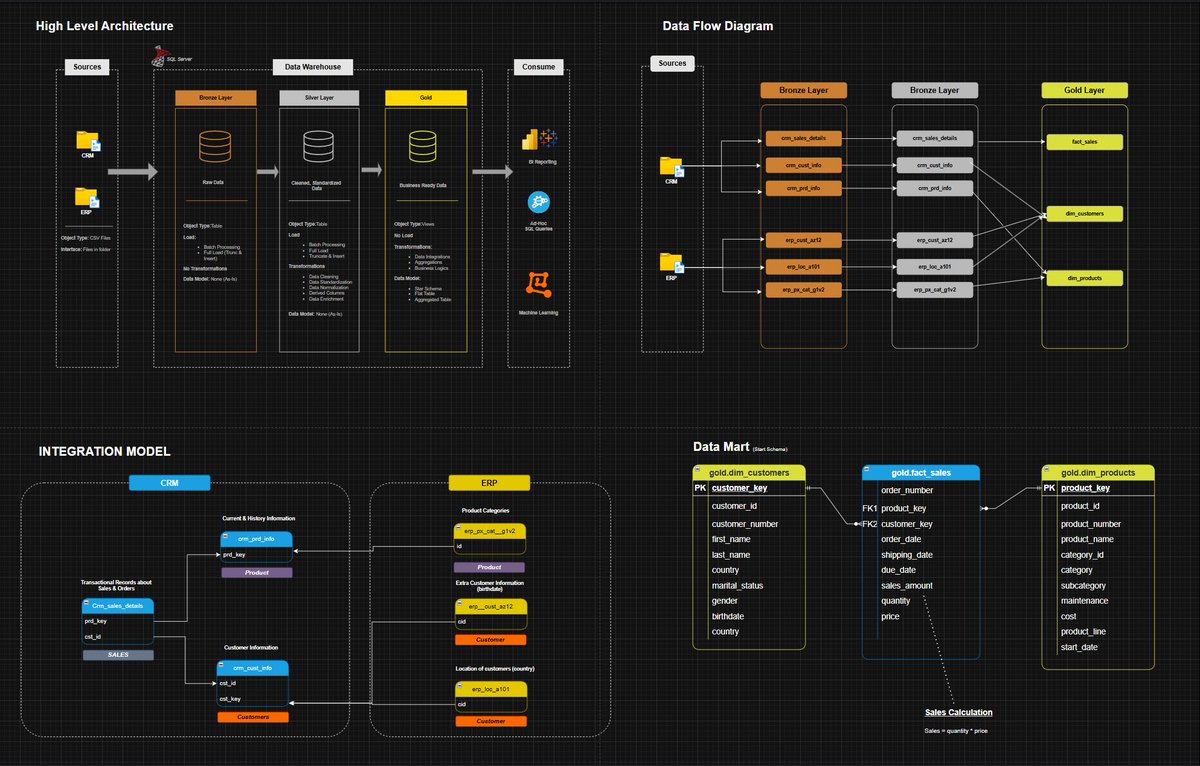
For a long time, my data lived in 𝘁𝗼𝗼 𝗺𝗮𝗻𝘆 𝗽𝗹𝗮𝗰𝗲𝘀. CRM here. ERP there. 𝗗𝗶𝗳𝗳𝗲𝗿𝗲𝗻𝘁 𝘀𝗰𝗵𝗲𝗺𝗮𝘀. 𝗗𝗶𝗳𝗳𝗲𝗿𝗲𝗻𝘁 𝗿𝘂𝗹𝗲𝘀. 𝗡𝗼 𝘀𝗶𝗻𝗴𝗹𝗲 𝘀𝗼𝘂𝗿𝗰𝗲 𝗼𝗳 𝘁𝗿𝘂𝘁𝗵. Simple questions like “𝗪𝗵𝗮𝘁 𝗮𝗿𝗲 𝗼𝘂𝗿 𝗮𝗰𝘁𝘂𝗮𝗹 𝘀𝗮𝗹𝗲𝘀?” or…

📍 Job seekers (especially data professionals), read this carefully Here’s a smarter, location-based strategy 👇🏽 I found a site that lists Y Combinator–backed startups by location including Nigeria 🇳🇬. Here: startupfrequency.com/ycstartups/?lo… 📍 Why this works Many YC-backed startups do…


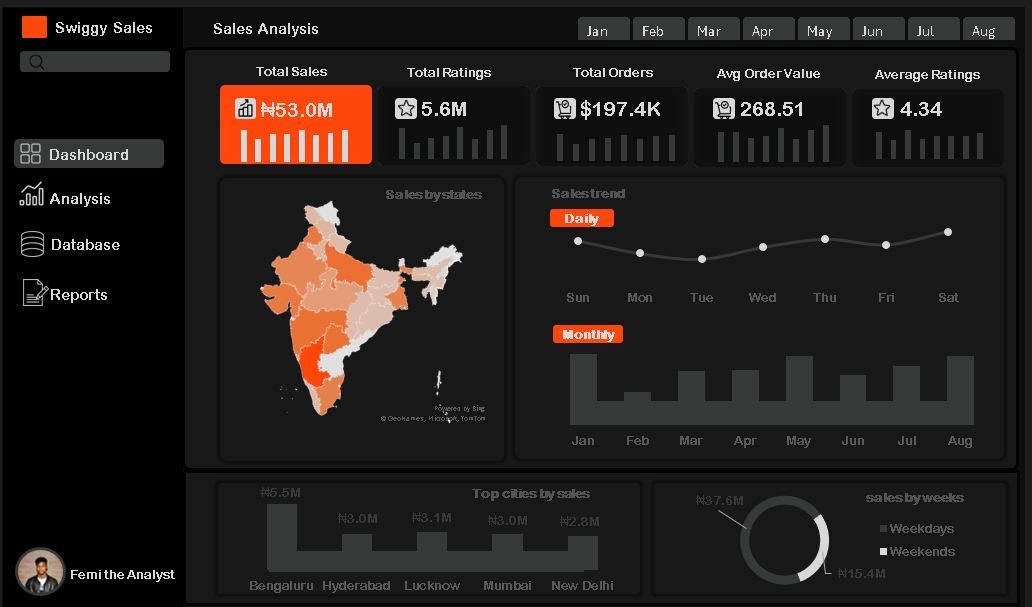
Just finished this Swiggy Sales Analysis dashboard. The goal was to create a seamless UI that allows a stakeholder to see everything from high-level KPIs to regional performance in under 10 seconds. The Stack: Data Cleaning: Pivot Tables & Pivot Charts Slicers (for…


United States Tendances
- 1. #GRAMMYs N/A
- 2. Cher N/A
- 3. Bad Bunny N/A
- 4. Benito N/A
- 5. Luther Vandross N/A
- 6. Billie N/A
- 7. sabrina N/A
- 8. D’Angelo N/A
- 9. Kendrick N/A
- 10. Nicki N/A
- 11. Tyler N/A
- 12. Gaga N/A
- 13. AOTY N/A
- 14. Album of the Year N/A
- 15. Pharrell N/A
- 16. Jelly Roll N/A
- 17. Lauryn Hill N/A
- 18. Olivia Dean N/A
- 19. Trevor Noah N/A
- 20. harry styles N/A


Something went wrong.
Something went wrong.