CGI Indicator
@CGIindicator
Designed to provide traders with clear, high-probability trading signals, this indicator helps you identify key market levels
#ARBUSDT.P was forming a bullish Flag Pattern on the 1 Weekly chart. 🕯 📌 Target Level 💵 $ 0.3528 💵 $ 0.5010 💵 $ 0.9070 💵 $ 1.4340 💵 $ 2.15 ▶️WAIT for CGI Alerts t.me/CGIalerts ▶️ CGI Conformation t.me/CGIIndicator
#LINK is ready to perform the Descending Triangle bullish formation 1 W Chart 🕯 📌 Target Level 💵 $ 20.45 💵 $ 22.75 💵 $ 26.20 💵 $ 30.50 💵 $ 42.10 ▶️WAIT for CGI Alerts t.me/CGIalerts ▶️ CGI Conformation t.me/CGIIndicator/4…
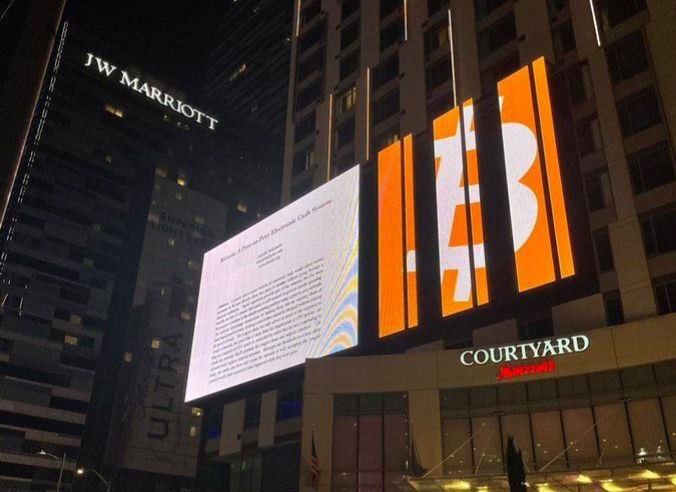
🔊JUST IN: The Bitcoin White Paper displayed in Los Angeles⚡

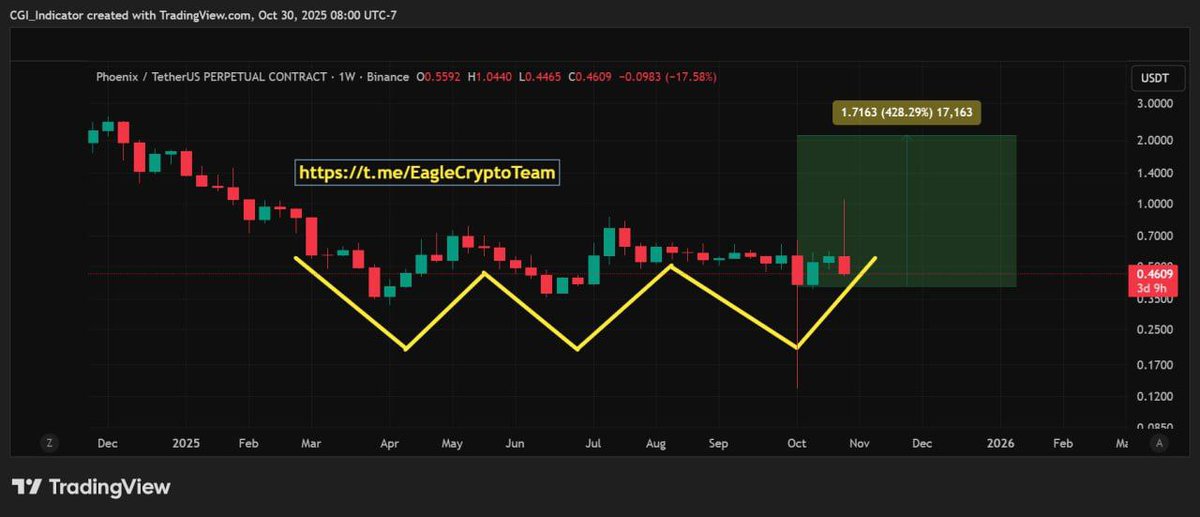
#PHB is ready to perform the Triple Bottom bullish formation - #PHBUSDT.P TradingView tradingview.com/chart/PHBUSDT.…

🔥SEI Coin is forming a Falling Wedge Pattern on the 3D Chart. 🕯 The market price is currently at 0.3090 and there is a possibility of a decline from there. The price may fall to 0.2986 or 0.2485. 🔽🔽 A rise in price is expected from these two points,

#KSM 1W chart has a Desending tringle pattern that has been broken. 🔼🔼✔️✔️ #KMS Coin is currently forming a Descending Triangle pattern on the 3D chart. 🕯🕯 👀 After the Descending Triangle pattern on the 3D chart breaks out,📌 we can enter a Long Trade.🔥🔥 💵 Tp -usa

💰 According to the chart analysis we did on #CakeCoin, the Conformation obtained according to CGI Indicators in the 3D Chart for a Long Position is: CGI Indicator conformation 3 D Chart ▶️ 🛫 Buy Tag 🛫 Golden Cross 🛫 Support Line Join & See the #Cake Coin Long Position

💰 #CAKE Coin has formed a Triangle Pattern on the 3D chart. However, since there has been no liquidation, we can expect a price drop from the current level to liquidate it. However, the price may increase to $5.. 👀Join us to see the full Conformation👀 t.me/CGIIndicator
#TAO 1W chart has a Bullish Flag pattern that has been broken. It is likely to rise to $723. 🔼🔼 👀 When the market reaches the $723 level, 👀 it shows a double bottom pattern. If it also breaks out, it can rise to $1060.🔼 💵 Tp 1 : $ 443 💵 Tp 2 : $ 499 💵 Tp 3 : $ 575

GALA Live Analysis 💰#GALA 3rd Bullish Flag Pattern Formation Retest Confirmed👀↗️ 💵 Tp 1 : $ 0.02095 💵 Tp 2 : $ 0.02210 💵 Tp 3 : $ 0.02510 💵 Tp 4 : $ 0.02990 💵 Tp 5 : $ 0.04710


💰 #ADA forming Bullish Flag on The weekly timeframe👀 💵 Tp 1 : $ 0.9985 💵 Tp 2 : $ 1.1400 💵 Tp 3 : $ 1.3220 💵 Tp 4 : $ 1.5440 💵 Tp 5 : $ 1.8405 #live #like #trading #status #crypto #analysis #livetrading #stockmarket #cryptocurrency #forex #DayTrading #tradingbook

💰 #The Near Coin is forming a W Pattern on the 1D Chart. 💵 Tp 1 : $ 3.29 💵 Tp 2 : $ 4.36 💵 Tp 3 : $ 5.17 💵 Tp 4 : $ 5.94 💵 Tp 5 : $ 6.55 #live #like #trading #status #crypto #analysis #livetrading #stockmarket #cryptocurrency #forex #daytrading #tradingbook

Audio Live Analysis ✏️ Use less funds 5% - 10% 💥 Wait & Get The Best Entry 🦊Pair : AUDIO/USDT 🟢 🐢 SPOT 🏎️ Buy : ♻ 0.0555 ♻️ 0.0540 🎉️Sell - 💵 0.0664 💵0.0779

Pump ▶️ The Pump coin has now touched its All Time Low.🕯 The coin is now showing an upward trend.👀 🛫 a Descending Triangle is currently forming a breakout on the 1H chart. 🛫 Making a Ranging Channel on the 4 H Chart 🕯🕯 t.me/CGIIndicator
🎁Magic Magic Coin has broken out a Bullish Flag on the 4H Chart. 🔼🔼 Looking at BTC and BTCDOM, the market is showing a downward trend. Accordingly, MAGIC Coin is currently retesting and a MAGIC rise can be expected very soon. ↗️↗️

#AERGOUSDT.P Live analysis $AERGO Bullish conformation With CGI Indicator in 1 H Time Frame👀 🛫 Creating A Bullish Double Top 🛫 Make a Buy 🛫 In Weak Low Now 🛫 Mak A BOS (15M) 🛫 Buy CGI Alert My Target 💵 $ 0.12670 💵 $ 0.13790 #crypto #liveshow #TradingStrategy

#MOVEUSDT P $MOVE Bullish conformation With CGI Indicator in 1 H👀 🛫 Make aBuy Tag 🛫 In Weak Low Now 🛫 Mak A CHoCH 🛫 Buy CGI Alert My Target 💵 $ 0.1799 💵 $ 0.1986 #cryptonews #crypto #liveshow #Trading #cryptotrading #cryptocurrency

United States الاتجاهات
- 1. #StrangerThings5 48.6K posts
- 2. Afghan 128K posts
- 3. Thanksgiving 539K posts
- 4. National Guard 450K posts
- 5. #AEWDynamite 11.3K posts
- 6. Rahmanullah Lakanwal 52.8K posts
- 7. #Survivor49 1,306 posts
- 8. Cease 26.1K posts
- 9. holly 18.8K posts
- 10. Celtics 13.2K posts
- 11. Dustin 80.6K posts
- 12. Blood 236K posts
- 13. Cade 32.9K posts
- 14. Blue Jays 11.1K posts
- 15. Okada 7,347 posts
- 16. Operation Allies Welcome 16.7K posts
- 17. Derrick White 2,095 posts
- 18. Walker Horn N/A
- 19. D.C. 289K posts
- 20. Babes of Wrath N/A
Something went wrong.
Something went wrong.


