
Chrome DevTools
@ChromeDevTools
Official account. Follow for latest news, features, tips and more. Shape the future of DevTools, participate: http://goo.gle/devtools-ux-research
Вам может понравиться


🎉 Chrome 134 is here! What's new in DevTools 🔐 New: Privacy and security panel 📈 Calibrated CPU throttling for #webperf analysis 🥇 Dim 3rd-party scripts in performance traces ....and more! Update Chrome and try them out! developer.chrome.com/blog/new-in-de…

We've been cooking lately! 🧑🍳 Give it a try and let us know what you think, we are excited to keep pushing this.
Announcing our public preview of Chrome DevTools MCP! Experience the full power of DevTools in your AI coding agent → goo.gle/4pDE6Tk With Chrome DevTools MCP, your AI agent can run performance traces, inspect the DOM, & perform real-time debugging of your web pages.

🚀 Chrome DevTools adds Calibrated CPU Throttling! No more guessing—DevTools calibrates throttling for realistic performance testing. 🔍 Simulate low-end devices & catch slow rendering early! Try it: Performance panel → CPU throttling → "Calibrate..." #ChromeDevTools #WebPerf
New video! Let’s explore advanced Network panel techniques, including how to find performance bottlenecks, debug popups’ network activities, configure network conditions, and more. 📺 youtu.be/kuliHlLk9wQ @jecfish #DevToolsTips #ChromeDevTools

⚡️ Chrome 133 is here! What's new in DevTools 🤖 Persistent AI chat history 📈 Enhanced insights on image performance 🧭 Customize performance trace navigation ....and more! Update Chrome and try them out! developer.chrome.com/blog/new-in-de…

⚡️ Chrome 132 is here! What's new in DevTools 🤖 AI Assistance - Debug network, sources and performance with Gemini 📈 View interaction phrases in live metrics 💾 Manage Chrome extension storage ....and more! Update Chrome and try them out! developer.chrome.com/blog/new-in-de…


Introducing "Copy console" in @ChromeDevTools: one-click copy all console messages. Useful for pasting into LLMs / AI Code Editors for better fixes.

Follow along with @jecfish as she shows you how WebDriver BiDi supercharges cross-browser testing 🧪 Learn how this browser automation can help with mock network requests and monitoring console events ▶️ goo.gle/4j9wiWi

Don't you just hate debugging a dropdown that hides once you focus out?! @ChromeDevTools to the rescue! Just toggle the "Emulate a focused page" checkbox - and you're good to go 🔥
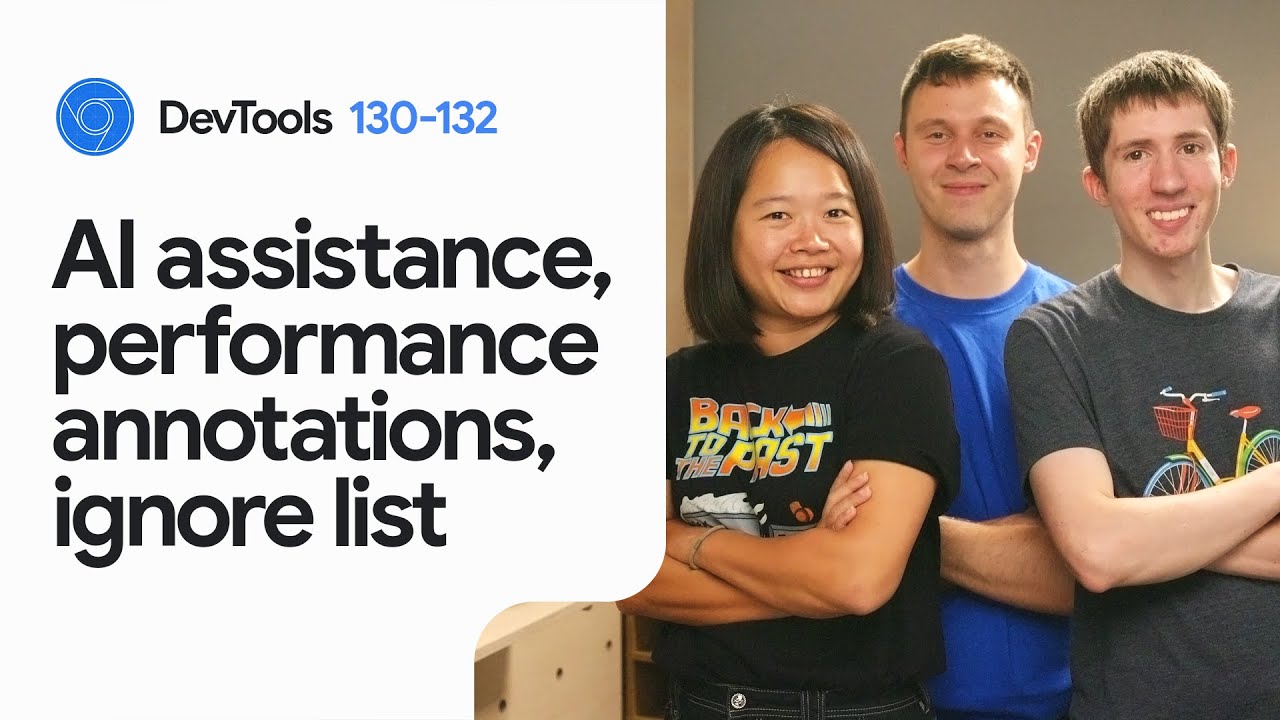
One last "What's New in DevTools" of the year! 🎉 More improvements on Network, Performance and CSS debugging! Let's go~~ youtu.be/kzDUe-f4gac @oliverdunk_ @jecfish @matthiasrohmer #ChromeDevTools #webdev #debugging
youtube.com
YouTube
What’s new in DevTools: Chrome 130-132

This is the kind of stuff where AI just comes in super handy in Chrome DevTools. 🤖 How many DOM elements are underneath this div? Instant answer. The same goes for debugging JS console warnings; AI is actually speeding my workflow. Great job @ChromeDevTools team!


Want to know if your redesign actually improved user experience? See real-world performance data with Chrome UX Report! Compare your production (old) and new designs to measure the impact. @tunetheweb #webperf #ChromeDevTools
🥱 What to do when your teammate's asleep but the code's gotta be fixed? Watch to find out: youtube.com/shorts/asJGtTR… @matthiasrohmer @jecfish #DevToolsAI #CSS #webdev #debugging

Performance you say? Join Captain Speedy to learn how to pinpoint & fix performance issues with cool insights in #ChromeDevTools. Let’s dive in! 📺 youtu.be/7A70hBrPL4I @tunetheweb @jecfish @malchata #DevToolsTips #webperf

We're revamping the DevTools Perf Panel Timings track, and we’re wondering if we should drop FP, DCL, and L timings to clean up the UI a bit. Do you use those timings when looking at perf traces? If so comment below with your use cases so we can take that into consideration!


I just resolved a console error with AI in @ChromeDevTools! It even gives AI-powered insights for CSS—perfect for understanding and tweaking those complex styles I copy... 👀 #WebDev #Frontend #DevCommunity

Mayday! Mayday! We need a CSS hero to save our flight! 🛩️ (Spoiler: it involves a lot of frustrated yelling 😂) Watch and find out: youtube.com/shorts/E_3wmTj… #codinglife #CSS #DevToolsAI @matthiasrohmer @jecfish
Improving @ChromeDevTools debugging with AI: a quick overview of new features we recently shipped.


United States Тренды
- 1. Auburn 39.5K posts
- 2. Duke 31.4K posts
- 3. Bama 28.9K posts
- 4. Stockton 20.1K posts
- 5. Miami 126K posts
- 6. Ole Miss 37.9K posts
- 7. Lane Kiffin 47.5K posts
- 8. Stanford 9,617 posts
- 9. Notre Dame 25.2K posts
- 10. #SurvivorSeries 182K posts
- 11. Virginia 48.4K posts
- 12. Cam Coleman 1,914 posts
- 13. Austin Theory 4,779 posts
- 14. Cooper Flagg 7,583 posts
- 15. ACC Championship 8,160 posts
- 16. Iron Bowl 16.5K posts
- 17. #RollTide 6,218 posts
- 18. Oxford 23.7K posts
- 19. Ryan Williams 1,789 posts
- 20. Seth 21.4K posts
Вам может понравиться
-
 React
React
@reactjs -
 Visual Studio Code
@code -
 Tailwind CSS
@tailwindcss -
 Vercel
@vercel -
 Chrome for Developers
@ChromiumDev -
 Angular
@angular -
 TypeScript
@typescript -
 Remix 💿
@remix_run -
 Vue
Vue
@vuejs -
 Node.js
@nodejs -
 Firefox DevTools
@FirefoxDevTools -
 CodePen.IO
@CodePen -
 Frontend Masters 💻✨
@FrontendMasters -
 GraphQL
@GraphQL -
 React Native
@reactnative
Something went wrong.
Something went wrong.