Stock Decoder
@DecoderStock
I do K Chart decoding with Data & Brain.
Bạn có thể thích


Stock Decoder Tweet Bot 📊 S&P 500 (^GSPC) Analysis (2025-10-27) Period: 30 days Target: 0% (Date: 2025-10-28) This message is for informational purposes only.
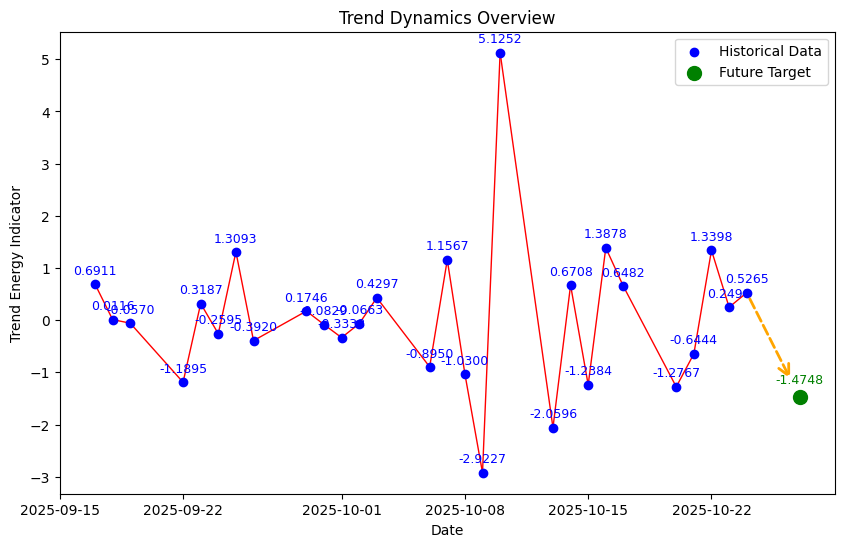
What does this image tell us? Friday closed at 0.2490, still high, momentum likely keeps going down on Monday and we're nearing the green dot, upside is tight. So it tells us a big pop on Monday is unlikely without a catalyst.
Stock Decoder Tweet Bot 📊 S&P 500 (^GSPC) Analysis (2025-10-24) Period: 30 days Target: 0% (Date: 2025-10-25) This message is for informational purposes only.
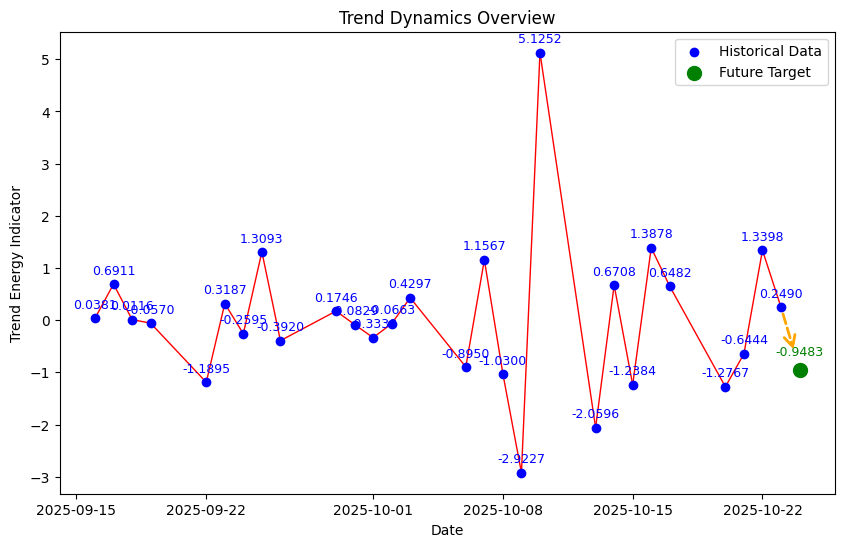
Stock Decoder Tweet Bot 📊 S&P 500 (^GSPC) Analysis (2025-10-24) Period: 30 days Target: 0% (Date: 2025-10-25) This message is for informational purposes only.
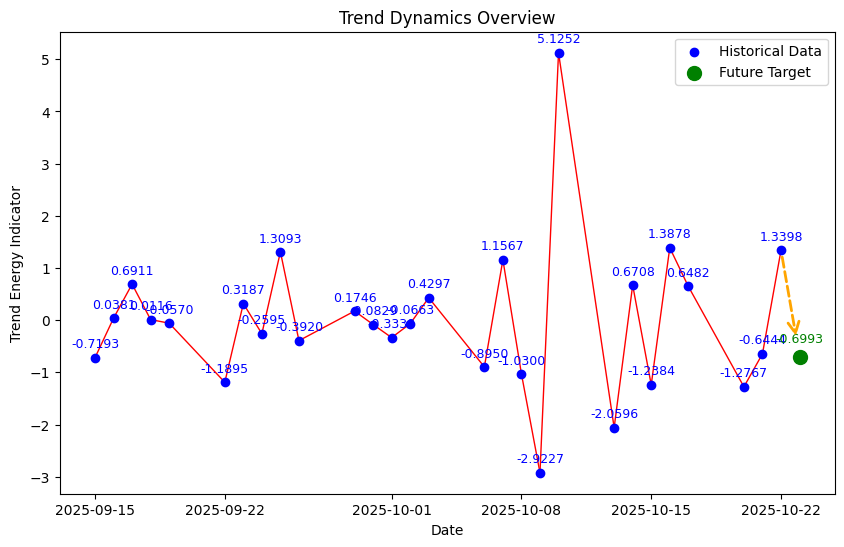
Let me explain. 1st is the momentum direction. Today at 1.3398, apparently at high pos by graph. Tomorrow momentum is very likely going down. When it crosses over green dot downward, <-0.6993, market falls. Above, market up. Use history pattern to figure where it could land.
Stock Decoder Tweet Bot 📊 S&P 500 (^GSPC) Analysis (2025-10-23) Period: 30 days Target: 0% (Date: 2025-10-24) This message is for informational purposes only.
Stock Decoder Tweet Bot 📊 S&P 500 (^GSPC) Analysis (2025-10-23) Period: 30 days Target: 0% (Date: 2025-10-24) This message is for informational purposes only.
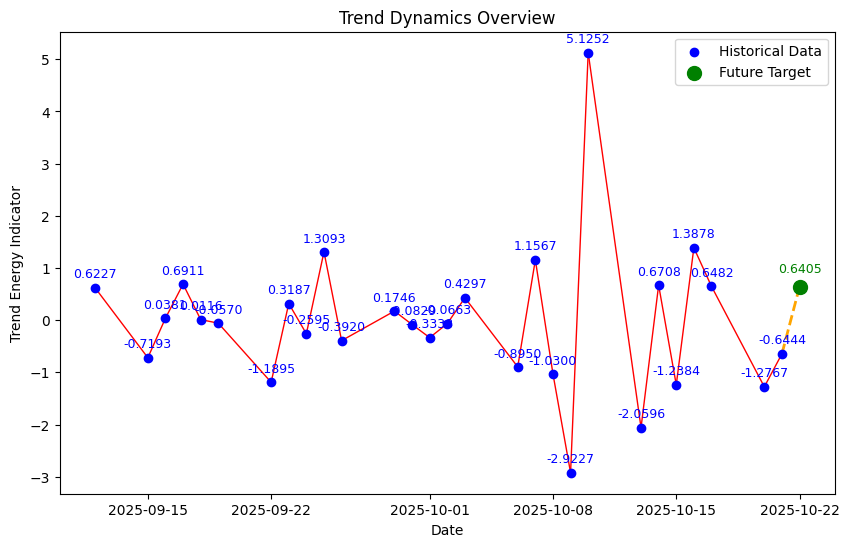
Hey! My bot will post a daily Trend Dynamics indicator I invented and developed. It models the market’s circular motion. Positive = upside momentum; negative = downside. Green dot = projected position if the next day’s change is 0%. Enjoy!
Stock Decoder Tweet Bot 📊 S&P 500 (^GSPC) Analysis Period: 30 days ending 2025-10-23 Target: 0% This message is for informational purposes only.
Stock Decoder Tweet Bot 📊 S&P 500 (^GSPC) Analysis Period: 30 days ending 2025-10-23 Target: 0% This message is for informational purposes only.
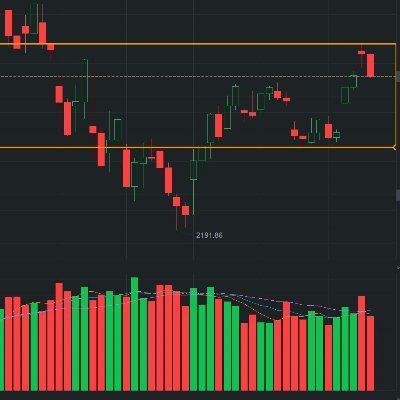
Stock Decoder Tweet Bot Abnormal S&P Volume Move Observed !!!. Diff Ratio: 0.8317610277181899. This message is for informational purposes only.
Stock Decoder Tweet Bot Abnormal S&P Volume Move Observed !!!. Diff Ratio: 0.9180141937667419. This message is for informational purposes only.
Stock Decoder Tweet Bot Abnormal S&P Volume Move Observed !!!. Diff Ratio: 0.9069918637903336. This message is for informational purposes only.
Stock Decoder Tweet Bot Abnormal S&P Volume Move Observed !!!. Diff Ratio: 0.9675704550597435. This message is for informational purposes only.
Stock Decoder Tweet Bot Abnormal S&P Volume Move Observed !!!. Diff Ratio: 0.9226947475459404. This message is for informational purposes only.
Stock Decoder Tweet Bot Abnormal S&P Volume Move Observed !!!. Diff Ratio: 0.8714765082005057. This message is for informational purposes only.
Stock Decoder Tweet Bot Abnormal S&P Volume Move Observed !!!. Diff Ratio: 0.8282054206505809. This message is for informational purposes only.
Stock Decoder Tweet Bot Abnormal S&P Volume Move Observed !!!. Diff Ratio: 0.9696338165100609. This message is for informational purposes only.
Stock Decoder Tweet Bot Abnormal S&P Volume Move Observed !!!. Diff Ratio: 0.8362195910333281. This message is for informational purposes only.
Stock Decoder Tweet Bot Abnormal S&P Volume Move Observed !!!. Diff Ratio: 0.8148508236318923. This message is for informational purposes only.
Stock Decoder Tweet Bot Abnormal S&P Volume Move Observed !!!. Diff Ratio: 0.9191898154346718. This message is for informational purposes only.
Stock Decoder Tweet Bot Abnormal S&P Volume Move Observed !!!. Diff Ratio: 0.8552952058388986. This message is for informational purposes only.
Stock Decoder Tweet Bot Abnormal S&P Volume Move Observed !!!. Diff Ratio: 0.8091020073610528. This message is for informational purposes only.


United States Xu hướng
- 1. #WorldSeries 213K posts
- 2. Dodgers 265K posts
- 3. Freddie 99.8K posts
- 4. Klein 211K posts
- 5. Ohtani 140K posts
- 6. Good Tuesday 21.8K posts
- 7. Kershaw 20.2K posts
- 8. Mookie 15.6K posts
- 9. 2-12% River Pts N/A
- 10. #Worlds2025 10.4K posts
- 11. Yamamoto 30.2K posts
- 12. USS George Washington 17.6K posts
- 13. Wikipedia 63.5K posts
- 14. Grokipedia 81.1K posts
- 15. Victory 156K posts
- 16. Lauer 5,265 posts
- 17. WHAT A GAME 42.8K posts
- 18. Dave Roberts 6,382 posts
- 19. 18 INNINGS 15.7K posts
- 20. Joe Davis 2,341 posts
Bạn có thể thích
-
 Blue Letter Bible
@BlueLetterBible -
 《北美保守评论》NACR
@NAConservative9 -
 空拉罗拉罗 🌈☁️
@badgalkohakurin -
 JarvisFlow
@JarvisFlow -
 缠缠PP
缠缠PP
@MM39901268 -
 Jeff
Jeff
@CaProtecTrading -
 Yeti Wisdom
@MoulinMansion -
 🌴 🅅🄴🄶🄰🅂 🅲🅷🅴🅵 A̾n̾d̾r̾e̾w̾🌴
@ChefDrew702 -
 junjiahhh
@junjiahhh -
 Zach
Zach
@Zach_Zayac -
 Anthony Wang
@bageldogbun -
 中推闲人
中推闲人
@WaVfNw8xW1D9rJe -
 R
R
@DAI35612081 -
 austinjamesgolf
@ajueber -
 Xia Yan
@XiaYan67960980
Something went wrong.
Something went wrong.