
DeepDiveData
@DeepDiveDataZW
Advanced APIs, intelligent visualizations, and transformative narratives. Complexity simplified, intelligence amplified.

📊 Econet’s revenue engine has quietly transformed over 15 years.Airtime kept falling. Data became the core. VAS/SMS reshaped by WhatsApp.And after the Ecocash reintegration, “Other Services” climbed again once peaking at 32% of revenue.A slow, steady shift hidden in plain sight.


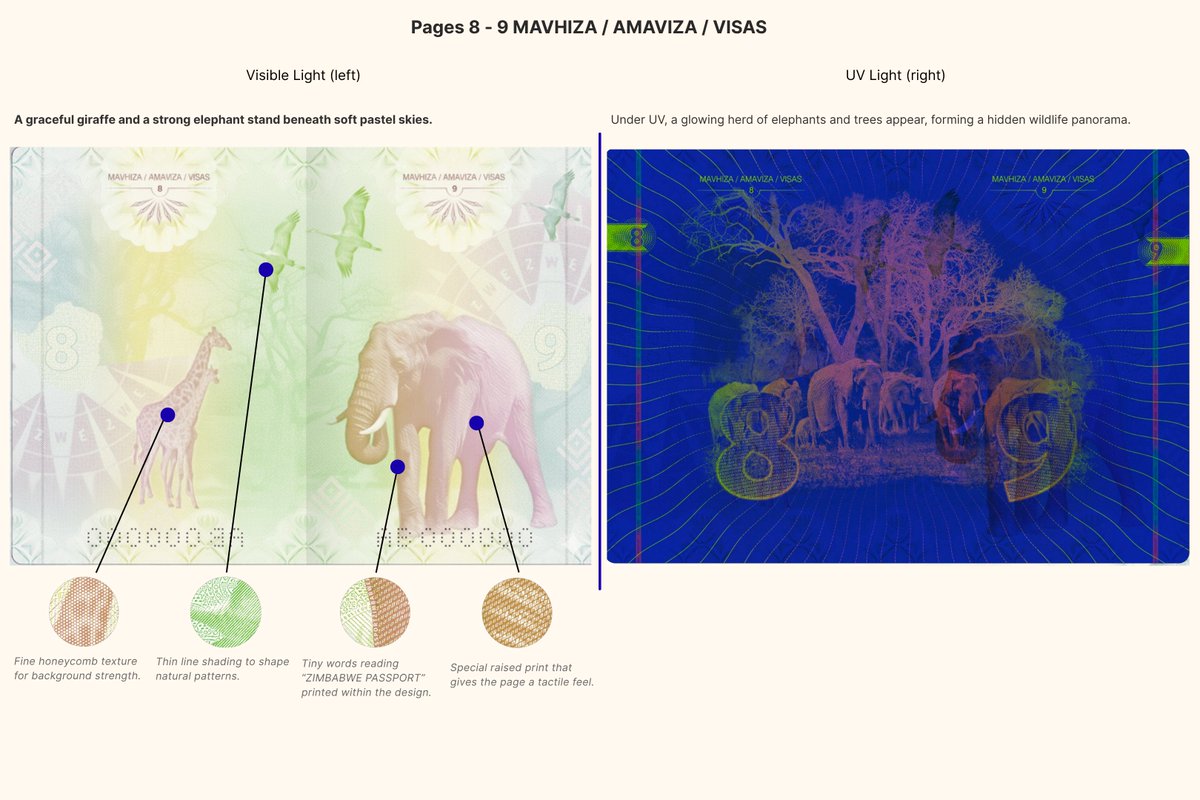
Been buried in Zimbabwe’s digital identity for months. At this point, I could probably give a six-hour lecture on the tech behind it.But honestly? What I keep coming back to is the beauty the art of it.What’s visible, and what only reveals itself under UV light.@DeepDiveDataZW

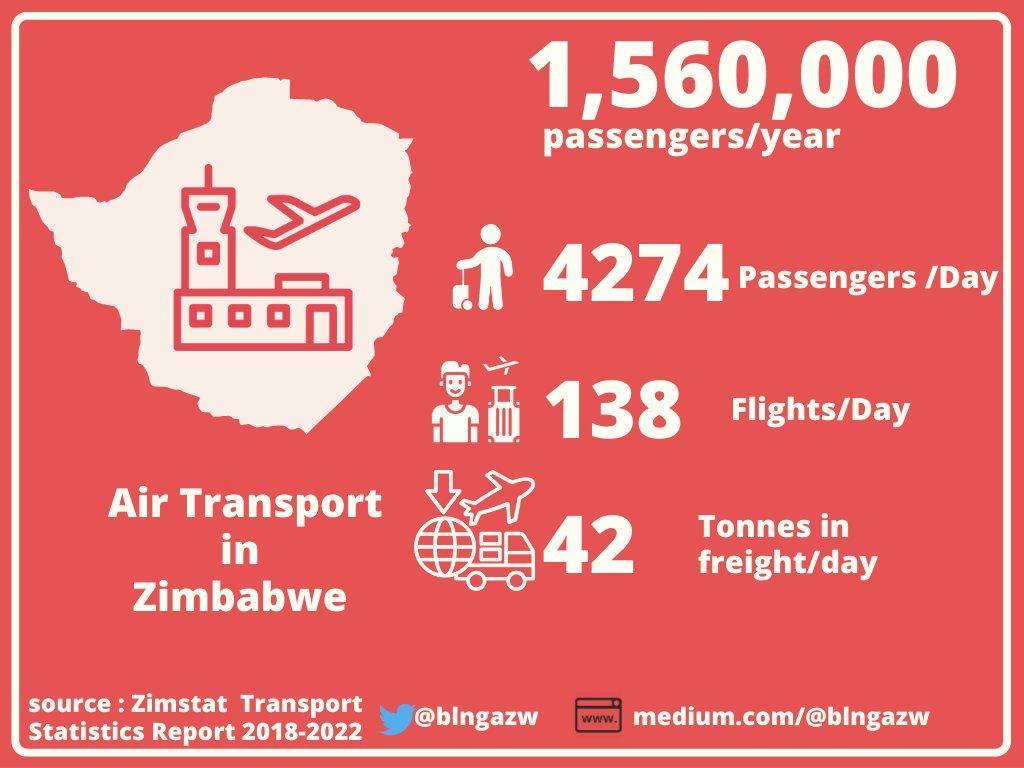
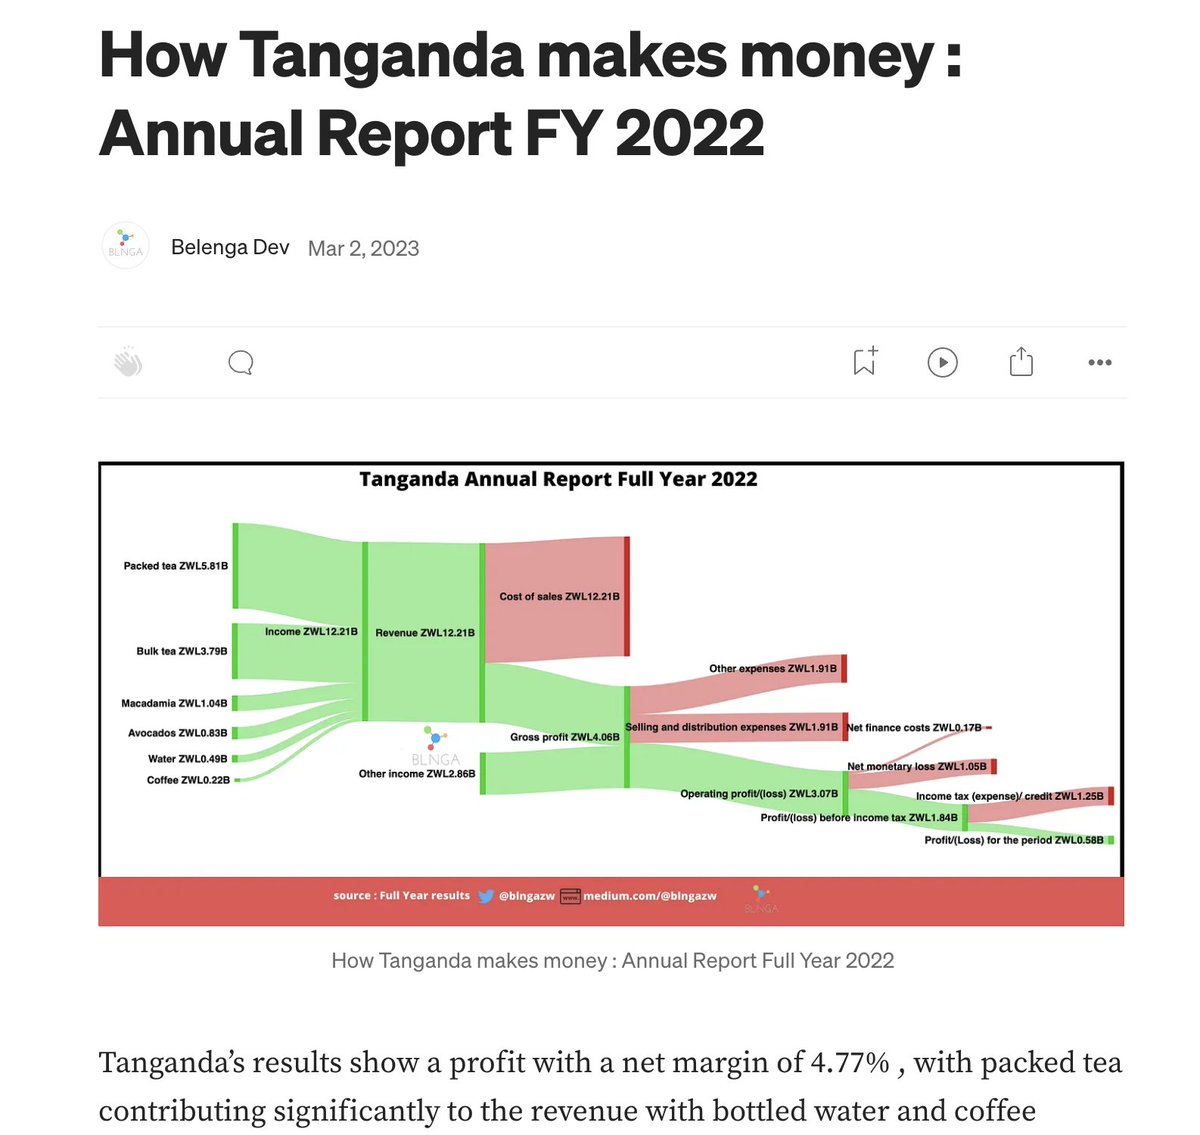
Crazy what 3 years can do — here’s one of the old visuals we started with medium.com/@blngazw/trans… Back then it was static infographics like this. Now the same data powers live dashboards that connect passenger traffic, hospitality, and growth signals across sectors. All built on…
From the same table — no manual plotting — it builds the charts for you: • Passenger throughput • Occupancy recovery (African Sun Ltd) • Segment comparison (City, Resort, Partnership Hotels) Each chart connects airport traffic to hotel performance trends.

Couldn’t resist running that ACZ report through @DeepDiveDataZW’s Insight Workspace. It parsed the image, cross-checked it with ZIMSTAT + ZSE data, and built the charts + business signals below. From Excel sheets to live insights — let me give you a sneak peek. ⚡📊

We’re going live with @MariPodcast to talk smart investing and financial wellbeing in Zimbabwe. 💡 Track your portfolio. 📊 Understand ownership. 📈 Grow with clarity. 🎧 Tune in & catch the exclusive discount link after the Space 👇 #ZSE #VFEX #Finance #ShareholderView
8/🚀 Unlock the Shareholder Directory with Premium ($19.99 / month) Access profiles, track trends, and export ownership data in one place. 👉 Start Free Trial → ShareholderView.com #ShareholderView #ZSE #VFEX #InvestSmart

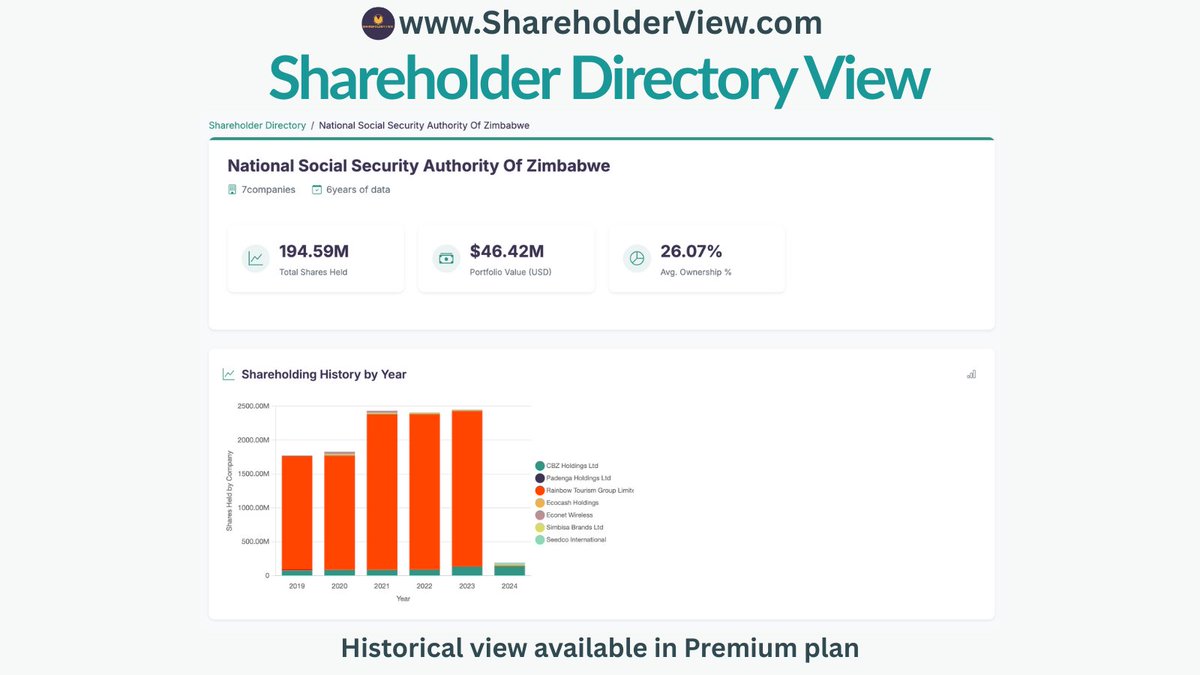
2/ 🍩 The donut is just the start. View top shareholders, concentration percentages, and total shares held — all in one clean chart.

5/ 🕵️♂️ Follow each shareholder’s journey. Track holdings across multiple companies and years — all in one profile.
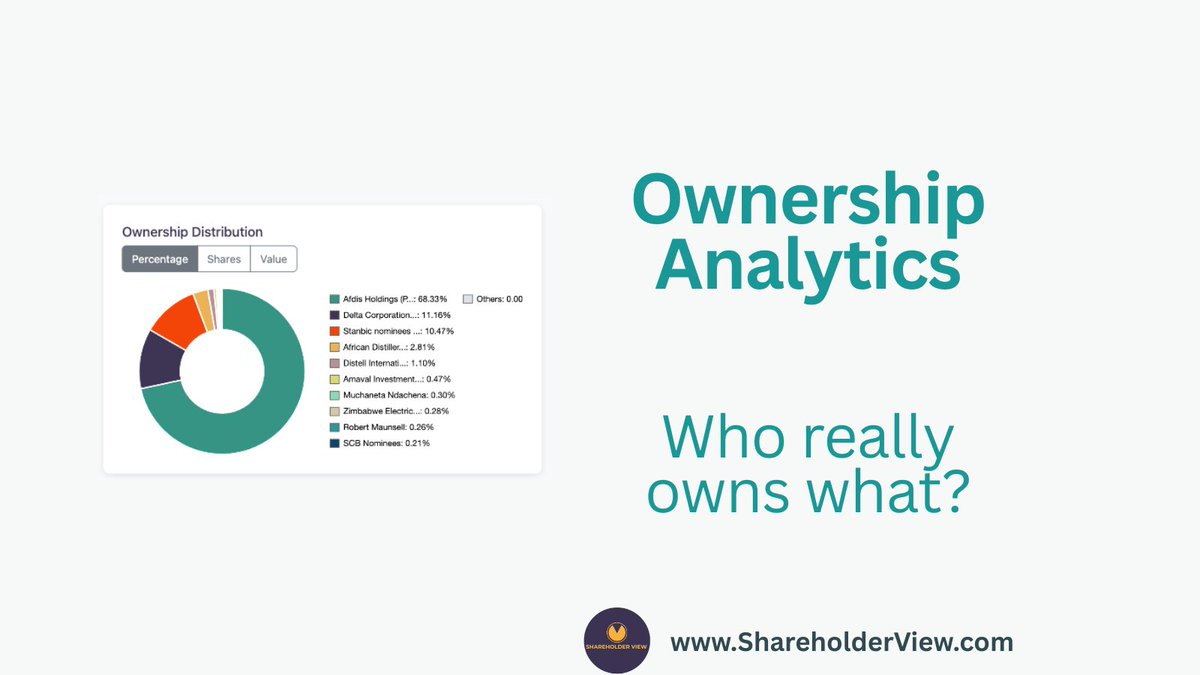
2/📊 See ownership distribution instantly

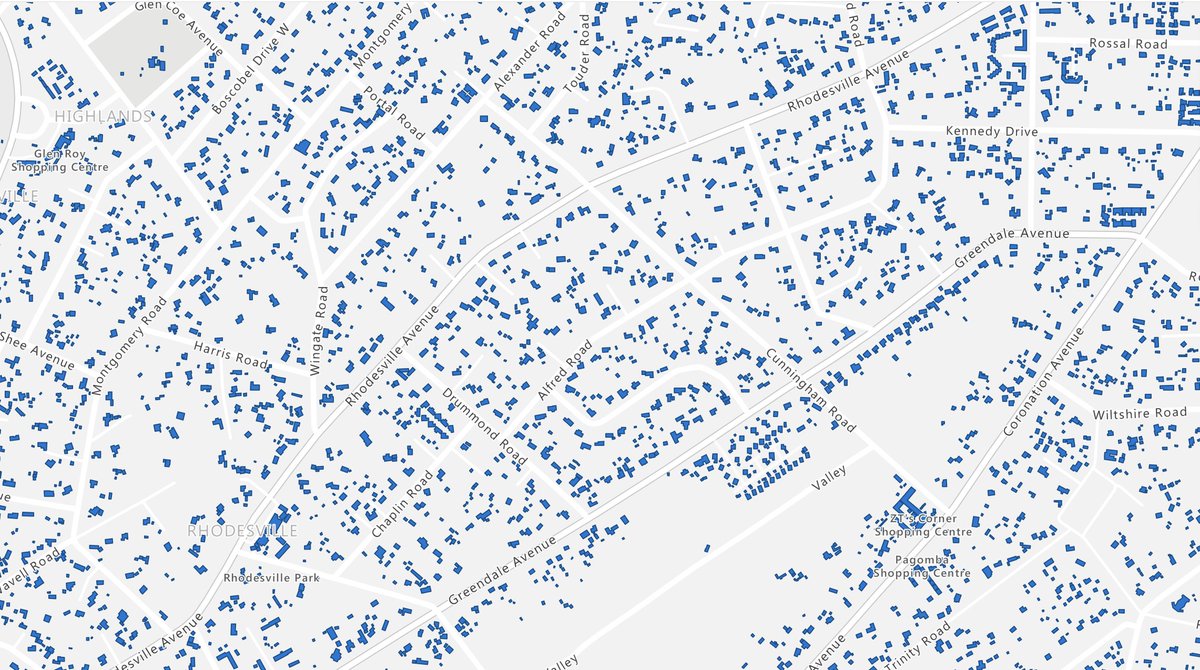
2/4: Greendale Road Urban densification, like the trend seen along Greendale Road , is the root cause. Houses are converting into high-density complexes, multiplying the number of users in the same coverage area. Here an increase in households = increase in devices. The…

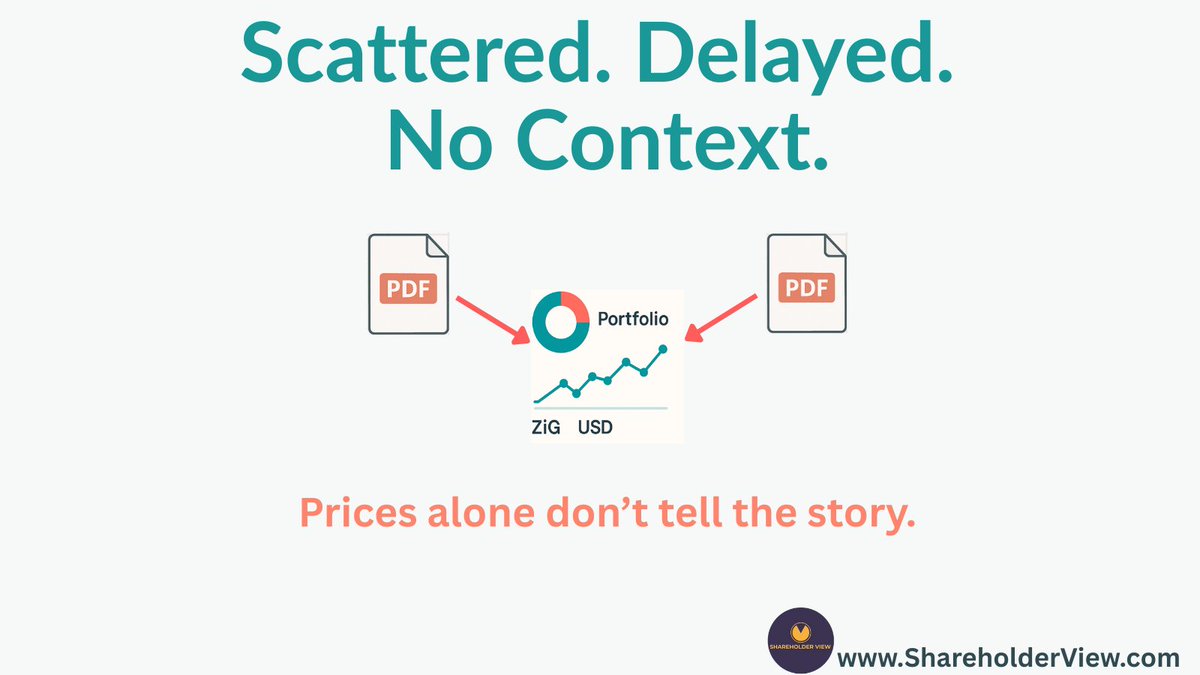
2/ On ZSE & VFEX, data is scattered and delayed. Spreadsheets break. PDFs are endless. Numbers alone don’t give clarity.
1/ Share prices go up. They go down. But here’s the real question: 👉 What does that mean for your portfolio? Okay the price moved. But without context, you don’t know if you gained, lost, or stood still.
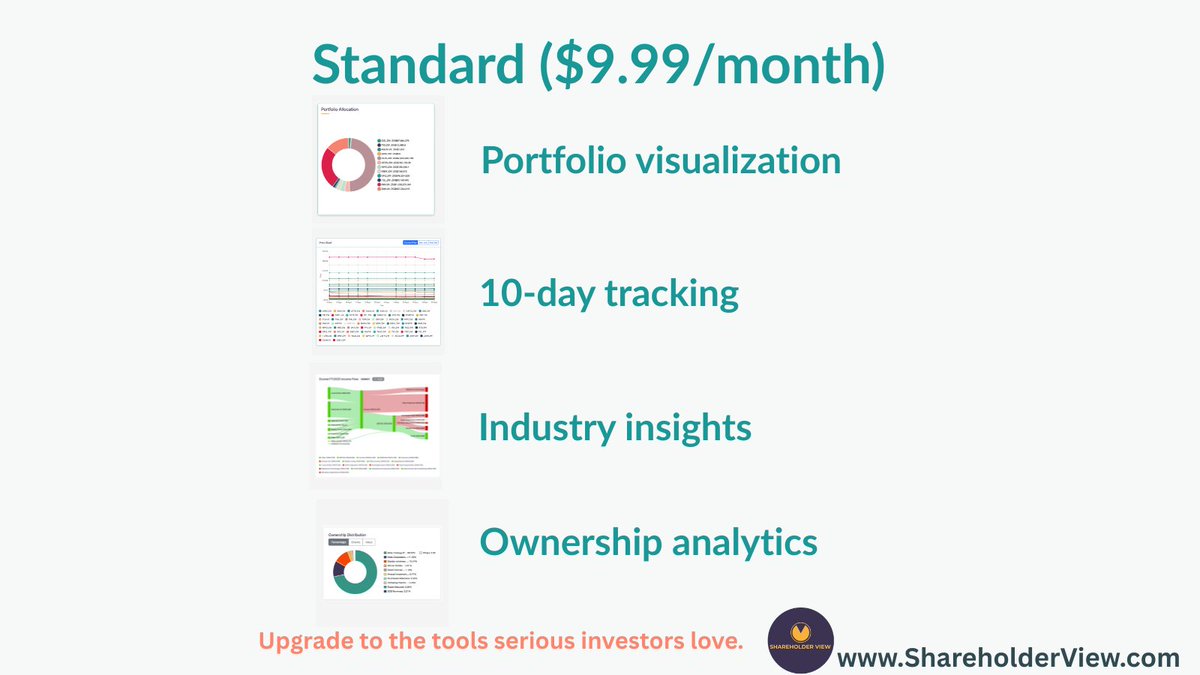
3/ 🔥 Standard — $9.99/month (Most Popular) Interactive portfolio visuals 10-day tracking Industry insights Ownership analytics Market heatmaps Best for active investors who want actionable insights.
1/ 💡 Which ShareholderView plan is right for you? We’ve built 3 simple options for ZSE & VFEX investors from quick snapshots to full research power. 👇 Here’s the breakdown:

5/ 👥 Ownership Analytics → Who really owns what?
Update From quick CSVs → Canva visuals… to a structured DB powering interactive charts 📊 Next: 👉 “talk to” 5 years of ZSE financials — chart by chart, metric by metric. Follow along as we roll this out. To get started, enjoy 50% off with code HARV 🔗 shareholderview.com/pricing.html?c…


💡 In case you’ve been wondering what all the discourse around SmartBiz is about… This chart compares cost per GB vs package size across Econet’s SmartBiz, SmartSuite, Private WiFi bundles, plus other providers. 📊 Source: @Techzim 👉 The spread is wild: the cheapest option…

I became an Indrive driver in Harare—not just to drive, but to study the system and the city's rideshare transport system from the inside. As a data analyst, I deconstructed the app and workflow. In my 2-hour masterclass (5 seats only), I'll share what I found: How the app's…


United States Trends
- 1. $ENLV 3,760 posts
- 2. Jimmy Cliff 11.3K posts
- 3. Good Monday 40.6K posts
- 4. #MondayMotivation 10.2K posts
- 5. TOP CALL 4,147 posts
- 6. Victory Monday 2,333 posts
- 7. AI Alert 2,052 posts
- 8. The Harder They Come 1,341 posts
- 9. #IDontWantToOverreactBUT N/A
- 10. Happy Thanksgiving 11K posts
- 11. Market Focus 2,920 posts
- 12. #MondayMood 1,364 posts
- 13. Check Analyze N/A
- 14. Token Signal 2,532 posts
- 15. #MondayVibes 2,722 posts
- 16. DOGE 201K posts
- 17. $NVO 2,469 posts
- 18. Monad 136K posts
- 19. SAROCHA REBECCA DISNEY AT CTW 780K posts
- 20. #NoNeedToSay_MV 73.7K posts
Something went wrong.
Something went wrong.