
Dylan Difford
@Dylan_Difford
YouGov data journalist • Elections, polls, voting systems • "I like people, places and things"
Flow of the vote, 2019-24, provisional version (will wait for the BES data to be released to make a final version, plus some deeper cuts).

Ultimately, the key story of this election is the crumbling of the two main parties - who now hold the fifth and sixth worst defence rates in modern local elections (68% for Cons, 65% for Labour). Only UKIP implosion years and post-1979 SNP were worse.

Seen some draw parallels between Reform and UKIP, but they are just different beasts. Not just do Reform have a stronger projected share than peak-UKIP (30% and 10pt lead vs 23% and 7pt trail), but their gains (41% of all seats) are seven-fold UKIP's best (6%, 2013).
It's a good year for the Lib Dems, with total gains representing almost exactly 10% of all seats fought, making it proportionally their best set of locals since 1993 and their second-best since local government reform in the 1970s.

Indeed, when instead looking at the government's defence rate, it is clearer the scale of Labour's losses. In net, they lost 65% of their defences, well above the average 16% loss for governments and eclipsing their 64% loss rate in 2009, the year before the last lost power.

The other hand to Reform's gains are the Tories' horrific losses (41% of all seats). Not just poor for the opposition, but relative to total seats, it is the worst set of local election results for any party in British history, surpassing the Tory result in 1971 (38%).

🧵 / The 2025 local elections in historical perspective Reform's gains were undeniably seismic, shaking the party system to its core and central to a level of turnover unseen in any post-reform local elections. The net partisan churn is 54%, approaching double 1981's 30%.
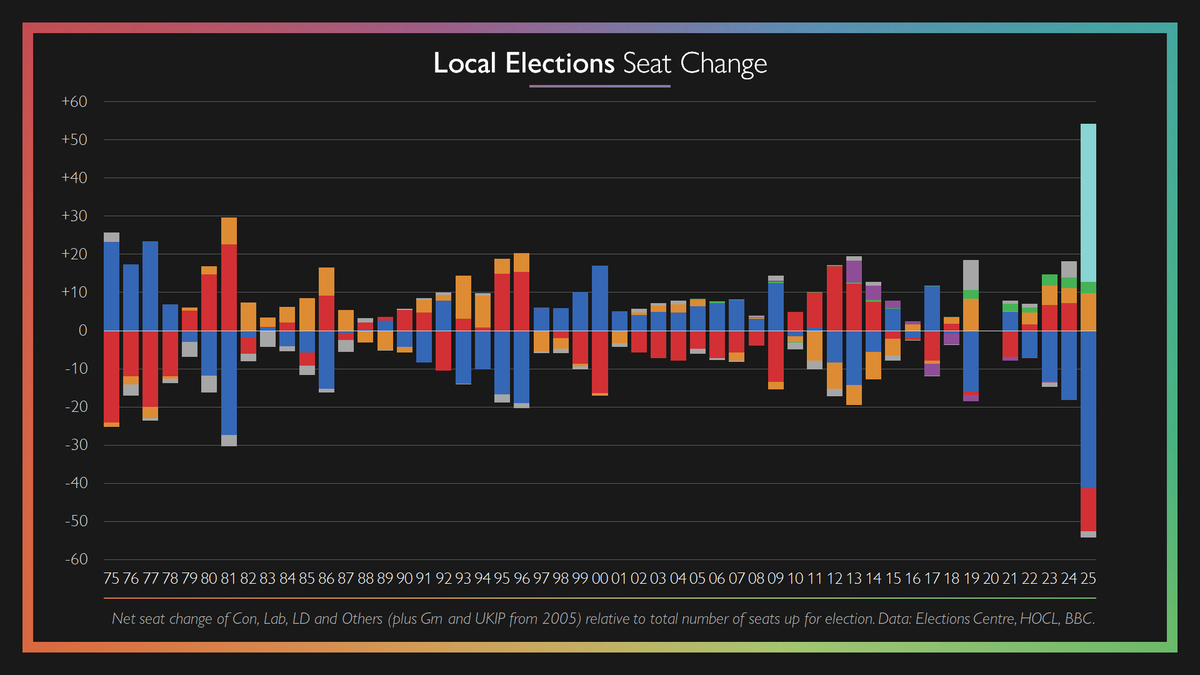
With around 100 seats (6%) left to declare, even if the Conservatives win every single won, they would still have had the worst performance of any party in local elections in the last 50 years (by losses as a % of total contests).
Anyone telling you there's anything normal about these local elections is talking out their arse. Below, gains and losses as a proportion of total contests in every set of locals in the last 50 years - provisional numbers, based on 62% of seats declared.

Local election thresholds* for the Conservatives: -173: Worst result for a principal opposition party in last 50 years -295: Worse result than last year -449: Worst result for Conservatives or Labour in last 50 years * Equalised to total seats contested
Feels like 'dishonest reporting' is an understatement here. It's downright misreporting to be so declarative about a view held by less than one in three Britons, especially when it's presumably not even the plurality response. Similarly poor for the BBC to credulously repeat it.

This has to be the most dishonest reporting of an opinion poll I've ever seen The survey actually found that over two thirds of voters *do not* think Starmer will be out of No 10 within a year.


While Olaf Scholz will almost certainly be the shortest-serving German chancellor in 55 years, he will have served longer in office than five of the last six British PMs.


United States Trends
- 1. #GivingTuesday 20.6K posts
- 2. #twitchrecap 4,643 posts
- 3. Costco 45.4K posts
- 4. #AppleMusicReplay 6,980 posts
- 5. Jared Curtis 1,663 posts
- 6. Susan Dell 4,798 posts
- 7. #csm222 5,093 posts
- 8. #DragRace 1,966 posts
- 9. Lucario 21.5K posts
- 10. NextNRG Inc. 2,357 posts
- 11. RIP Larry N/A
- 12. King Von 1,452 posts
- 13. Michael and Susan 3,229 posts
- 14. Trump Accounts 11.2K posts
- 15. Carton 29K posts
- 16. BT and Sal N/A
- 17. WFAN N/A
- 18. Tiki 2,771 posts
- 19. Georgia to Vanderbilt 1,382 posts
- 20. Pentagon 77.6K posts
Something went wrong.
Something went wrong.