
list was always going to be smaller with the smaller total player size at TE, but I did the same for TE (different paramerters) and I kind of love the list. TE's that fit the mold of breakout (increase of 7+ PPR/G). Again, no stats should ever be taken without considering context

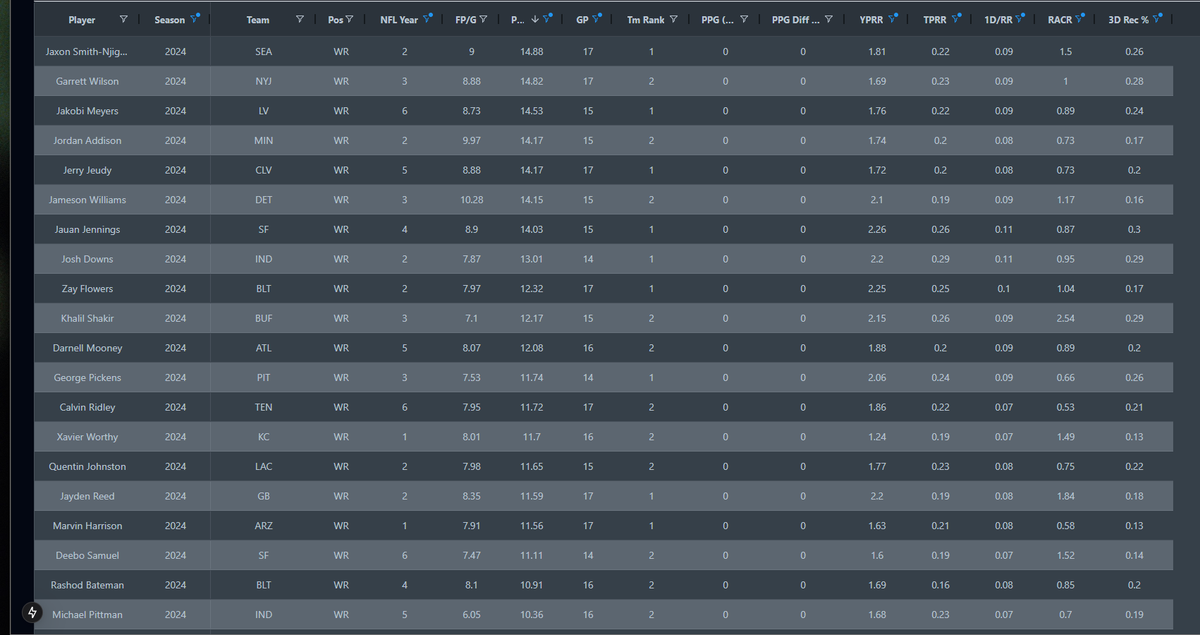
WRs who fit the mold of 7+ PPG increase from previous year based off past WRs who have in TPRR, YPRR, 1D/RR, 3D target %, and RACR. The point is to not just blindly see player, buy player. It's a honed list to ask which of these players has the proper context in 2025. 2 pics
What I like most here is it was tuned to historic metrics without my bias coming in. the top guys obviously ADP says huge years are possible and I agree. Laporta smashed after usage changed mid year last year. Kraft & Likely have amazing per touch numbers, just need volume
United States Trends
- 1. South Carolina 28.7K posts
- 2. Texas A&M 27.6K posts
- 3. Shane Beamer 3,780 posts
- 4. Ryan Williams 1,309 posts
- 5. Michigan 44.5K posts
- 6. Sellers 13.9K posts
- 7. Ty Simpson 1,733 posts
- 8. Northwestern 7,282 posts
- 9. Marcel Reed 4,832 posts
- 10. Heisman 7,336 posts
- 11. #EubankBenn2 10.8K posts
- 12. #GoBlue 3,862 posts
- 13. Oklahoma 18.5K posts
- 14. Sherrone Moore 1,037 posts
- 15. Underwood 3,931 posts
- 16. Mateer 1,328 posts
- 17. College Station 2,966 posts
- 18. #GigEm 2,173 posts
- 19. Nyck Harbor 3,437 posts
- 20. Elko 5,382 posts
Something went wrong.
Something went wrong.