
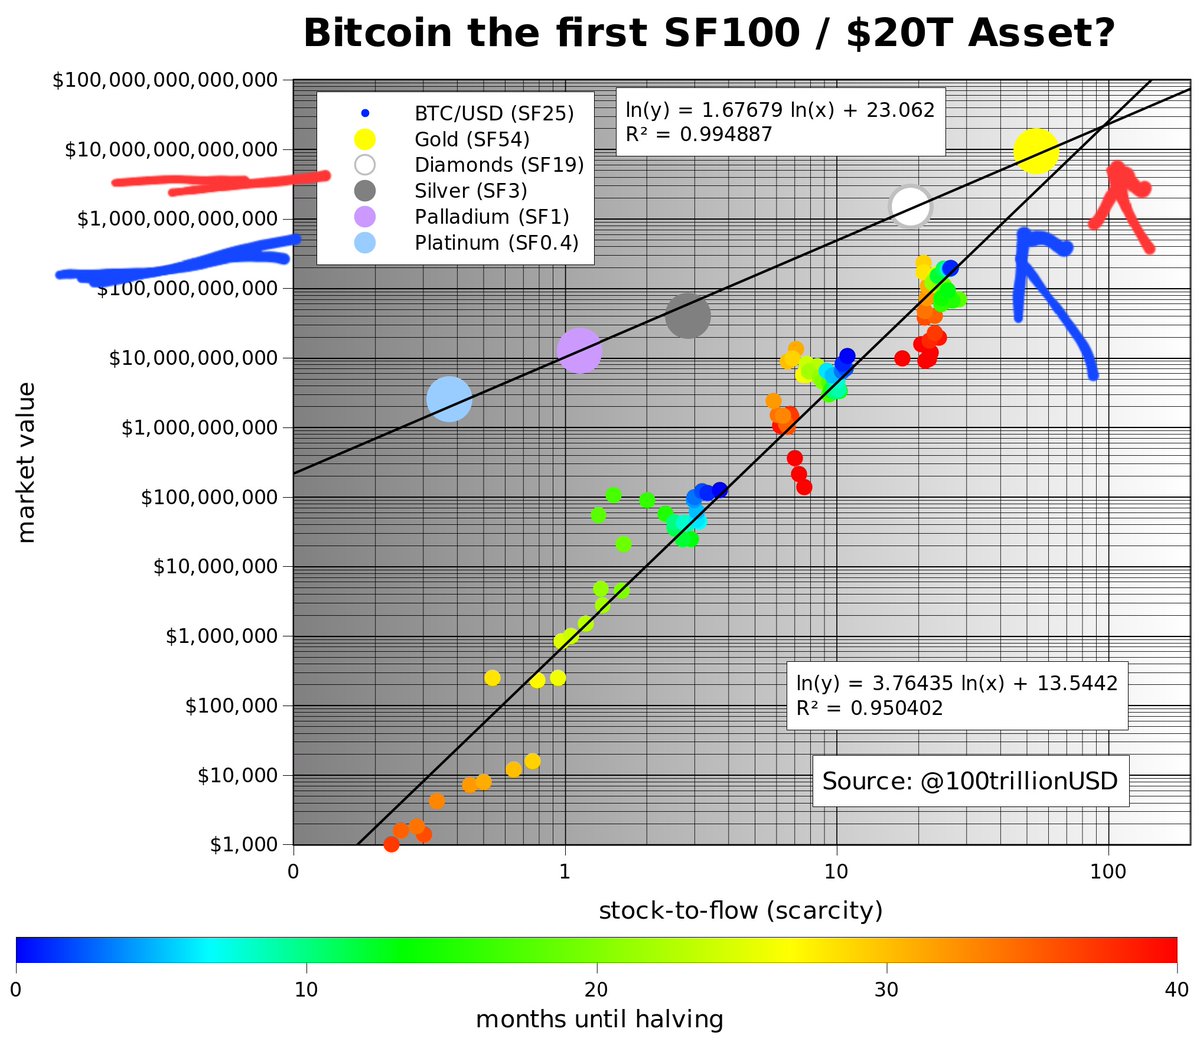
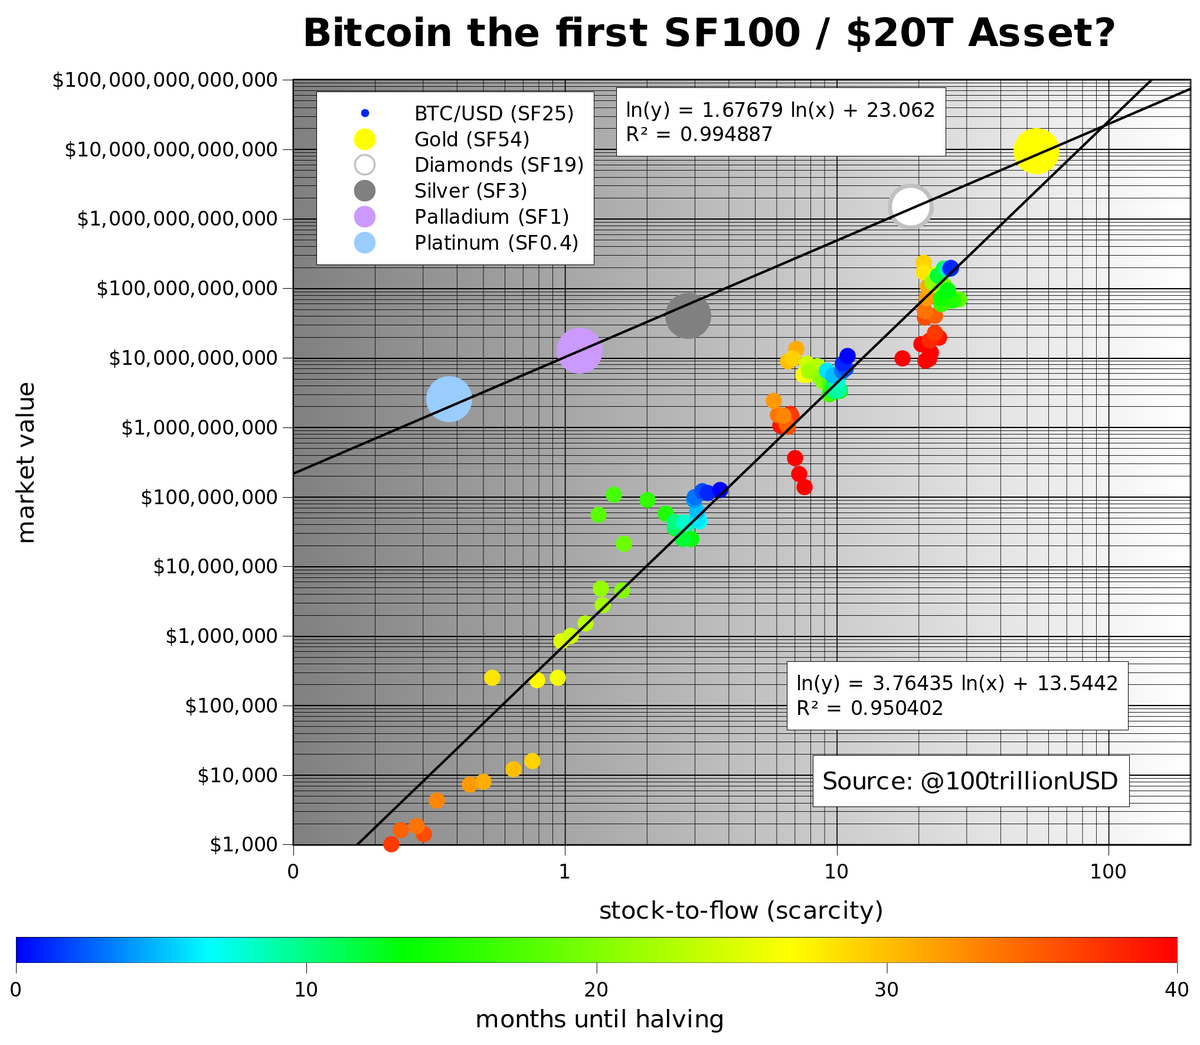
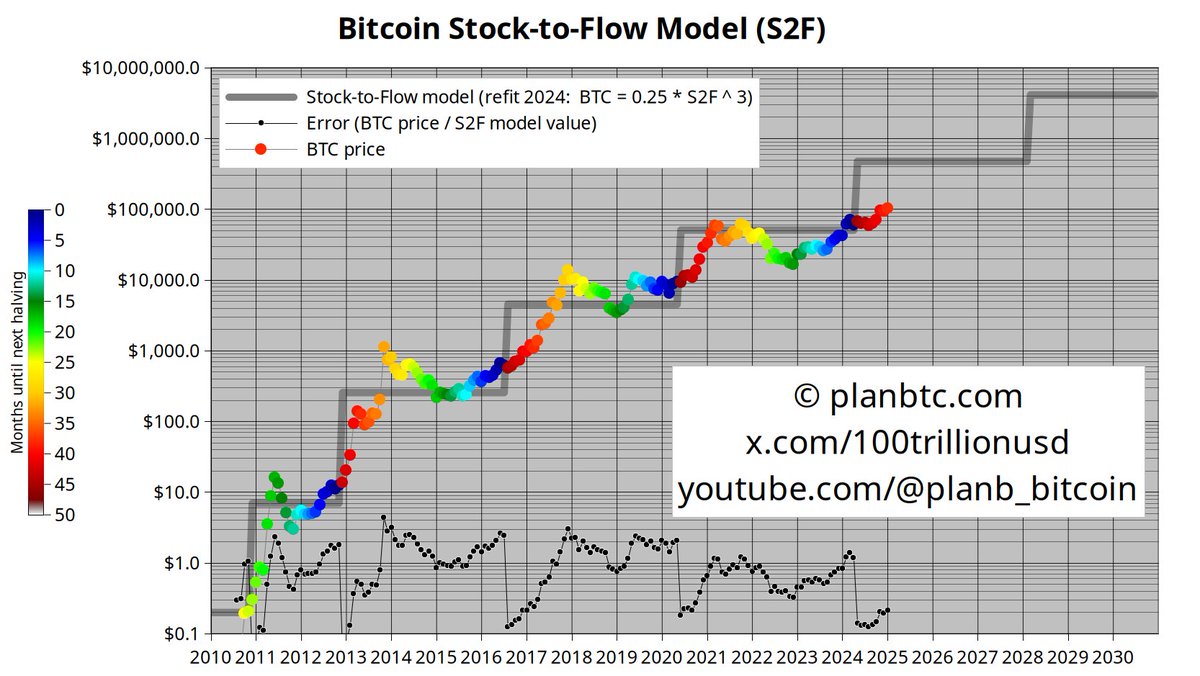
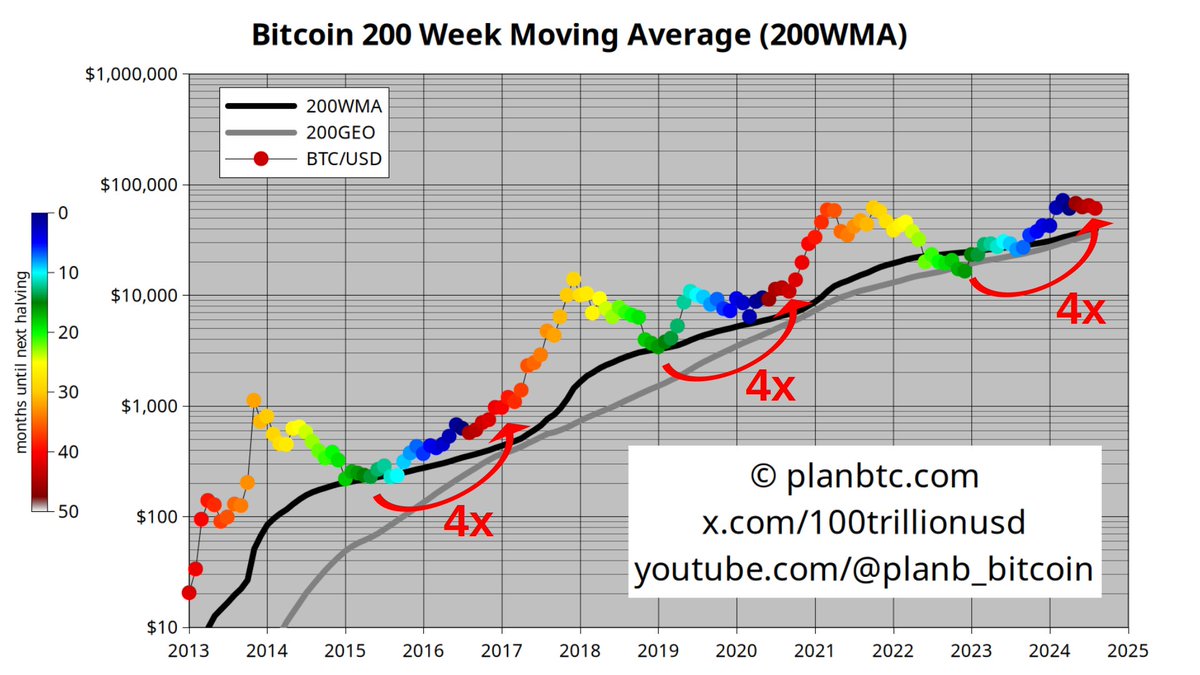
My view has not changed since 2019. In 2019 btc market cap was $100B ($5k btc). This chart said btc mcap would grow to $1T ($50k btc) in 2020-2024 halving period (blue arrow). It did. The same chart shows $10T mcap / $500k btc for 2028 (red arrow). That is still my view.


JUST IN: 🇺🇸 Senate Banking Chair Tim Scott said he aims to have committees vote on the crypto market structure bill next month. Bullish 🚀

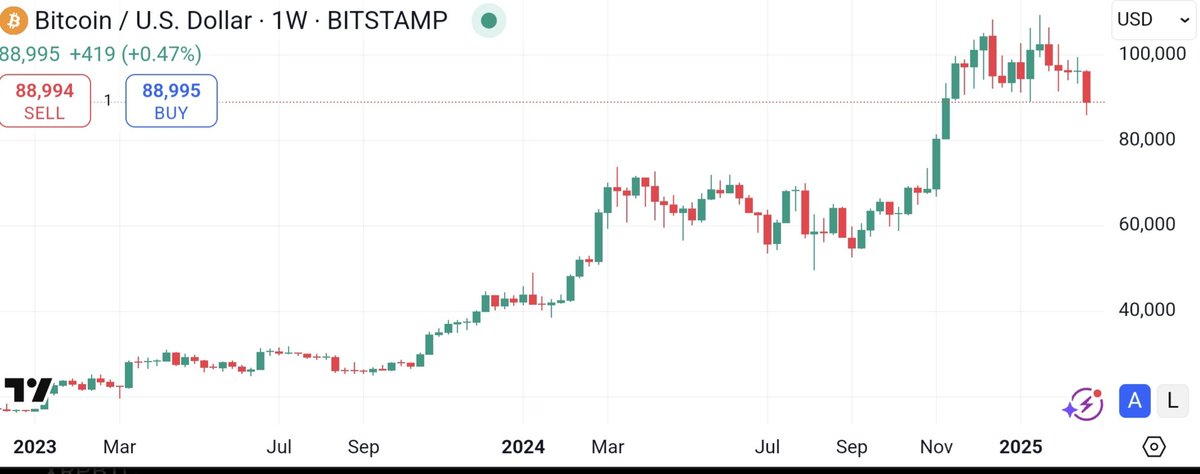
Now that you are all freaking out about some 50 week moving average .. .. this Oct 2019 tweet (when BTC was $8k, and most people were freaking out about miner capitulation after 2020 halving, and I was predicting $55k) feels relevant.
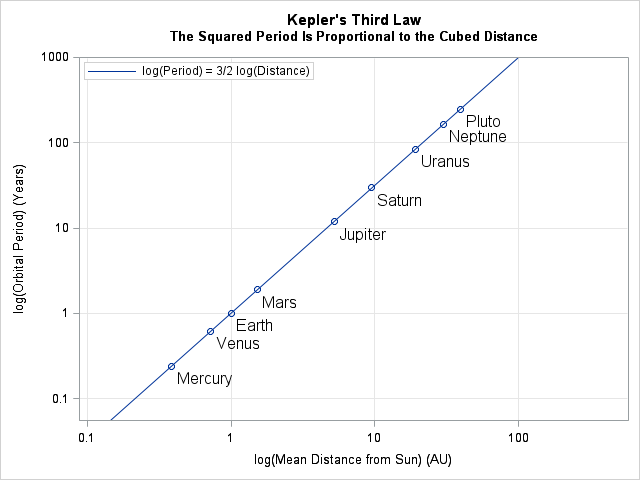
A stock-to-flow 100 asset, being worth less than gold ... is like a planet 100 astro units from the sun, rotating faster around the sun than Pluto
JUST IN: 🇯🇵 Japan’s FSA plans to classify #Bitcoin and crypto as financial products, lowering the tax on crypto gains from 55% to 20%. Bullish 🚀


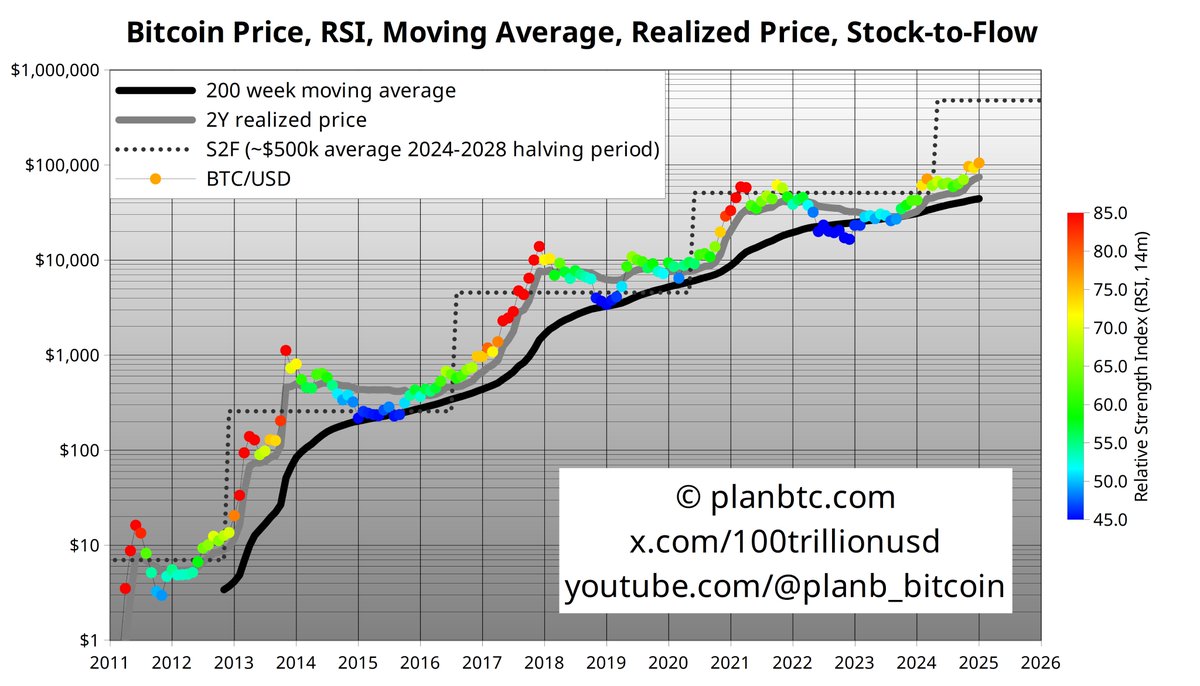
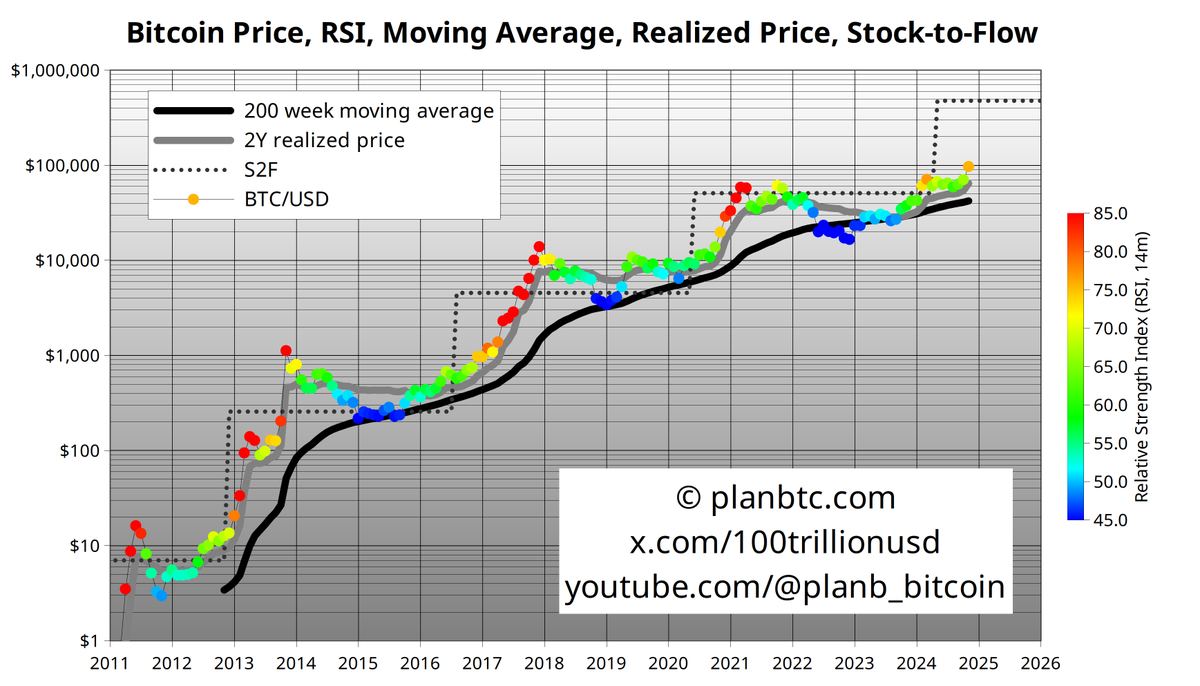
Only constant in human action is greed & fear (in the chart: RSI color overlay). IMO greed (red) will return. Scarcity (in the chart: S2F dotted line) is a fundamental driver of value, together with other factors. Bitcoin is scarcer than gold. IMO mcap BTC will be > mcap gold.
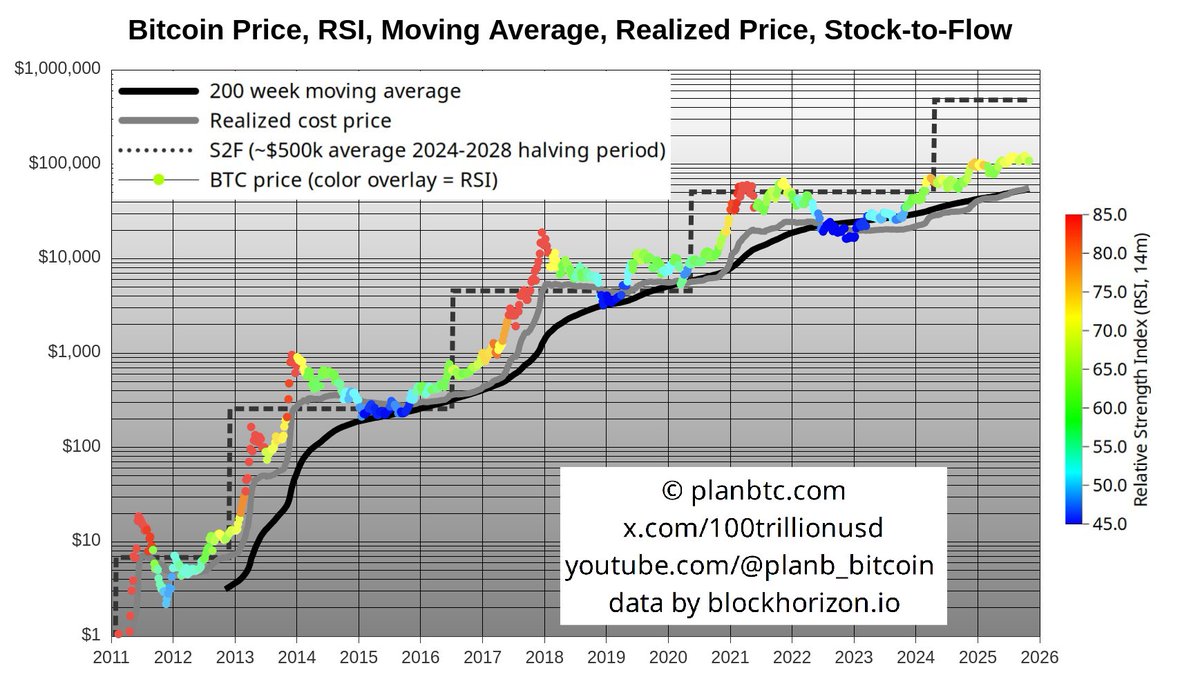
Bitcoin 200 week moving average (black line) is diverging from the 200 week geometric mean (grey line) indicating the bull market is building, just like in 2013, 2017 and 2020/2021. My view on current bull market: 👉youtube.com/watch?v=VqNA3V…

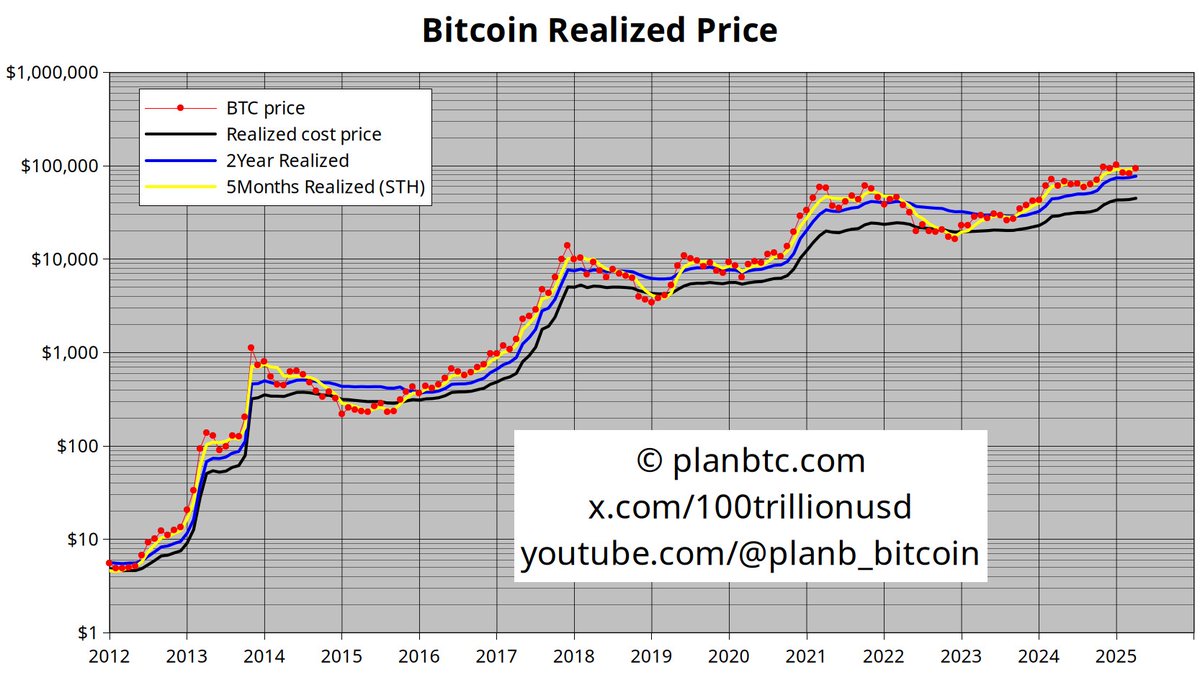
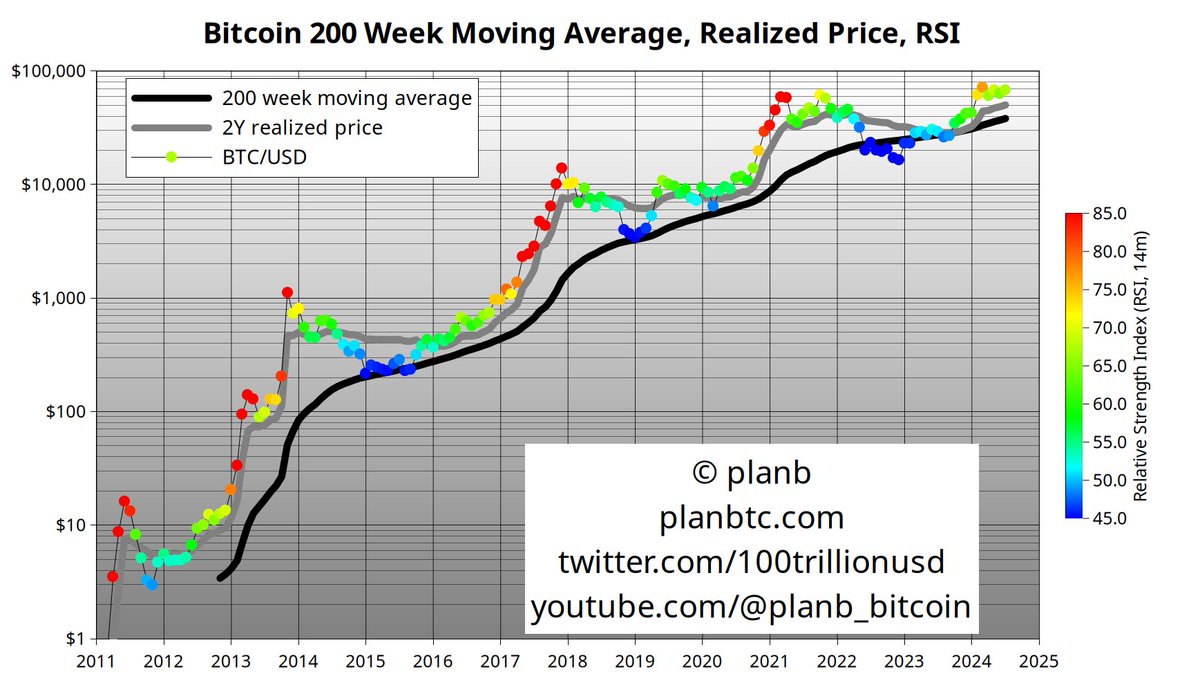
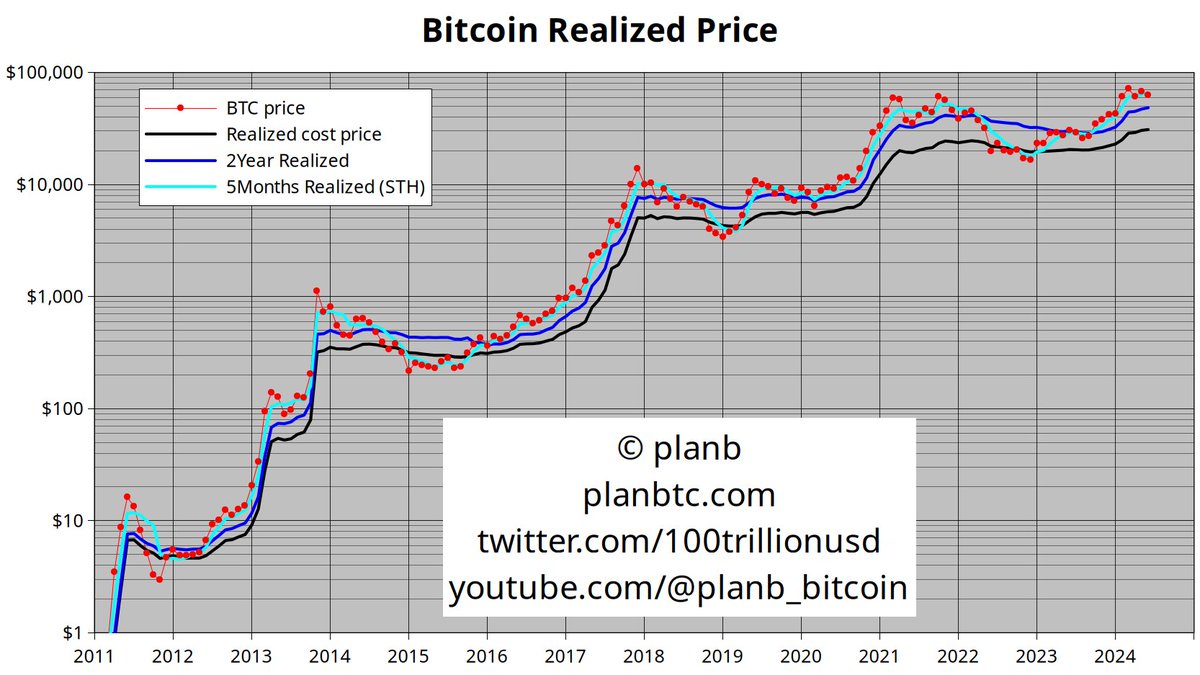
Realized price up 2-year realized price up 5-month realized price up Bitcoin price higher than all realized prices Bull market continues🚀

If we see a V-shaped recovery after this dip (next week or so), then that confirms that we are still in a bull market. Bull markets are full of -20% -30% dips, followed by sharp V-shaped recoveries.
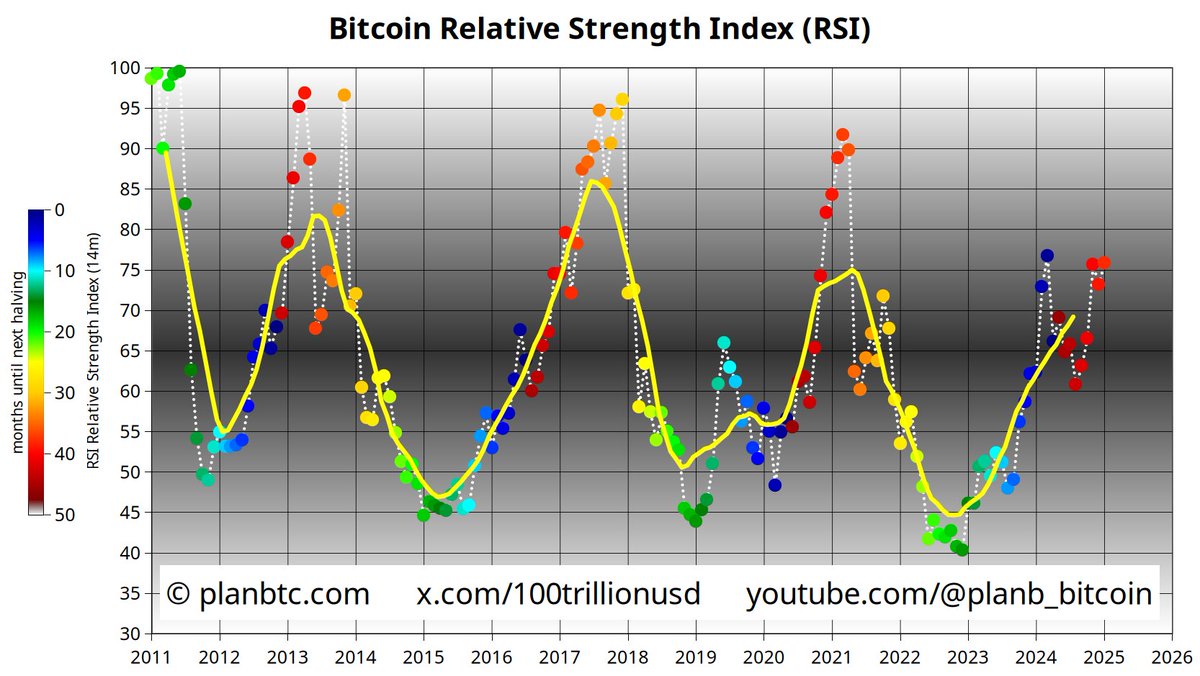
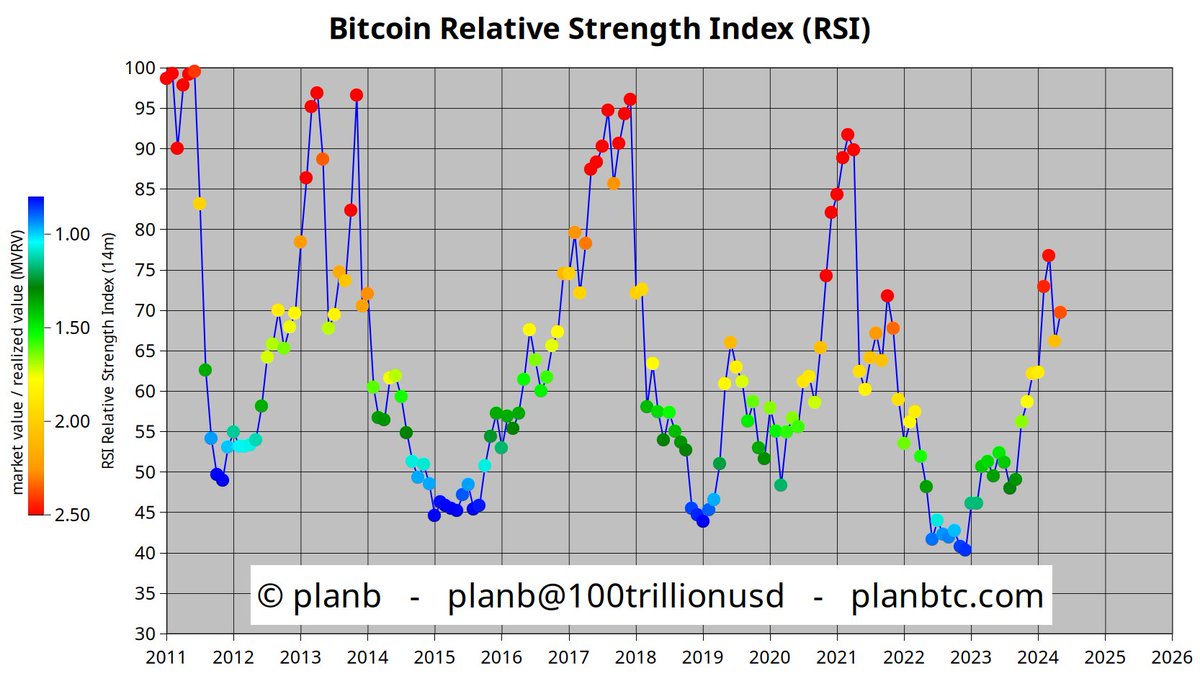
Previous bull markets (2013, 2017, 2020/21) had multiple months with RSI 80+ (red dots in chart below). IMO we will see at least 3 red dots (RSI 80+) in this 2025 bull market. Historically monthly return in red dots is 40%+. $100k*1.4^3=~$270k More info: m.youtube.com/watch?v=CJrG1v…
Bitcoin January closing price: $102,412 .. NEW monthly close ATH and first monthly close above $100k!! planbtc.com
Bitcoin is getting stronger (RSI=76)🚀 99% of traditional finance has absolutely no idea what is happening. We are so early.
💥NEW CHART: combining bitcoin price, RSI, 200WMA, Realized price and S2F in one chart. My analysis of this chart here: youtube.com/watch?v=-Dpxkw…
Bitcoin September close: $63.302 8th month in the 60k-70k trading range ...
Bitcoin $60k .. up ~4x from the bottom. Just like before the pump in 2017 and 2020/2021🚀
Yes yes, German government is selling 50,000 btc (10,000 already sold), and Mt.Gox is giving 142,000 btc back to investors (some may sell) ... however I see nothing in the data that indicates structural weakness in bitcoin markets. My btc market analysis: m.youtube.com/watch?v=WeU2OQ…
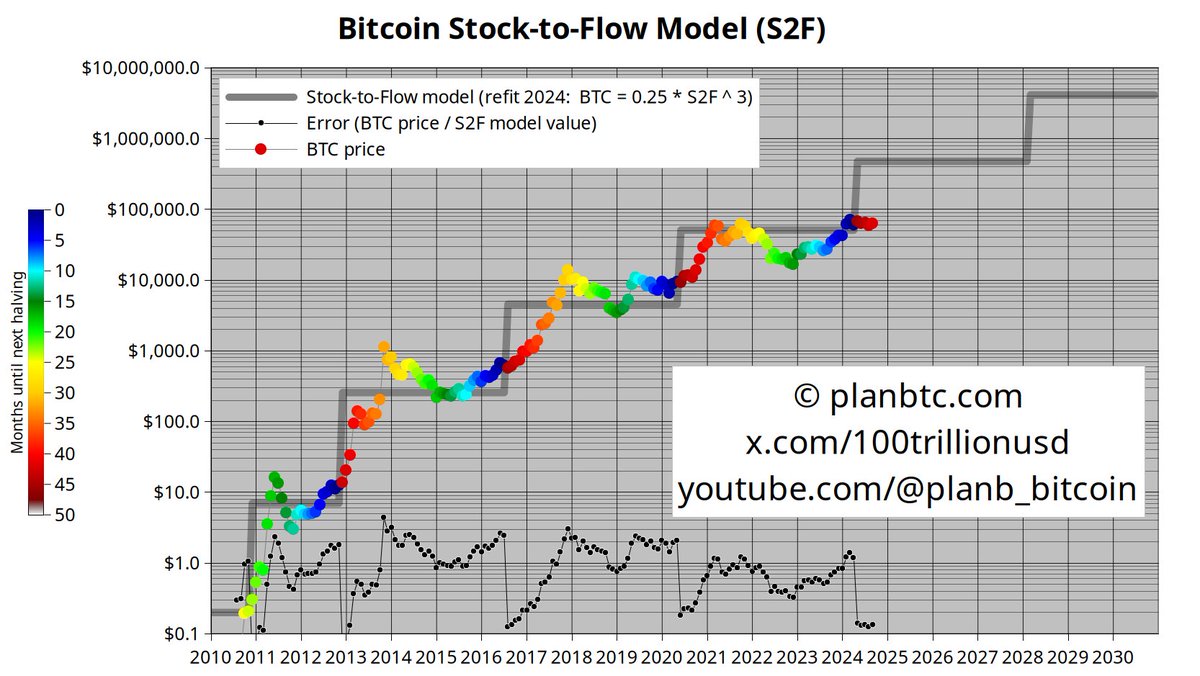
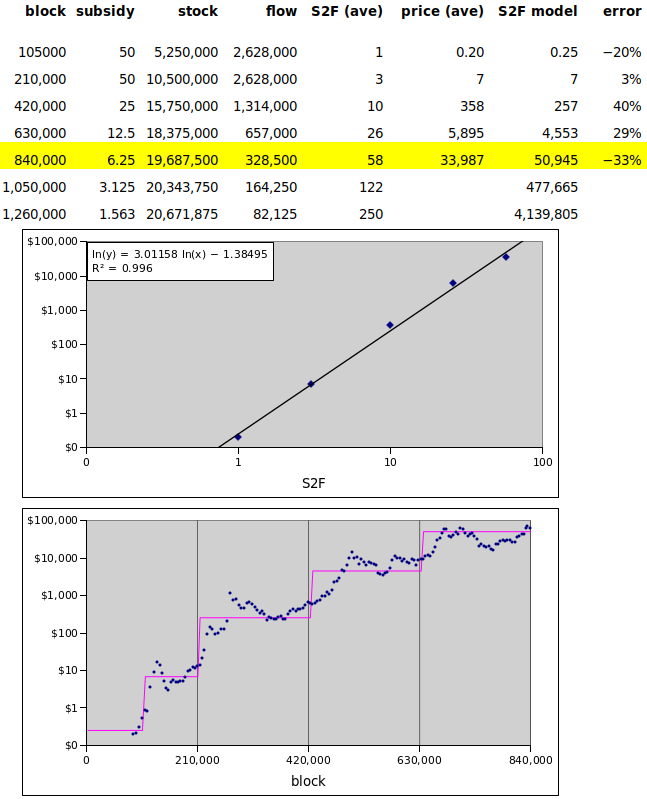
I refitted 2019 S2F model with 5y new data. I also simplified (halving cycle average instead of monthly, no Satoshi coins) to make it easily understandable. Result: almost same parameters (BTC=0.25*BTC^3) and predictions: 2024-2028 ~$500k, 2028-2032 $4m. m.youtube.com/watch?v=67eetL…


![dogecoin's profile picture. Dogecoin is an open source peer-to-peer cryptocurrency, favored by shibas worldwide. Elon Musk thinks we're pretty cool. [RTs are not endorsements]](https://pbs.twimg.com/profile_images/378800000857919980/lHqPIZza.png)


United States Trends
- 1. Super Bowl N/A
- 2. Drake Maye N/A
- 3. Seahawks N/A
- 4. Patriots N/A
- 5. Puerto Rico N/A
- 6. Sam Darnold N/A
- 7. Kid Rock N/A
- 8. TPUSA N/A
- 9. Rams N/A
- 10. Lady Gaga N/A
- 11. Pats N/A
- 12. Benito N/A
- 13. Broncos N/A
- 14. Campbell N/A
- 15. Pepsi N/A
- 16. Ricky Martin N/A
- 17. Diggs N/A
- 18. Latino N/A
- 19. Jason Myers N/A
- 20. Kenneth Walker N/A
Something went wrong.
Something went wrong.