
Take control of your independent stock analysis with Graphin.co powerful tools. Use code SOLO35 to save 35%!

NVIDIA’s Net Income Surge! The chart speaks for itself – an unprecedented spike in $NVDA net income, reflecting massive growth in AI and semiconductor demand. Heads up: This Wednesday, February 26, NVIDIA reports earnings. Will the explosive growth continue?
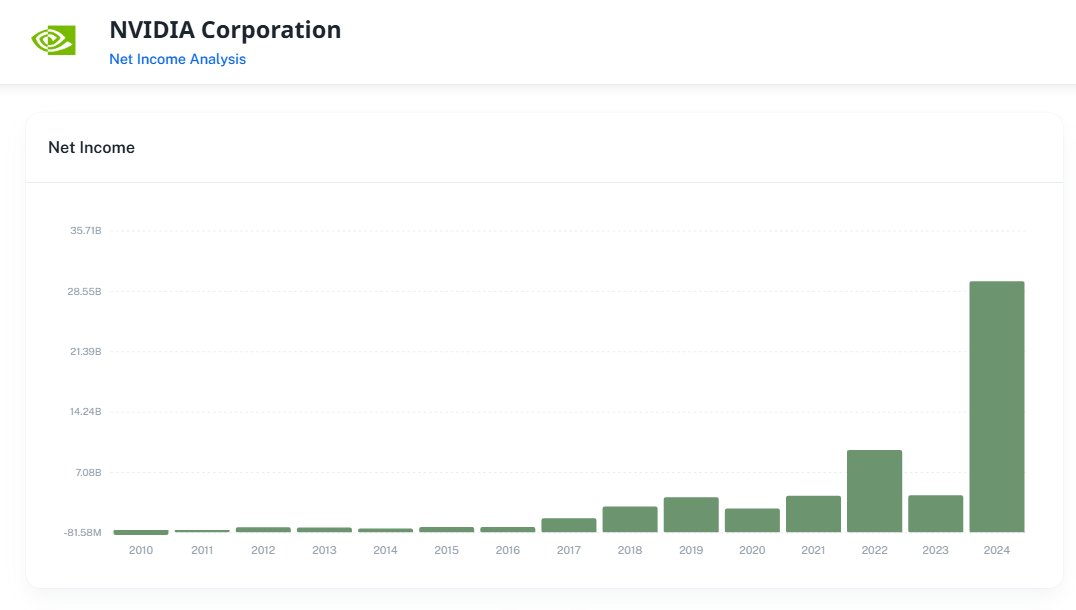
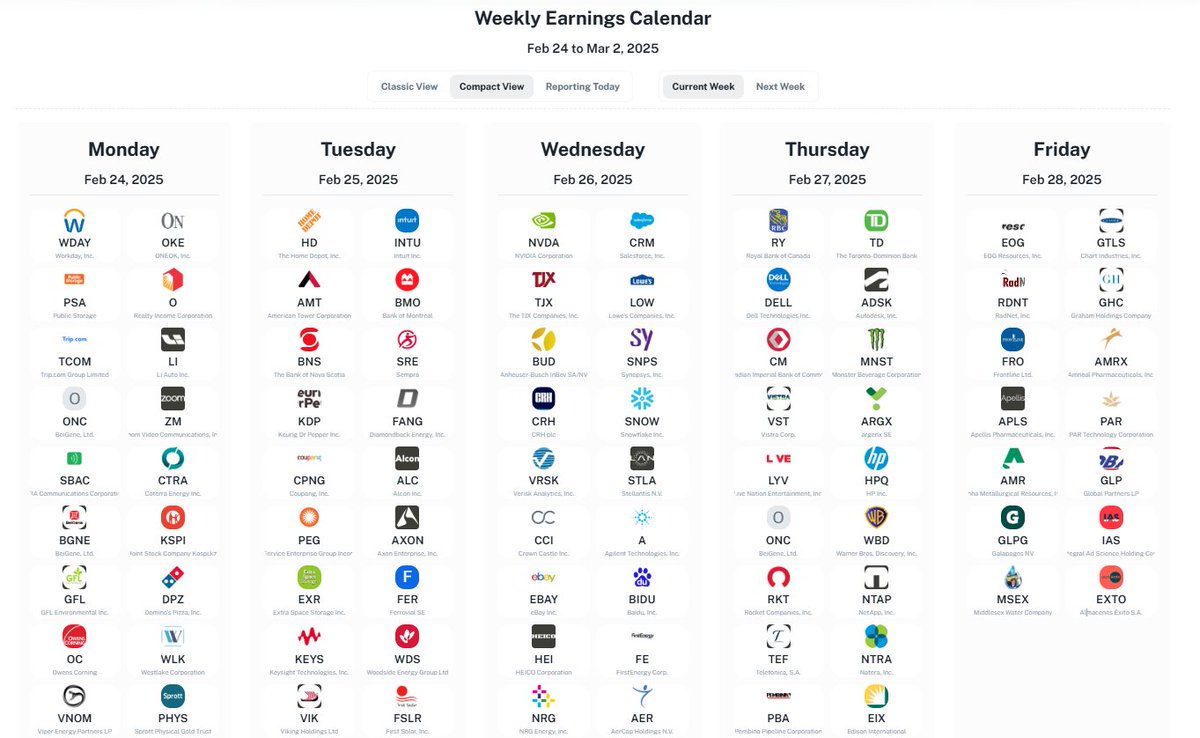
Key Earnings Reports This Week: Monday (Feb 24): $WDAY, $OKE, $PSA, $TCOM Tuesday (Feb 25): $HD, $INTU, $AMT, $BMO, $BNS Wednesday (Feb 26): $NVDA, $CRM, $TJX, $LOW, $SNOW Thursday (Feb 27): $RY, $TD, $DELL, $ADSK, $CM Friday (Feb 28): $EOG, $GTLS, $RDNT
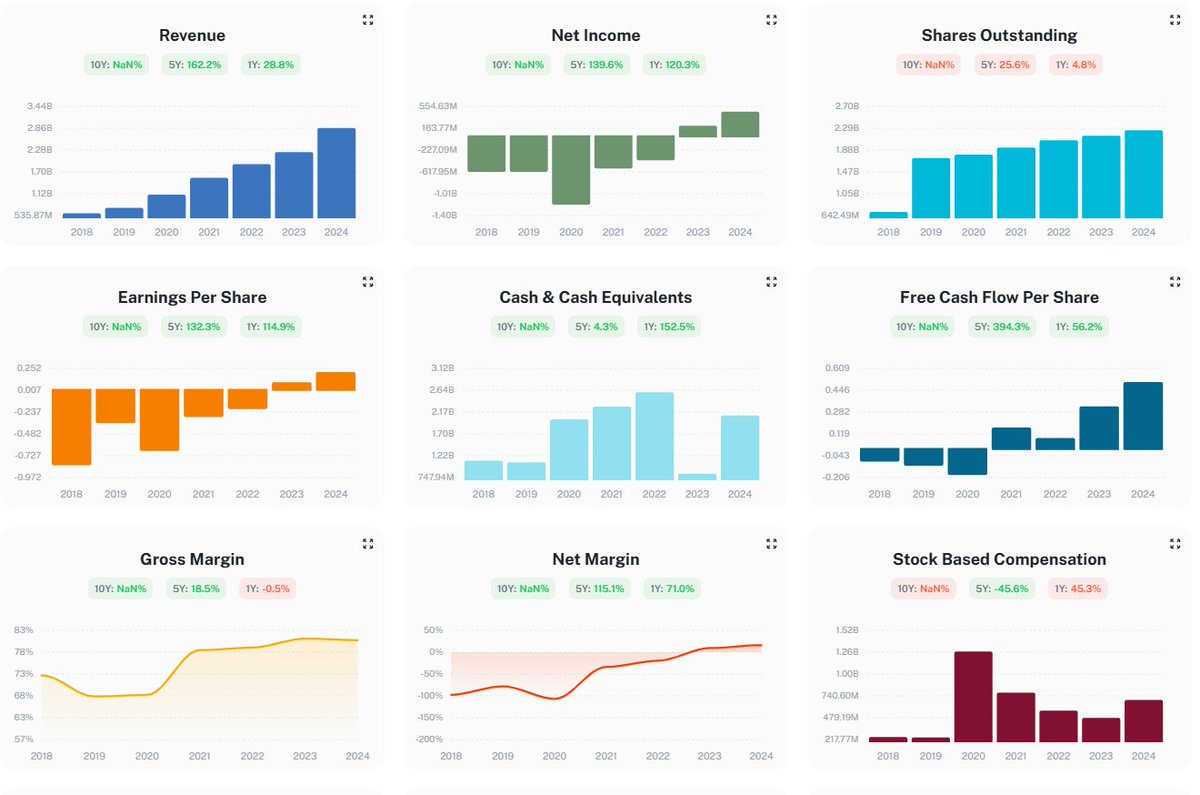
$PLTR Palantir's revenue growth is overshadowed by weak profitability. Their net income was less than $500 million in the past year, with a net profit margin of only 16%
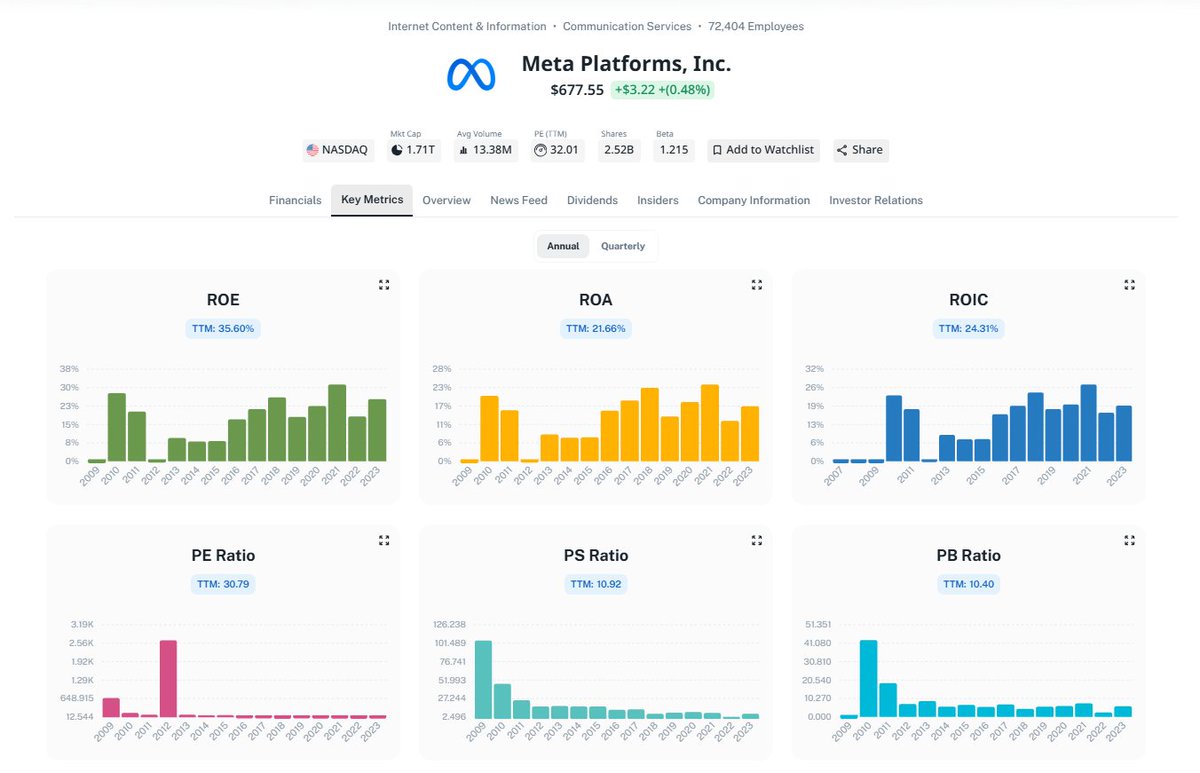
We've added a new enhancement to our Key Metrics section—TTM (Trailing Twelve Months) values are now displayed for major financial ratios.
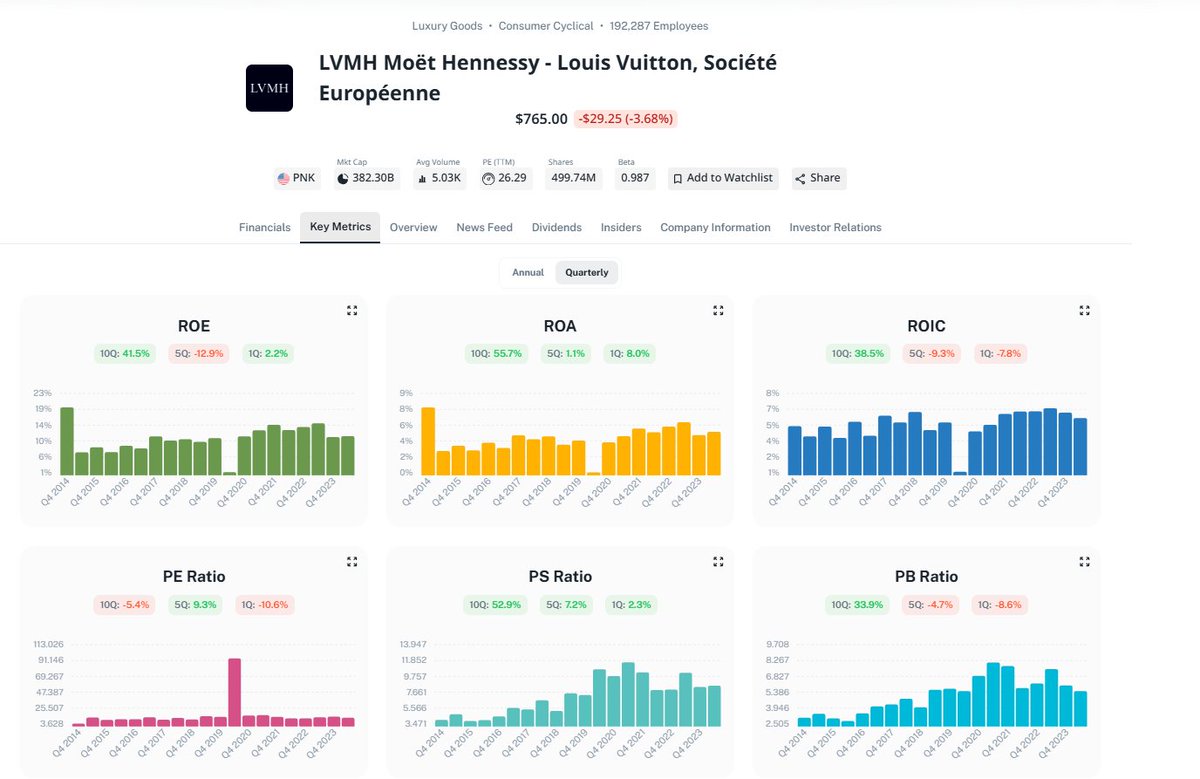
Now on Graphin, you can also explore European stocks. Don't miss our launch discount, 25% off the Plus package for a limited time! graphin.co
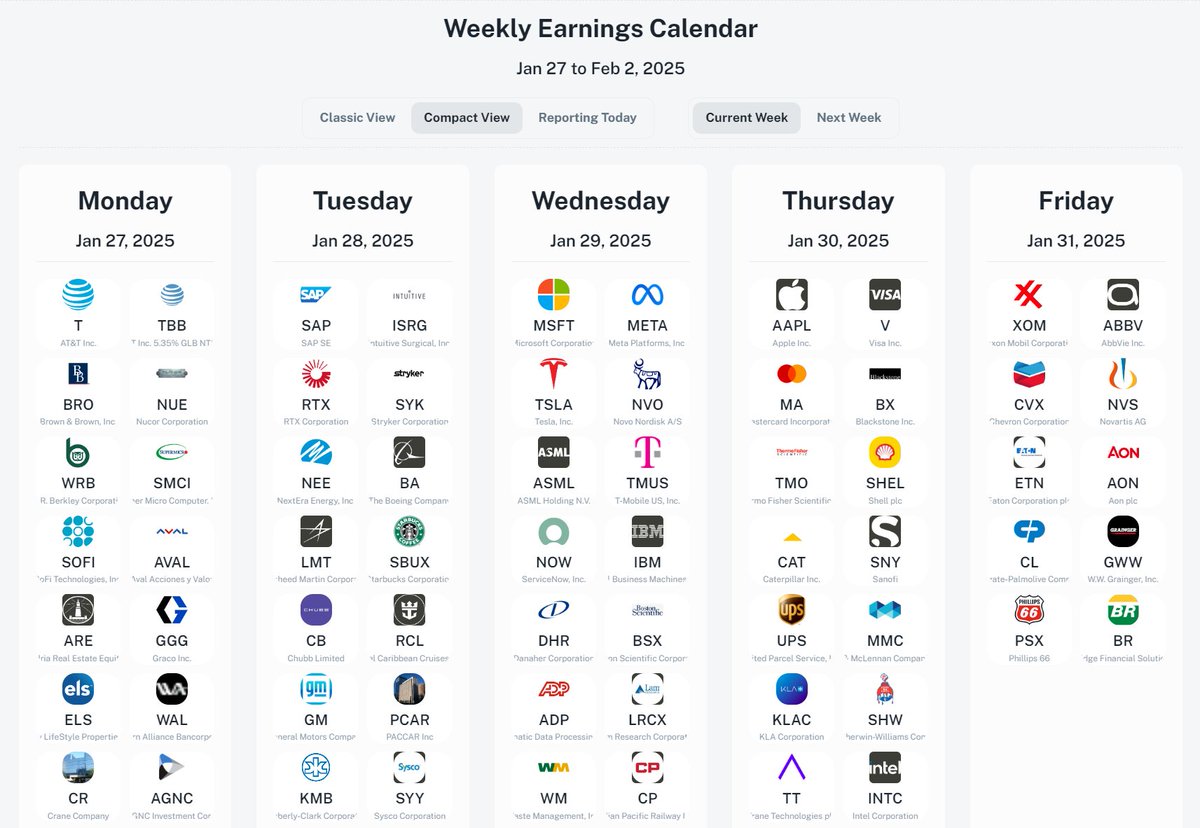
Key Earnings Reports This Week (Jan 27 - Feb 2, 2025): Monday (Jan 27): $T, $TBB, $SMCI, $SOFI Tuesday (Jan 28): $SAP, $ISRG, $BA, $SBUX Wednesday (Jan 29): $MSFT, $META, $TSLA, $NVO, $ASML Thursday (Jan 30): $AAPL, $V, $MA, $INTC Friday (Jan 31): $XOM, $ABBV
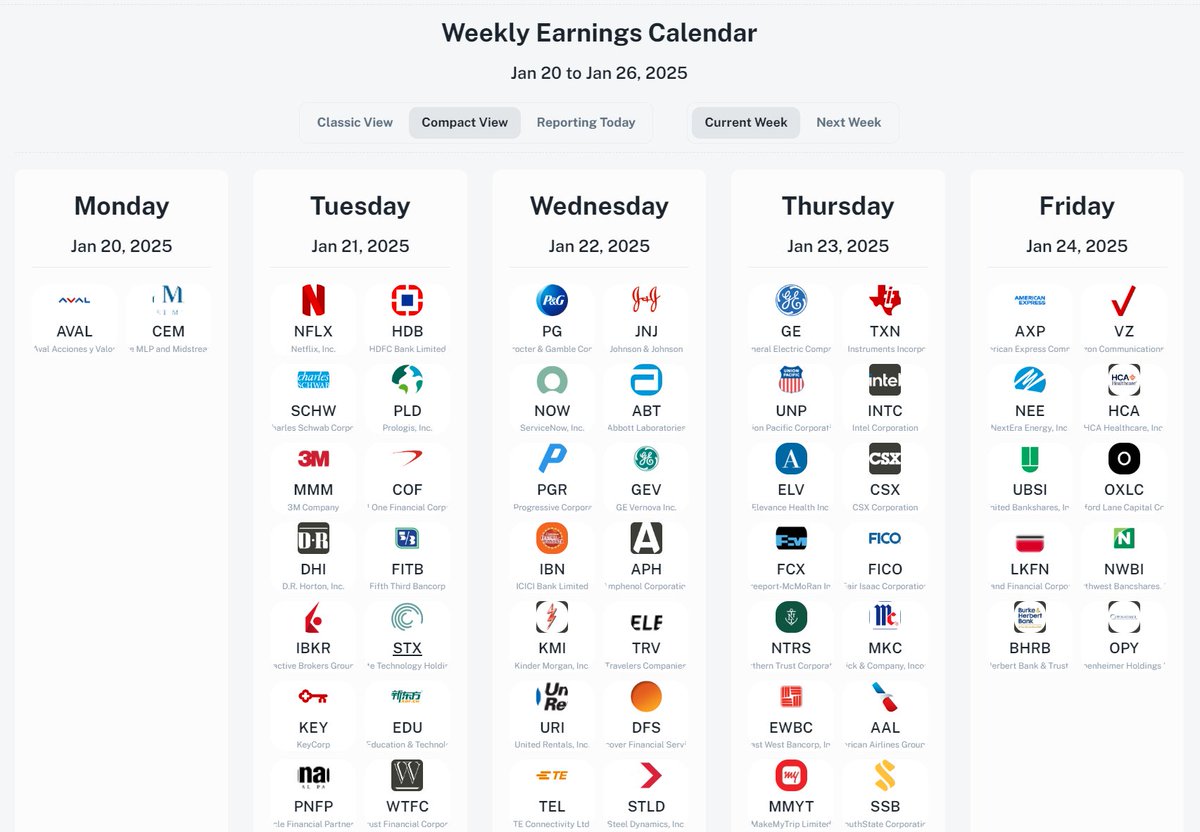
Key Earnings Reports This Week (Jan 20-26, 2025): Tuesday (Jan 21): $NFLX, $MMM, $PLD Wednesday (Jan 22): $JNJ, $PG, $NOW Thursday (Jan 23): $GE, $TXN, $INTC Friday (Jan 24): $AXP, $VZ, $NEE
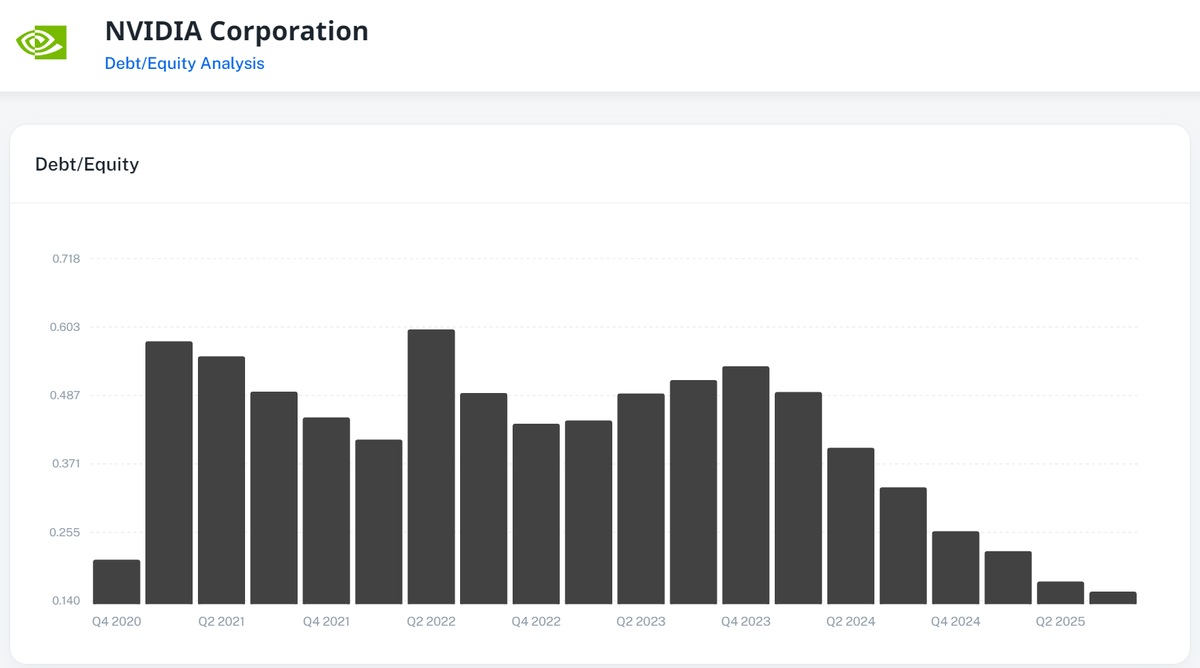
$NVDA Debt-to-Equity ratio is on a sharp decline! From a peak in Q2 2022, it has steadily dropped, showing financial strength and reduced reliance on debt. Healthy financials = investor confidence.
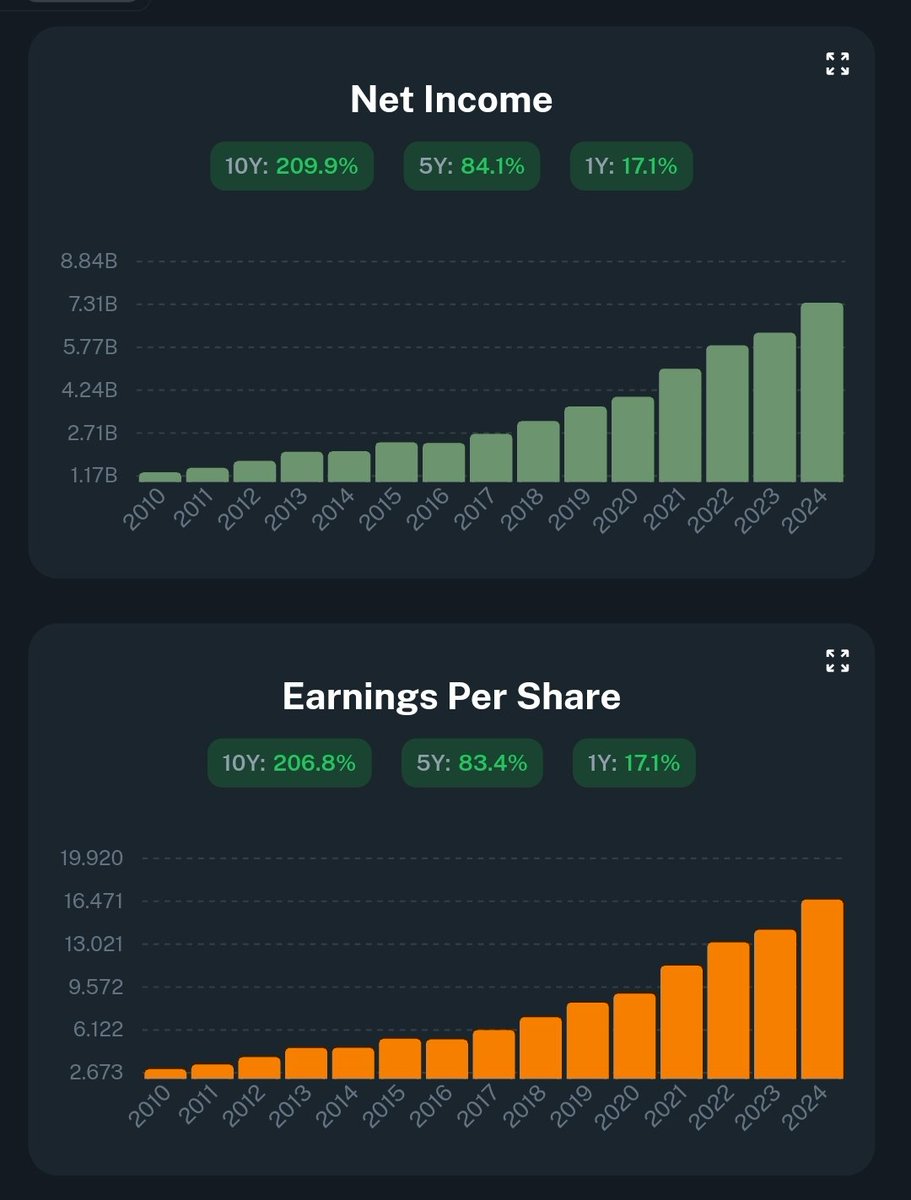
$COST Costco is proving that consistency wins the race. 💪 With triple-digit growth in net income (+209.9%) and EPS (+206.8%) over the last decade, this retail giant continues to deliver value to shareholders year after year.
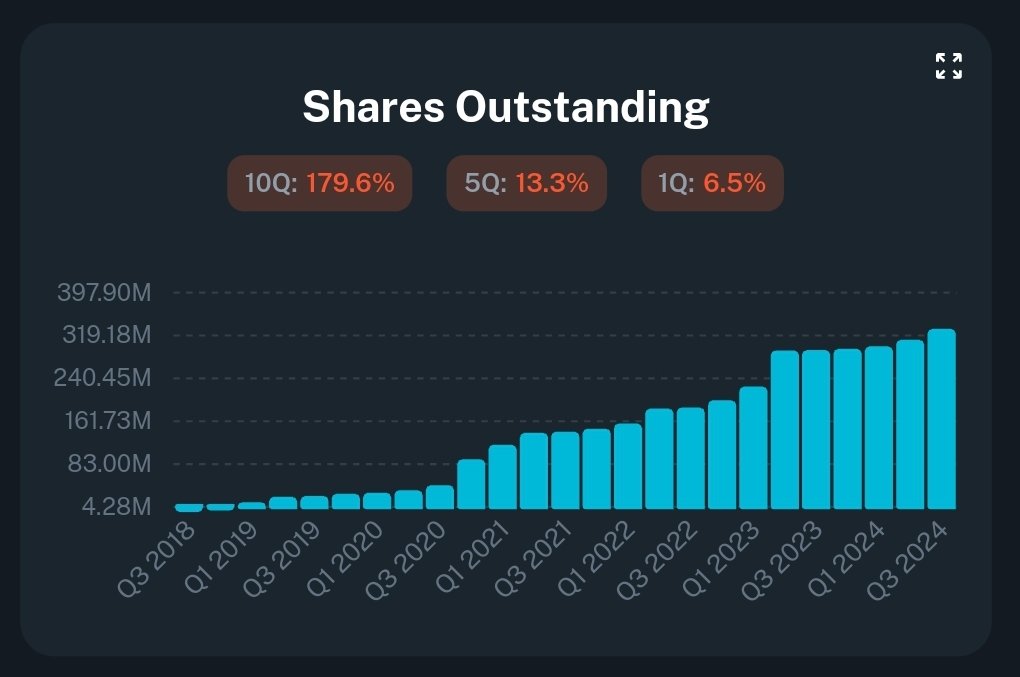
FuboTV's shares outstanding have surged by 179.6% over 10 quarters, with a 13.3% rise in the last 5 quarters and 6.5% this quarter alone. $FUBO
We’re excited to unveil a new enhancement to our graphs! Now, you can easily track percentage changes in key financial metrics over various timeframes. This feature simplifies analyzing trends and identifying performance shifts at a glance.


United States Trends
- 1. Sean Mannion N/A
- 2. SpaceX N/A
- 3. #BridgertonS4 N/A
- 4. Dignity N/A
- 5. FORTNITETOOZ N/A
- 6. #mcrchile2 N/A
- 7. Luigi Mangione N/A
- 8. $ELON N/A
- 9. Hugh Morris N/A
- 10. Chief Kindness Officer N/A
- 11. #RenoucedOwnerDadacoin N/A
- 12. #drwfirstgoal N/A
- 13. Iron Lung N/A
- 14. #LightningStrikes N/A
- 15. USA 250 N/A
- 16. Goldberg N/A
- 17. Shakur N/A
- 18. shane hollander N/A
- 19. Pocahontas N/A
- 20. Nintendo N/A
Something went wrong.
Something went wrong.