
Graphwise
@Graphwise1
UK data trends visualised. Graphwise aims to provide easy to access, up-to-date and accurate long-term data trends, without bias and only using robust sources.
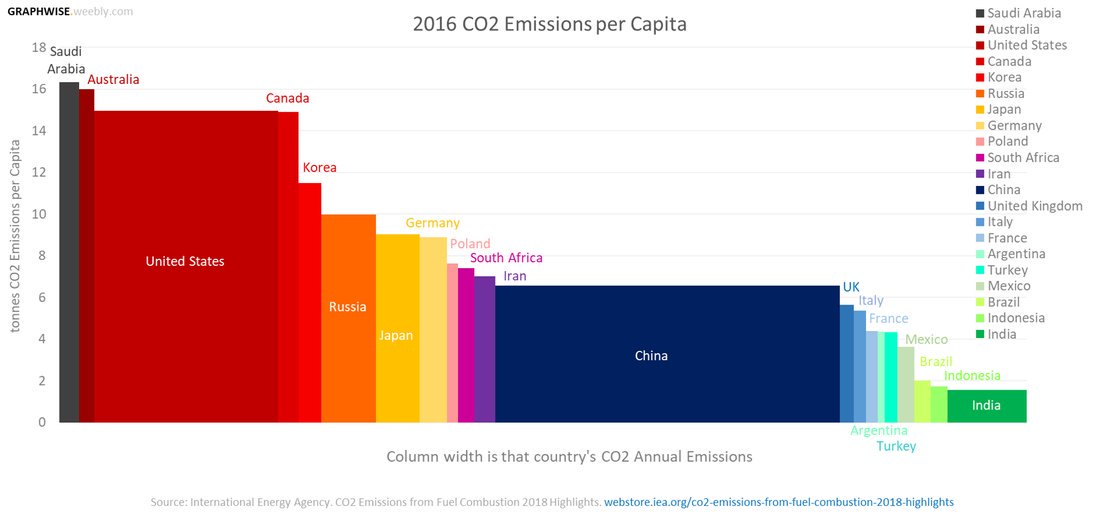
Let's shine a light on countries that not only emitting the most carbon but also those that have the highest rates per capita, such as Saudi Arabia, Australia and Canada. #graphwise #climatechange @GreenpeaceEU @XRBristol @XRCardiff @XRebellionUK @ScotlandXr @ExtinctionR
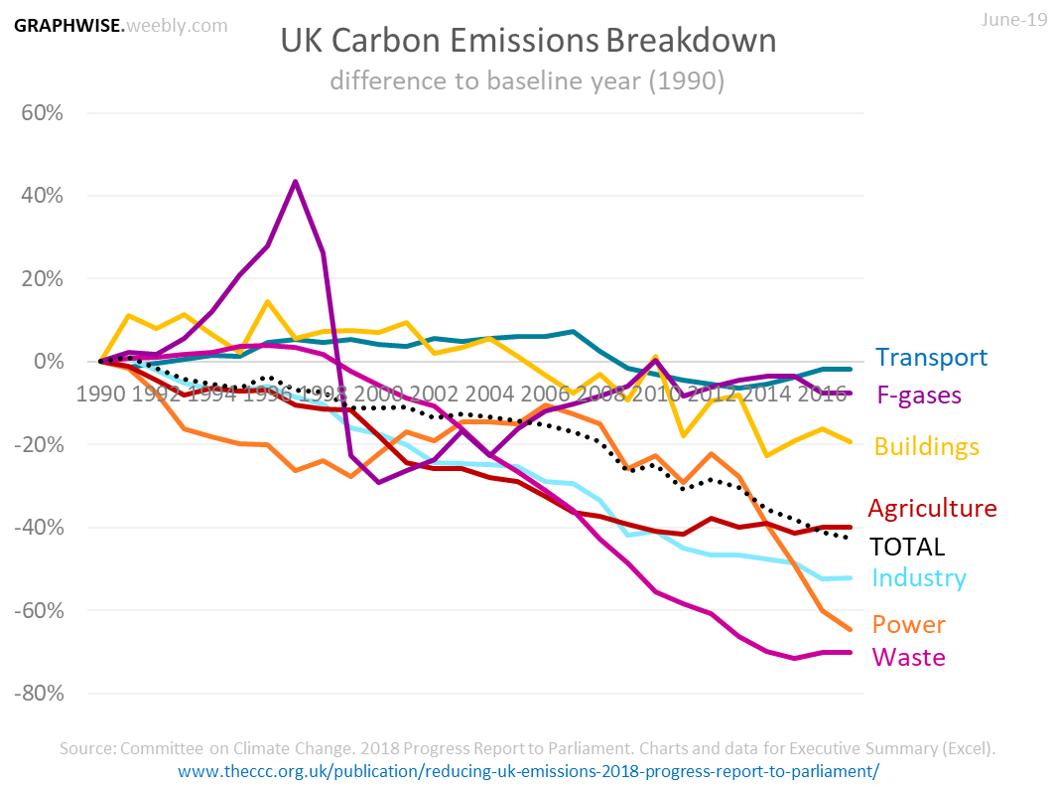
#Carbon emissions from UK international flights have increased by 120% since 1990, whereas emissions from sea freight has stayed around about the same. #netzero

The #transport sector has emitted the same amount of #carbondioxide as it was back in 1990. Much more needs to be done if the UK's #netzero by 2050 target is going to be achieved.
The UK's potential glide path to #netzero carbon emissions by 2050. Find out more at graphwise.weebly.com


United States الاتجاهات
- 1. D’Angelo 241K posts
- 2. D’Angelo 241K posts
- 3. Brown Sugar 18.7K posts
- 4. Black Messiah 9,178 posts
- 5. #PortfolioDay 12.8K posts
- 6. Young Republicans 8,147 posts
- 7. Pentagon 106K posts
- 8. Voodoo 18.7K posts
- 9. How Does It Feel 8,259 posts
- 10. Powell 41.6K posts
- 11. Happy Birthday Charlie 134K posts
- 12. VPNs 1,277 posts
- 13. Baldwin 19K posts
- 14. First Presidency 1,956 posts
- 15. Scream 5 N/A
- 16. Politico 145K posts
- 17. World Cup 306K posts
- 18. CJGJ N/A
- 19. Totodile 2,772 posts
- 20. Alex Jones 31K posts
Something went wrong.
Something went wrong.