
Jester Trades
@Jester_Trading
OTC/Small Caps | Take the risk or lose the chance | These are my own opinions I am NOT a financial advisor. Do your own DD
Bạn có thể thích


I know it’s been months since I’ve posted or active. I hope you all are having a great 2025. The engagement on X has diminished imo & my posts weren’t being pushed out. I just started on LinkedIn if anyone is interested in learning from educational posts. And of course it’s free!
$ONMD #OMND 2 days later and the 1.5s key level provided is still providing multiple 15-30% bounces!
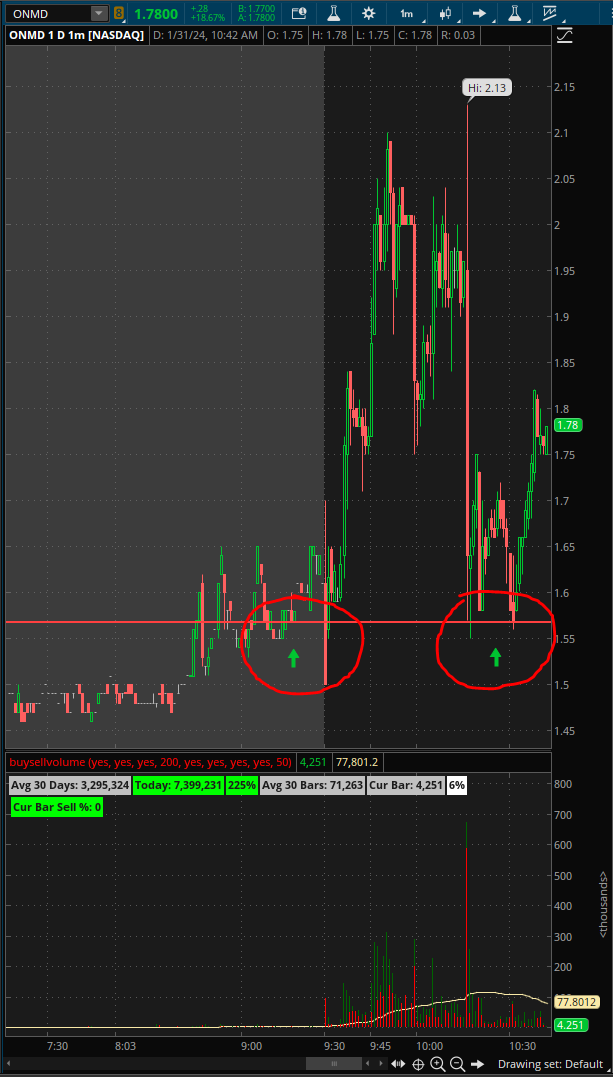
$OMND #OMND The true POWER of proper technical analysis. Consolidated at the $1 whole pysch level all morning then BOOM heavy volume came in sending it parabolic. Now hovering at the second key level I provided for you yesterday.
#PALI $PALI Update: Once .90 support failed to hold & bulls couldnt defend any longer it then flipped to resistance continuing the downtrend of lower highs & lower lows all the way back to the bottom range of premarket support from yesterday which provided a slight relief bounce

$PALI #PALI technical analysis. As volume died after the failed breakout above 1.4 price also faded creating lower highs with it back down to premarket lows. From here bulls need to defend .90 for a potential bounce into 1.2 otherwise downtrend could continue lower.

$FRSX #FRSX Update: Price tried to hold 1.4 support but failed to create a higher high above 1.6 After the support became weaker and failed to hold creating a lower low the key level then flipped to resistance and downtrend continued as expected.

#FRSX $FRSX Heavy volume day so here are some technicals to study. Two key levels I'm watching to see are 1.6 resistance and 1.4 support. For continuation higher price must break & hold above 1.6 while if 1.4 fails to hold and creates a lower low downtrend can continue.

Not trying to be negative but I can’t believe I get on here and see people still trying to promote the same OTC stocks they are bagged in from 3 years ago lololol. I truly believe this is why a lot of people left the platform. Same cycle over and over!
$OMND #OMND The true POWER of proper technical analysis. Consolidated at the $1 whole pysch level all morning then BOOM heavy volume came in sending it parabolic. Now hovering at the second key level I provided for you yesterday.
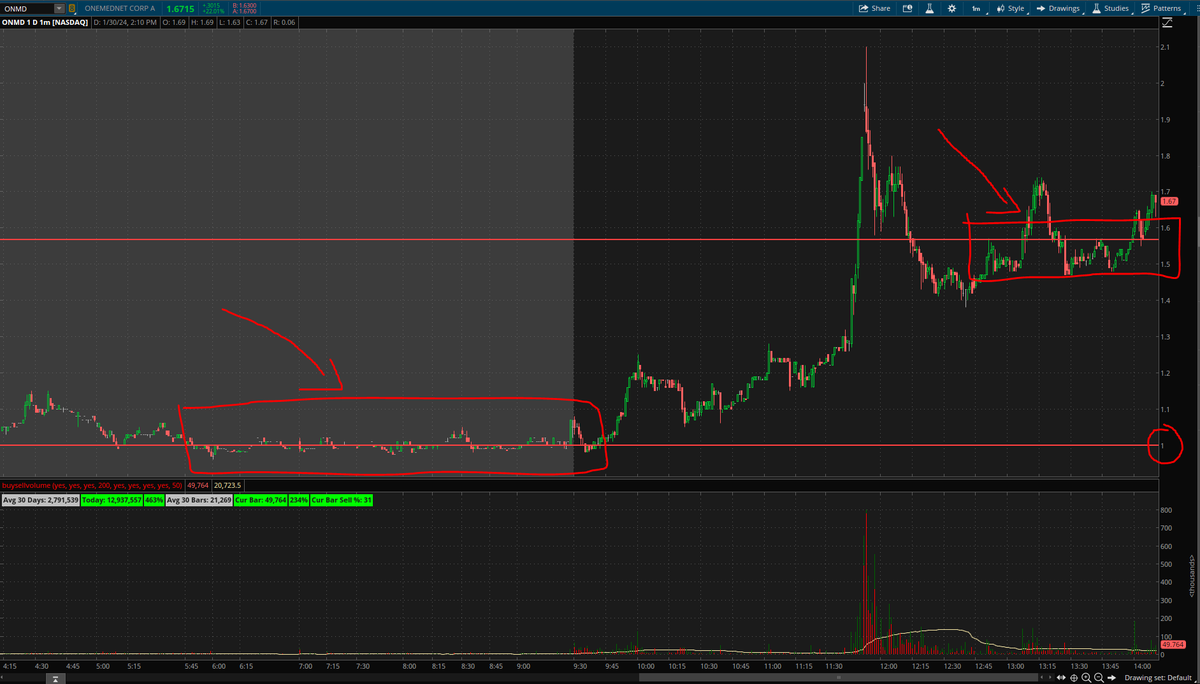
$ONMD #ONMD Technical Analysis & how to read price action. For continuation higher price needed to breakout & hold above 1.6 creating a higher high. When that failed it now is heading back to intraday lows. Bulls need to defend $1 If a lower low is created downtrend can continue.

$OMND bulls defended $1 and created a higher low. Now pushing right back into that 1.5s resistance 🎯
$ONMD #ONMD Technical Analysis & how to read price action. For continuation higher price needed to breakout & hold above 1.6 creating a higher high. When that failed it now is heading back to intraday lows. Bulls need to defend $1 If a lower low is created downtrend can continue.
#FRSX $FRSX Heavy volume day so here are some technicals to study. Two key levels I'm watching to see are 1.6 resistance and 1.4 support. For continuation higher price must break & hold above 1.6 while if 1.4 fails to hold and creates a lower low downtrend can continue.
$PALI #PALI technical analysis. As volume died after the failed breakout above 1.4 price also faded creating lower highs with it back down to premarket lows. From here bulls need to defend .90 for a potential bounce into 1.2 otherwise downtrend could continue lower.
$ONMD #ONMD Technical Analysis & how to read price action. For continuation higher price needed to breakout & hold above 1.6 creating a higher high. When that failed it now is heading back to intraday lows. Bulls need to defend $1 If a lower low is created downtrend can continue.
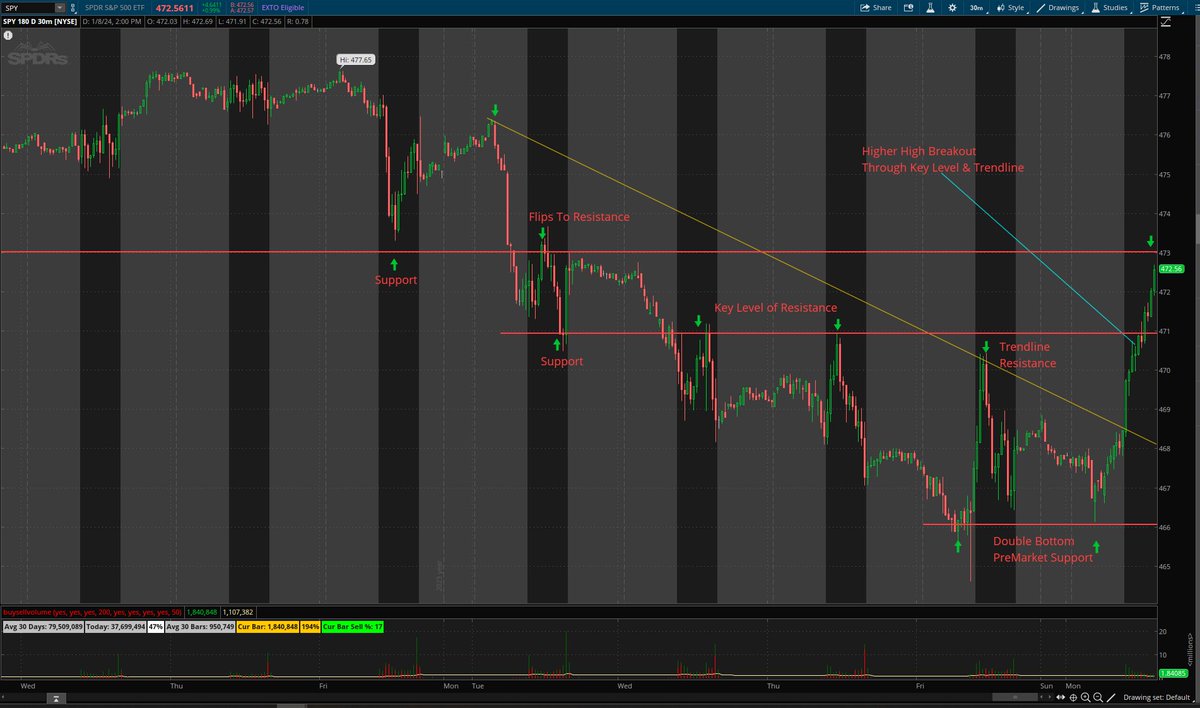
$SPY #SPY Beautiful example of #technicalanalysis playing out where after a #trendline is broken what was previously acting as #resistance now flips to #support after the higher high and reclaim of key level! #stockmarketcrash #StockMarketNews #priceaction

$ELAB #ELAB Example of how when the final level of premarket support breaks it fades back down to previous days lows. #Technicals #technicalanalysis #priceaction #stockstowatch #StockMarket

Impressions & reach are down. Very few interactions anymore. Tons of scammers. Looks like this platform is just slowly going downhill unfortunately
Is anyone even on Twitter anymore? Seems like 90% just gave up or moved to a new platform
Is anyone even on Twitter anymore? Seems like 90% just gave up or moved to a new platform
$SPY #SPY who remembers the key level of 473 I posted on monday 3 days ago? Since price was ABOVE creating a HIGHER HIGH when it goes down to retest it will now flip to SUPPORT. Perfect bounce! #StockMarket #technical #priceaction #candlestick #chartpatterns #charts

$SPY technicals. It created a higher high through $471 resistance and broke out of the downwards trendline resistance. Now we look to see how it reacts to the next key level of $473 that has been tested as both support and resistance!
$ROMA #ROMA advanced technical analysis to learn price action. Hope you guys get some value from it! #TradingTips #stockstowatch #StocksInNews

$SPY technicals. It created a higher high through $471 resistance and broke out of the downwards trendline resistance. Now we look to see how it reacts to the next key level of $473 that has been tested as both support and resistance!
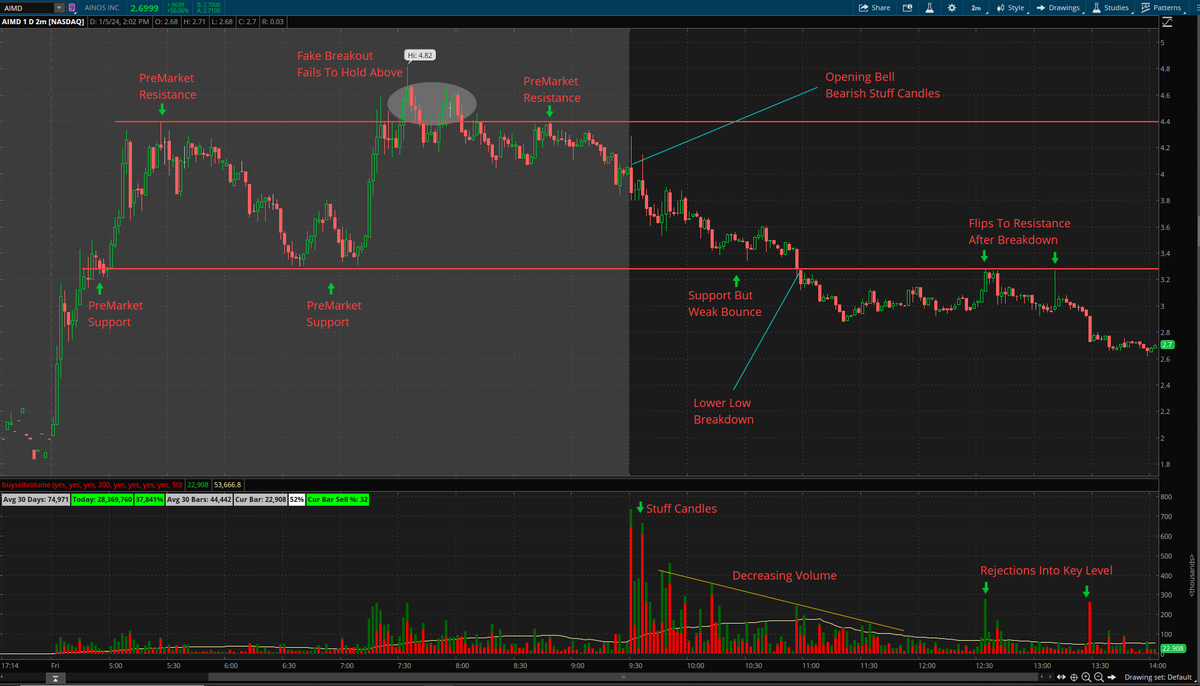
$AIMD technicals & how to read price action. Have a great weekend everyone!
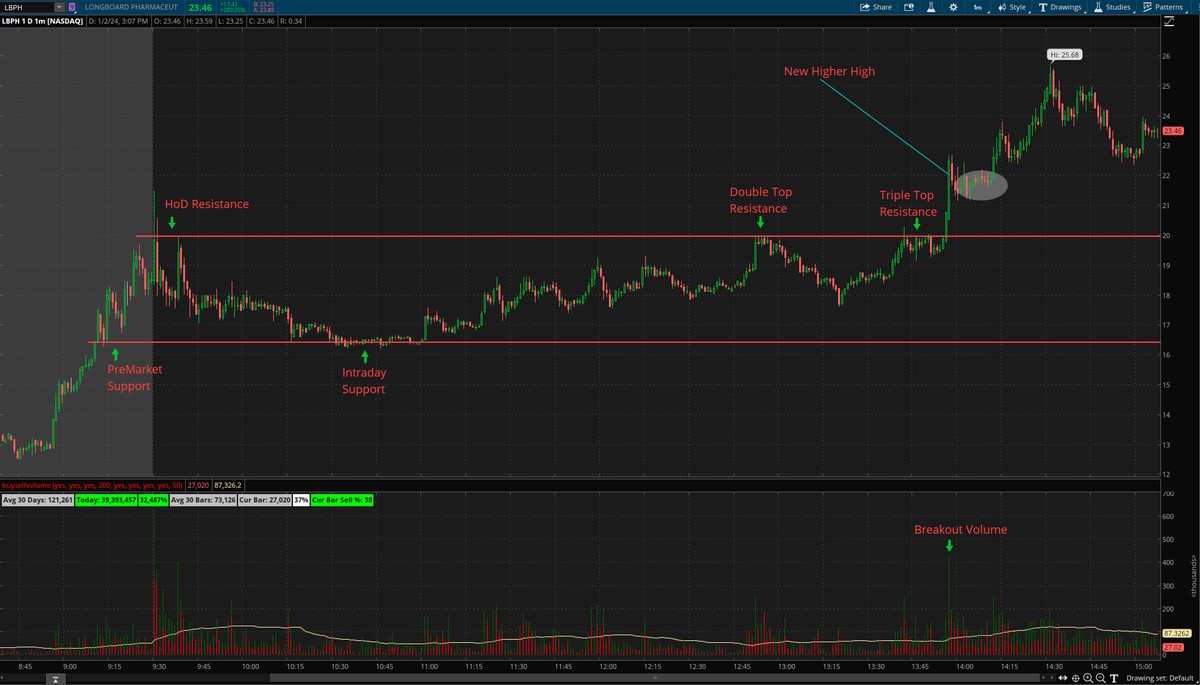
$LBPH A lot of traders ask me why is the volume bar I pointed to so much higher? 1. Its a new high of day breakout so long traders are chasing in and out quickly 2. All shorts that were piling into the resistance that formed a triple top have to stop out! Grey circle = acceptance
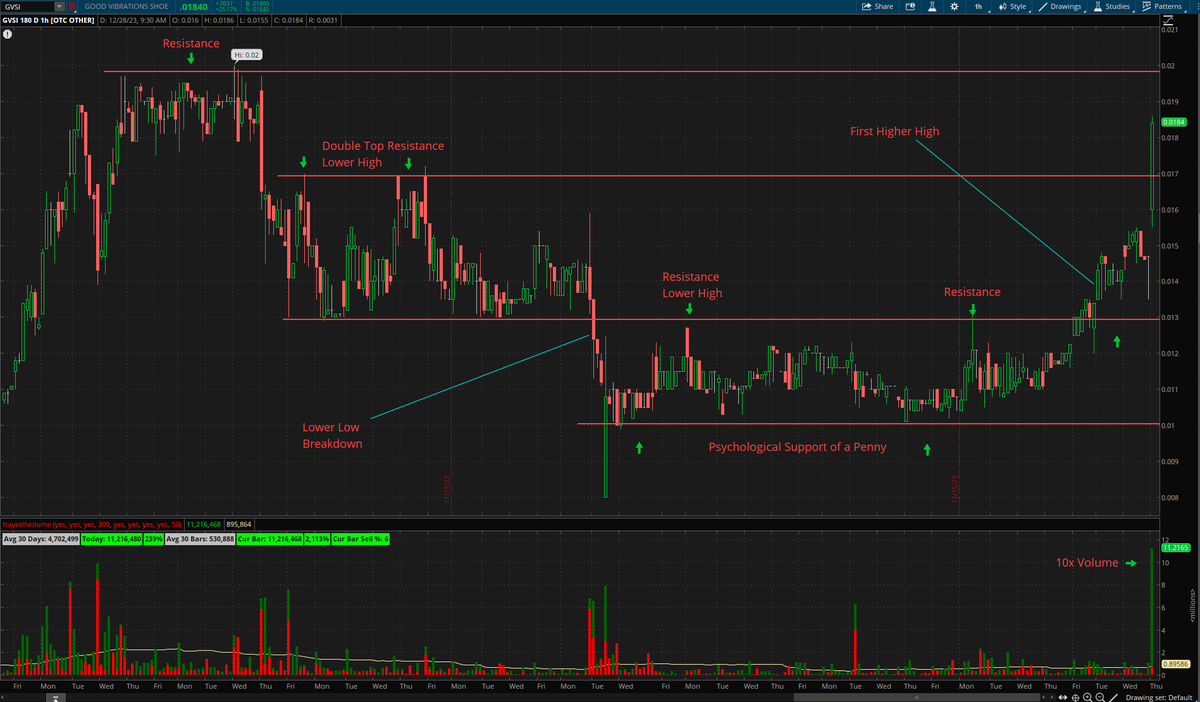
$GVSI some technicals to study. Currently doing over 10x volume this morning. Price needs to hold above the .017 resistance level it broke through to push towards that macro high of .02


United States Xu hướng
- 1. James Franklin 42.1K posts
- 2. Jets 102K posts
- 3. Cowboys 43.4K posts
- 4. Drake Maye 12.8K posts
- 5. Penn State 57.6K posts
- 6. George Pickens 6,154 posts
- 7. Justin Fields 21.6K posts
- 8. Rico Dowdle 3,256 posts
- 9. Colts 42.6K posts
- 10. Steelers 46.5K posts
- 11. Zay Flowers 1,895 posts
- 12. Puka 7,823 posts
- 13. Cooper Rush 2,516 posts
- 14. #RavensFlock 2,177 posts
- 15. Broncos 45K posts
- 16. Eberflus 1,804 posts
- 17. Derrick Henry 2,760 posts
- 18. #Browns 2,707 posts
- 19. Aaron Glenn 9,172 posts
- 20. Rodgers 6,230 posts
Bạn có thể thích
-
 007: A fearless OTC Trader
@shawonsarker84 -
 Kanye Invest | Not Kanye West
@Kanye_Invest -
 ScalpIt
@nxtplse -
 Cornerstone Marketing Inc.
@CS_MarketingInc -
 👑𝐌𝐍 𝐈𝐍𝐕𝐄𝐒𝐓𝐈𝐍𝐆💎
@mn_investing -
 == UNKNOWN ==
@OtcUpdates -
 Paul Seo 🦉
@paulseo403 -
 Angry Red
@AngryRed316 -
 Penny Whale
@WhalePenny -
 Eager_Beaver
@linzy_long_hold -
 Chairman ² 🔶
@Chairman_DN -
 🌹The Dragon 🔥🐲
@thePUTdragon -
 Bill's Stocks and Thoughts
@billsstocks1 -
 WildRhino
@WildRhino -
 EC MONEY
@ecgreendays
Something went wrong.
Something went wrong.