
Next Wave Trading
@NextWaveTrade
Daily technical + fundamental analysis for Trading and Investing 📈 | NFA
"Elliott Wave Theory is a form of technical analysis that helps financial traders analyze market cycles and forecast market trends by identifying extremes in investor psychology" It consists of A Motive phase: 5 Waves up (12345) Followed by a corrective phase: 3 Waves down (ABC)

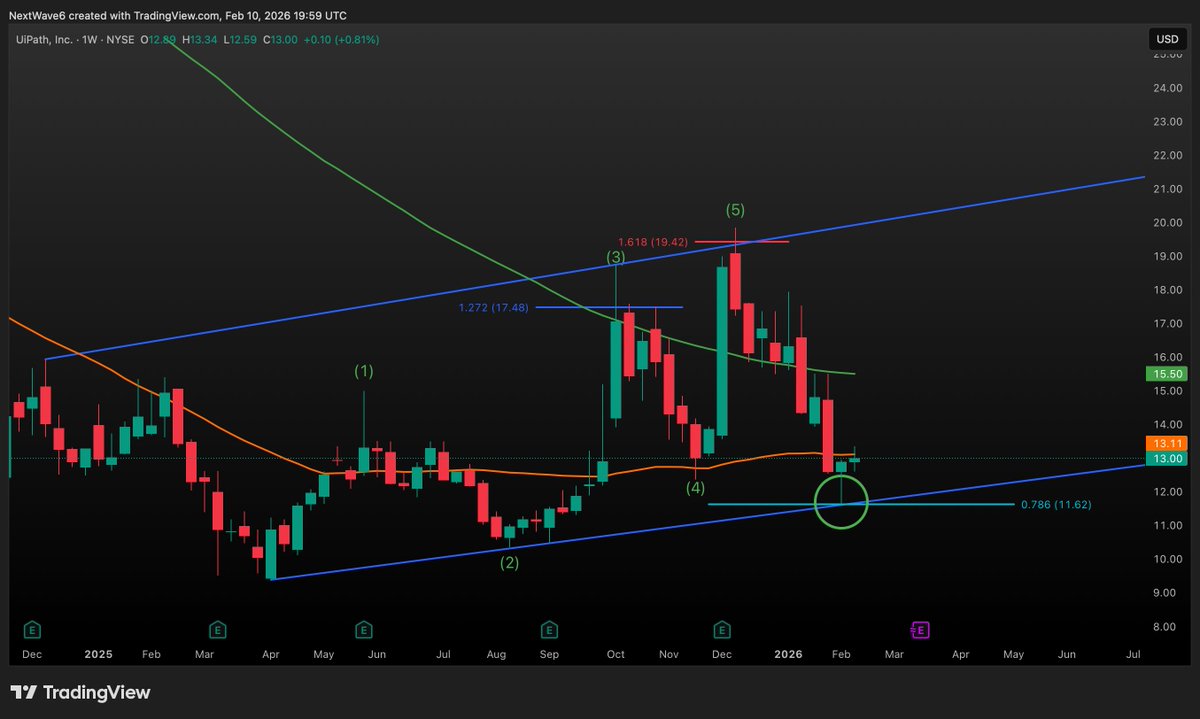
$PATH bounced off the trend line + 0.786 confluence level last week We can see an ABC correction on the Daily timeframe, so we may be starting a new impulse count (for Wave 3) - but this is not clear on the Weekly Any holders would like to see a break of the 50 Week MA next
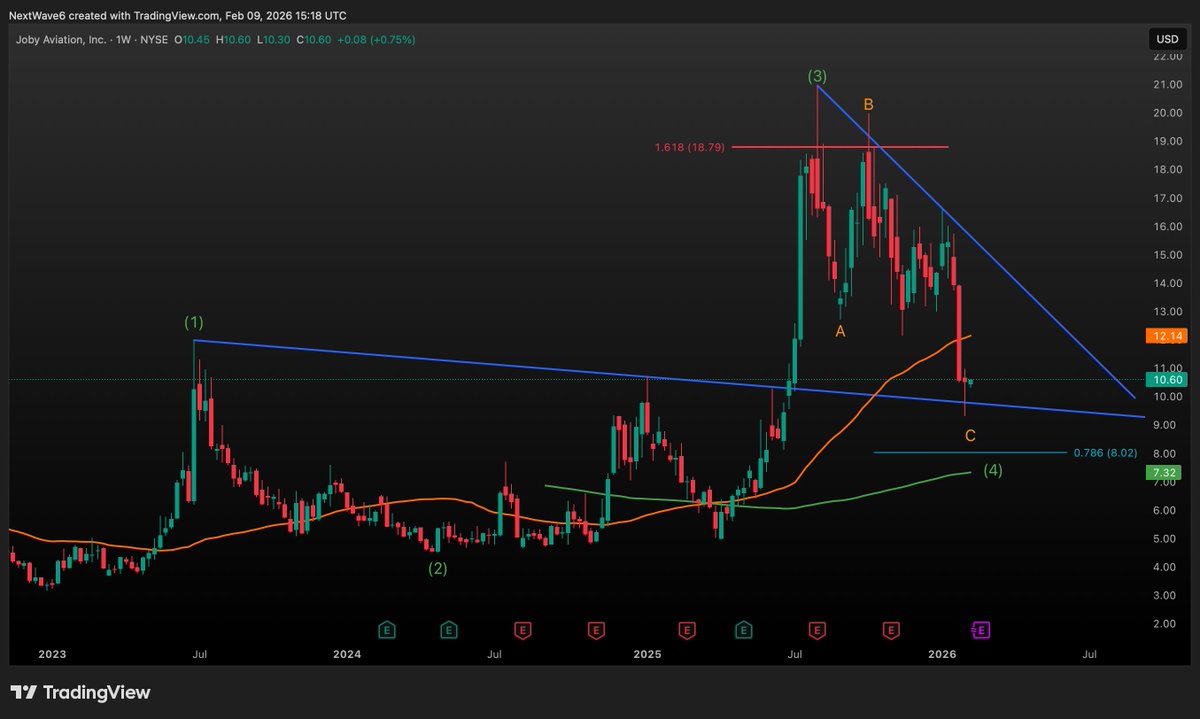
$JOBY Here is my updated chart. We're seeing a deeper Wave 4 ABC pullback than I had anticipated But price has held the previous trend line resistance, converting it to support at the moment I'm not ruling out another leg down to the 0.786 FIB
Do you think $HIMS can close above the 200 Week MA (at $20) this week?
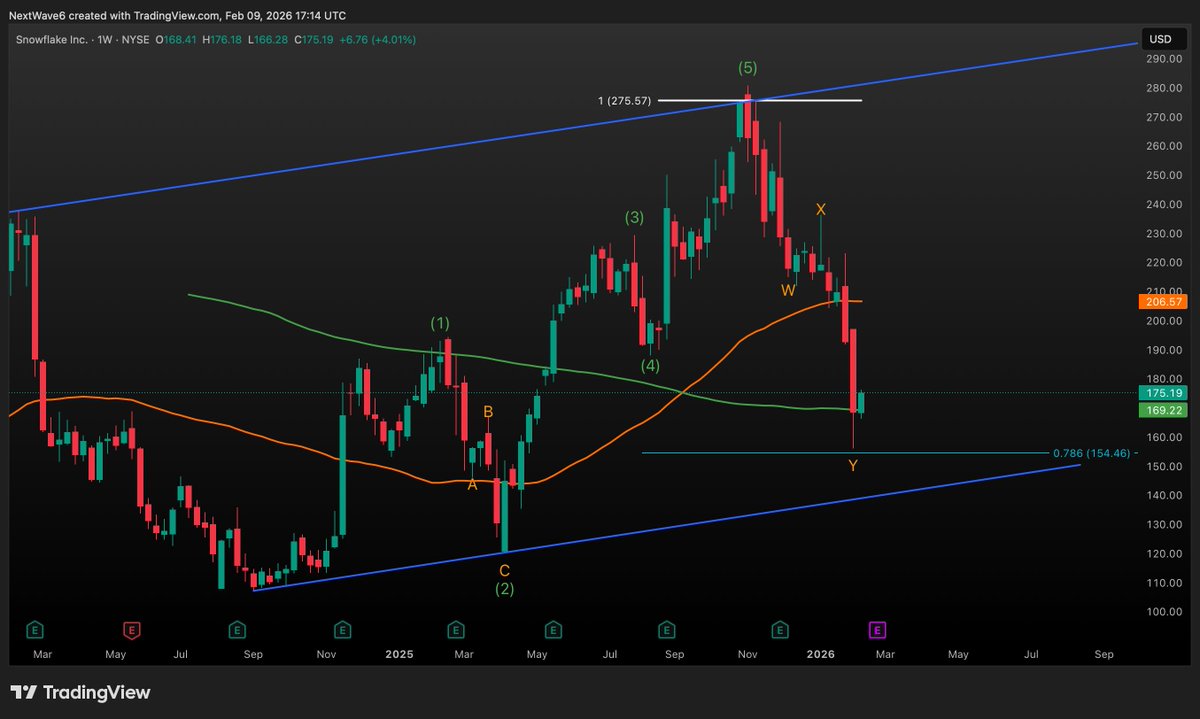
$SNOW has started the week well, bouncing off the 200 Week MA Here is an alternate Wave count to the one I have posted previously, that is looking more likely In this count it seems we are in Wave A - or perhaps Wave B has just started I'll still be watching the previous count
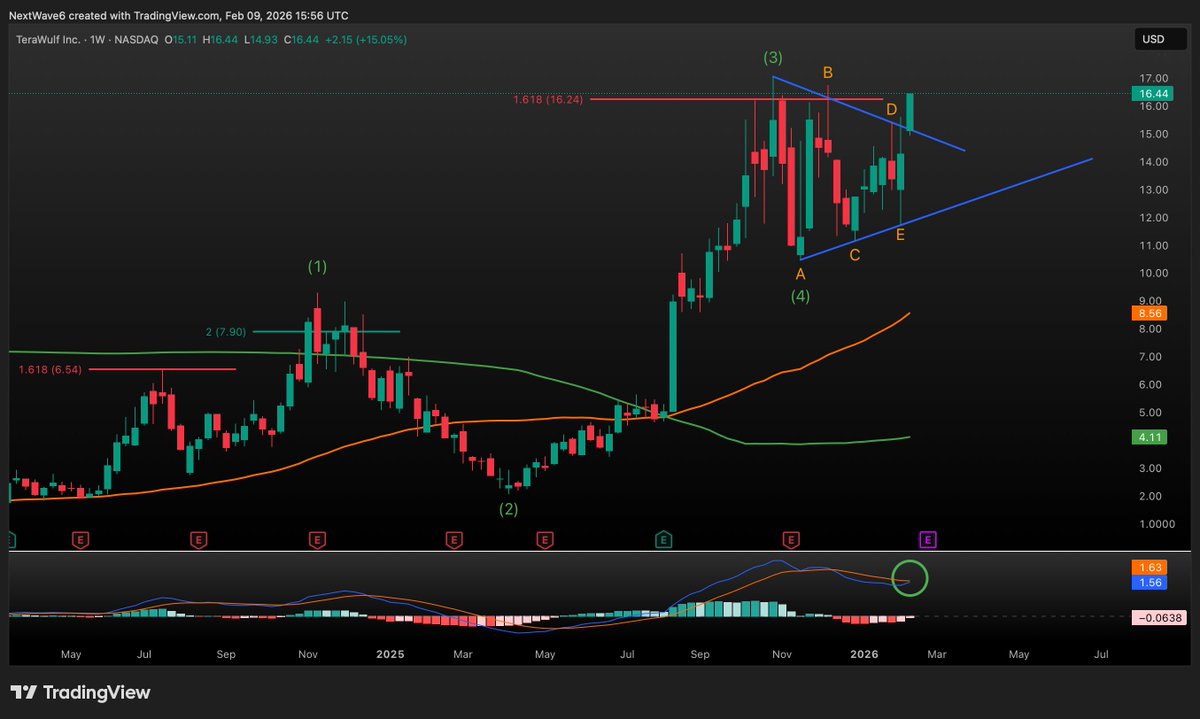
$WULF - charted over weekend Wave 3 ended perfectly at the 1.618 FIB Then we have seen a textbook triangle correction for Wave 4 and price is up 15% today, breaking though the trend line to start Wave 5 The weekly MACD is also about to curl green Who wants to see my targets👇
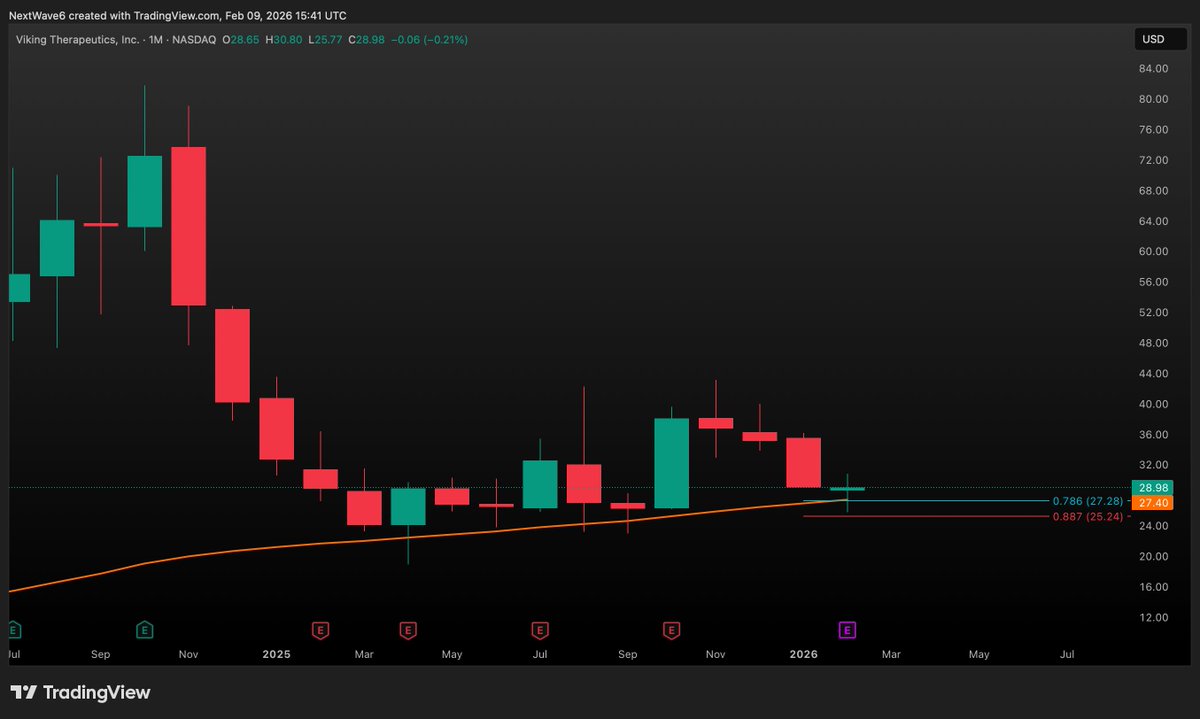
$VKTX
Price also closed above the 50 Month MA, which has provided significant support
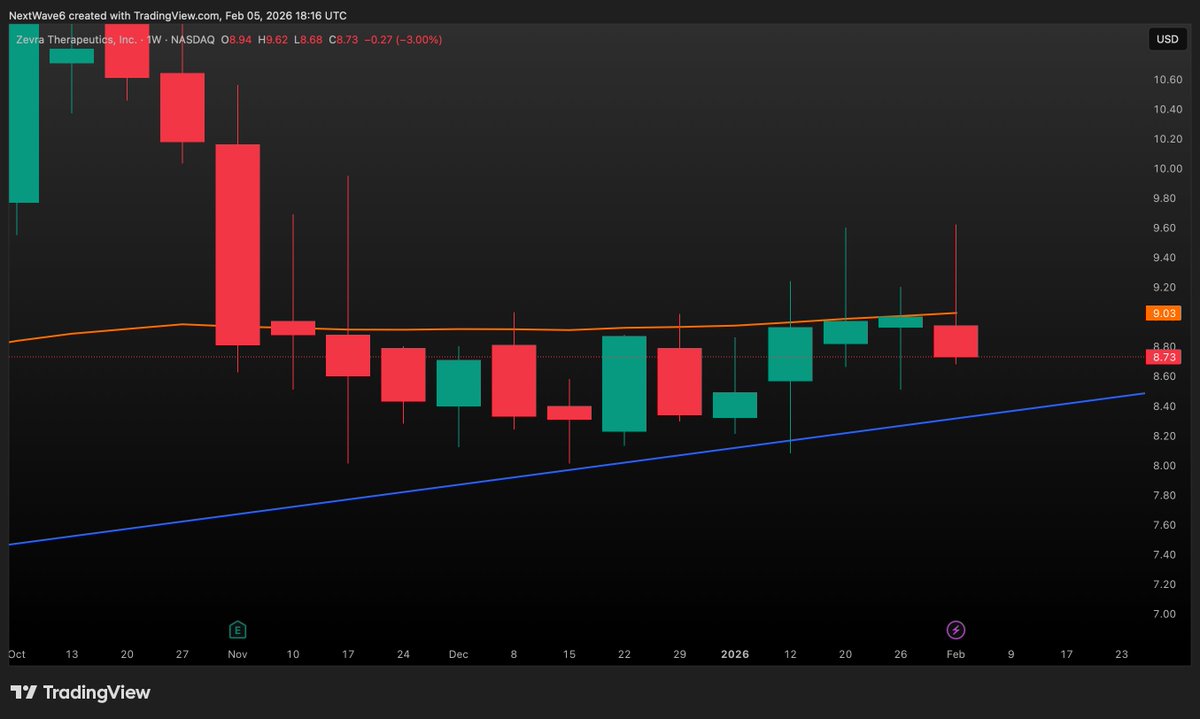
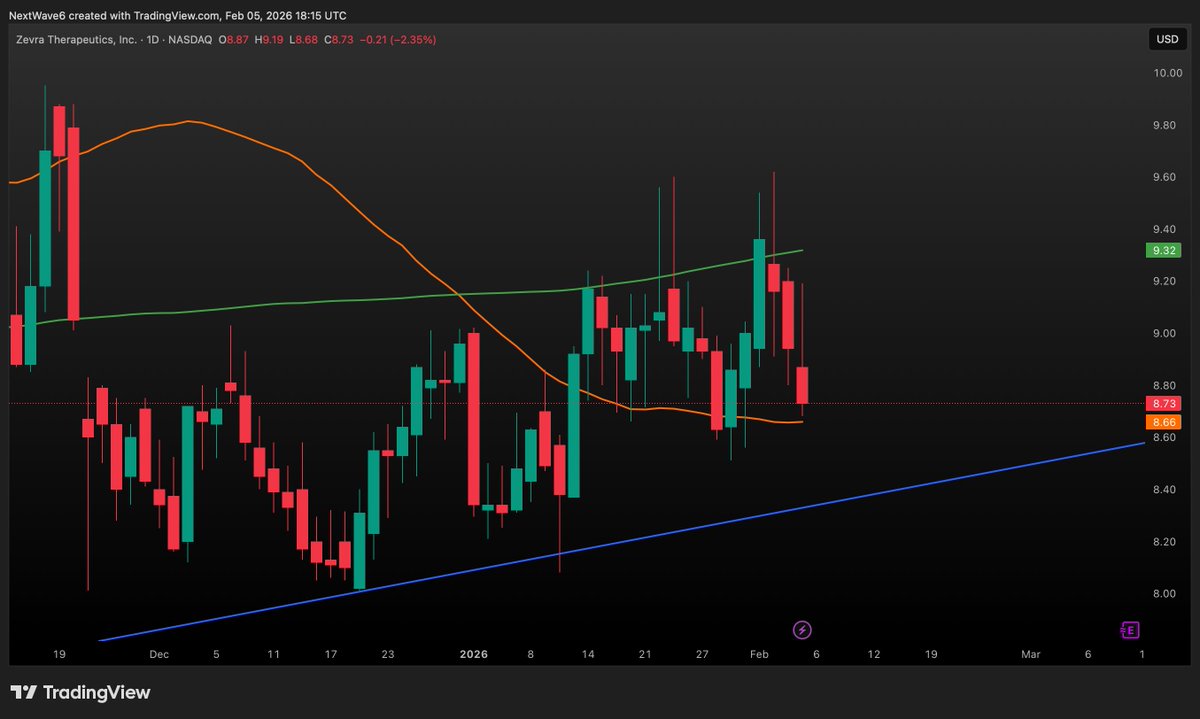
$ZVRA Price did not break through, but bounced nicely off this long trend line on Thursday Before adding to my position I want to see price: 1) Reclaim the 50 Day MA 2) Reclaim the 200 Day MA 3) Reclaim the 50 Week MA My next target for $ZVRA is $22
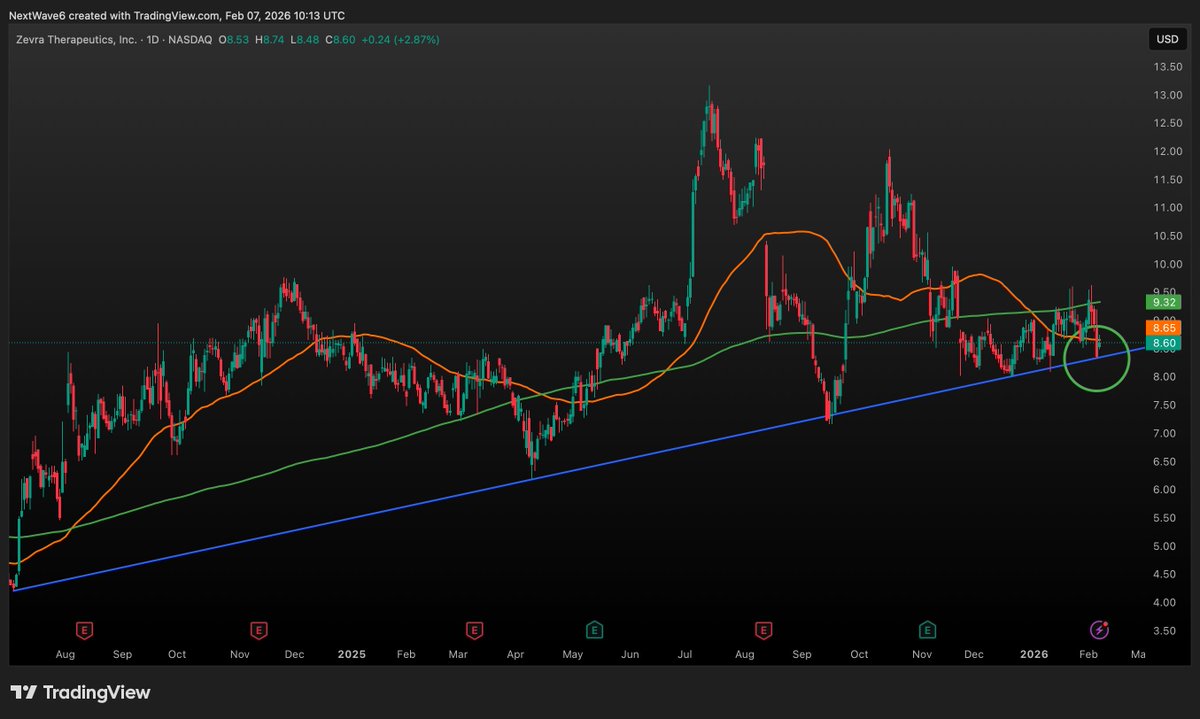
2 observations on the $ZVRA chart: 1) Price has been rejecting the 50 Week MA since mid November 2) Price has been bouncing between the 50 and 200 Day MAs for a few weeks now Do you think this is bullish for $ZVRA 🤔?
Price seems to be respecting the highlighted trend line, +2.5% today Next test is the 50 Day MA $JD
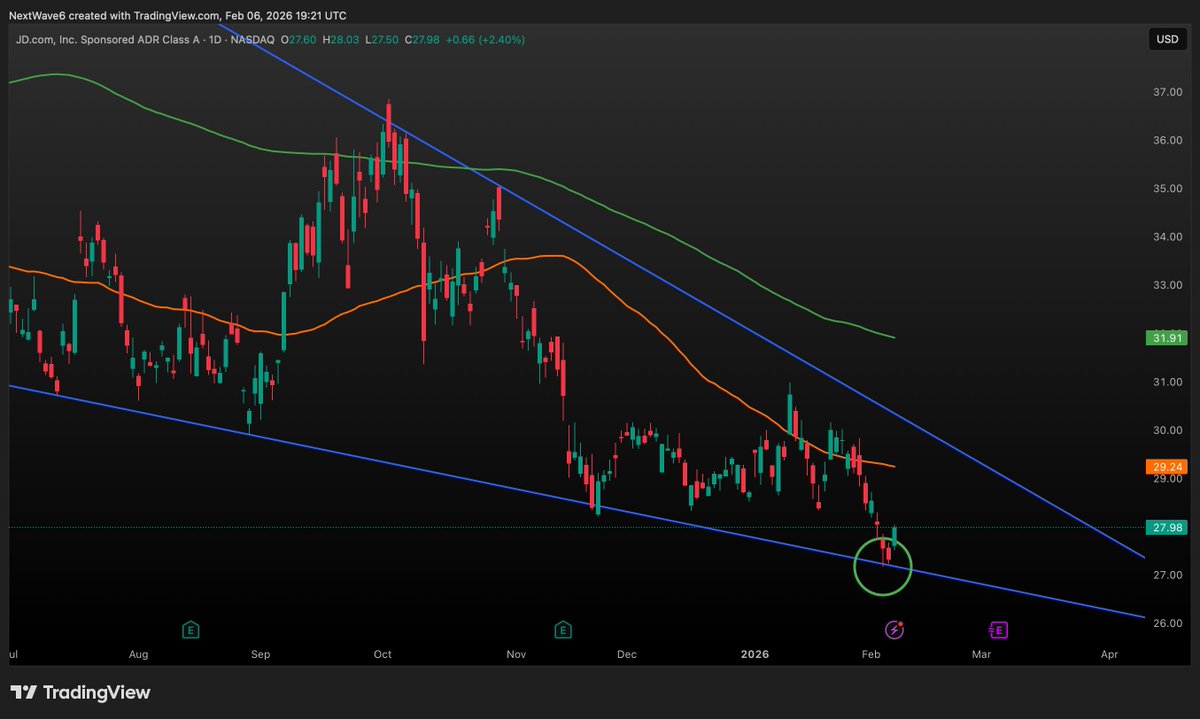
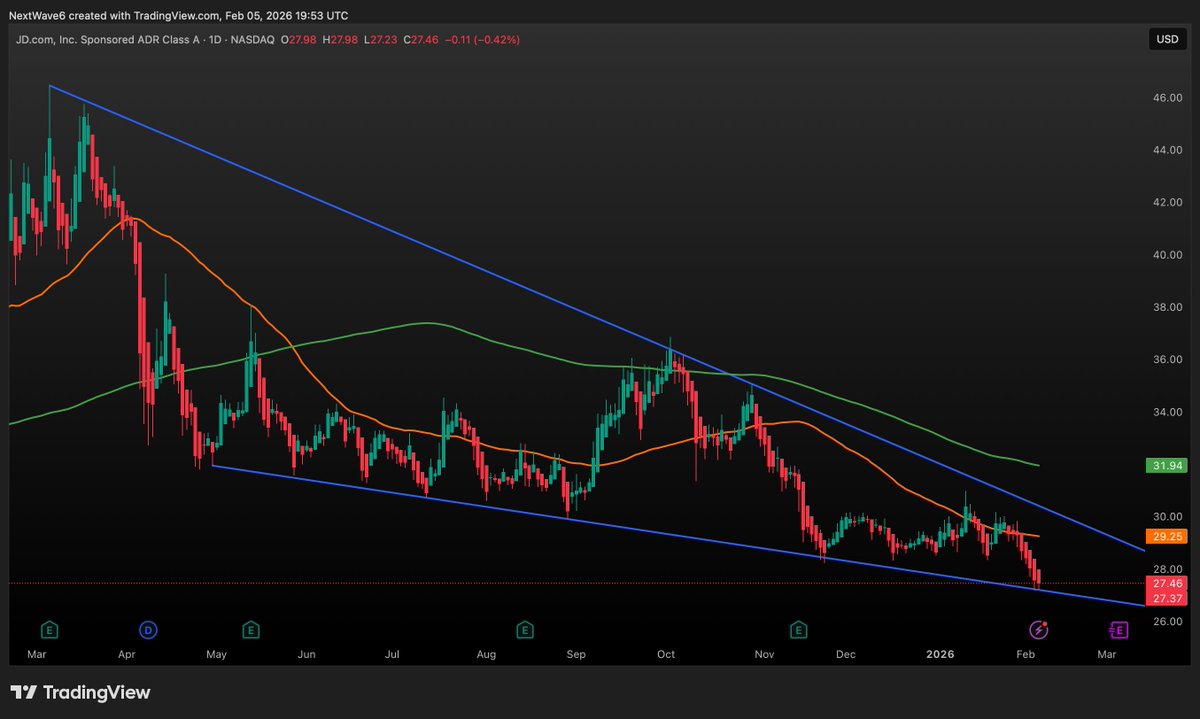
$JD Right at the lower trend line of this falling wedge, a key support level in the past I may add to my position if this holds
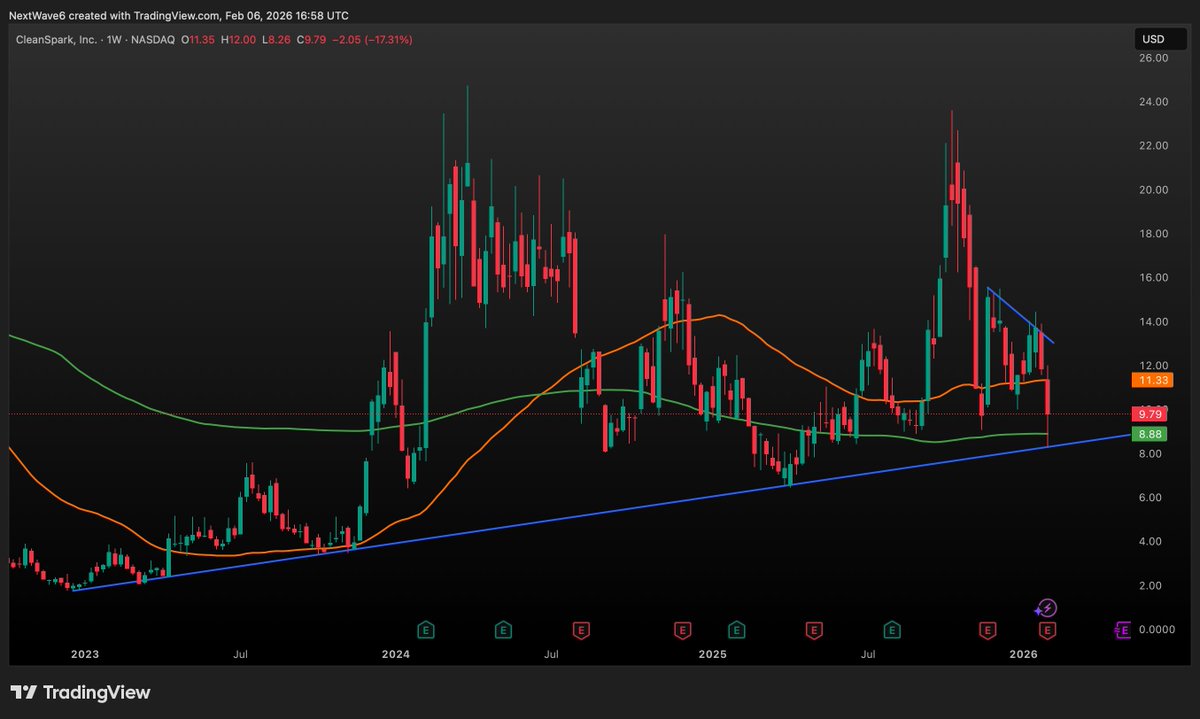
$CLSK +20% today A big bounce off this trend line and 200 Week MA confluence level
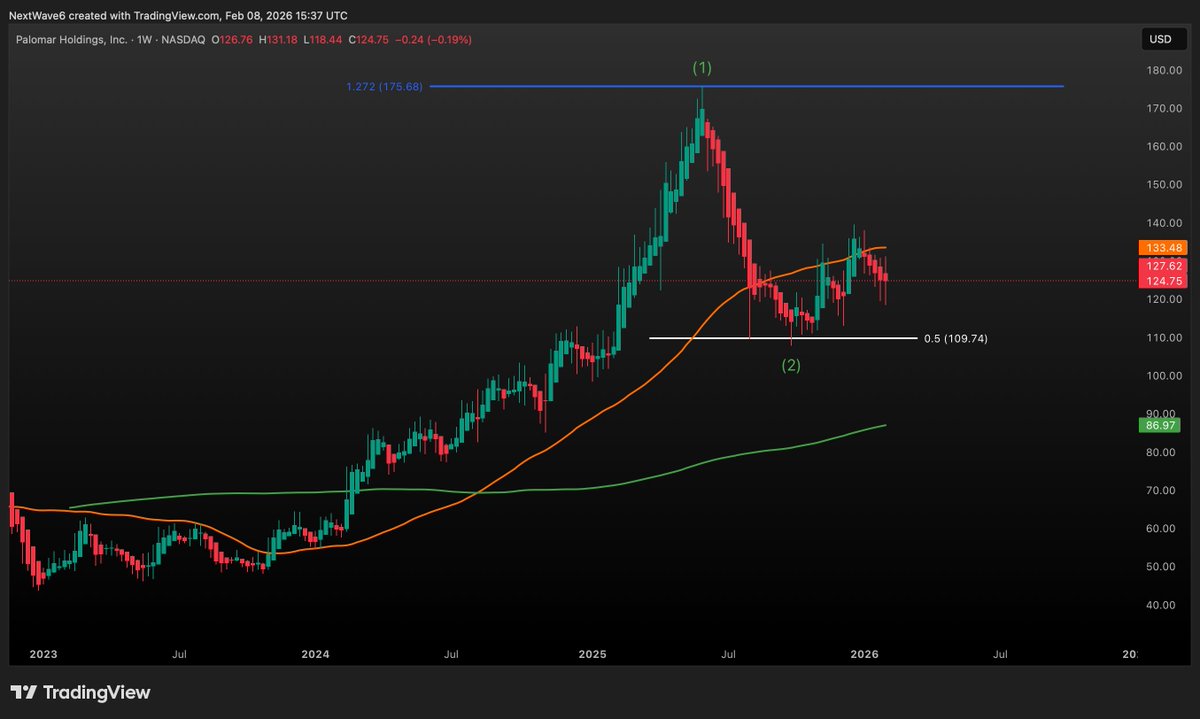
$PLMR Price had bounced off the 0.5 FIB a few weeks ago so we could be in Wave 3 now But we have not seen a clear ABC pullback yet, which could also mean we are in Wave B, so I won't buy just yet I have an alternate count I will upload soon, further suggesting we are in Wave B
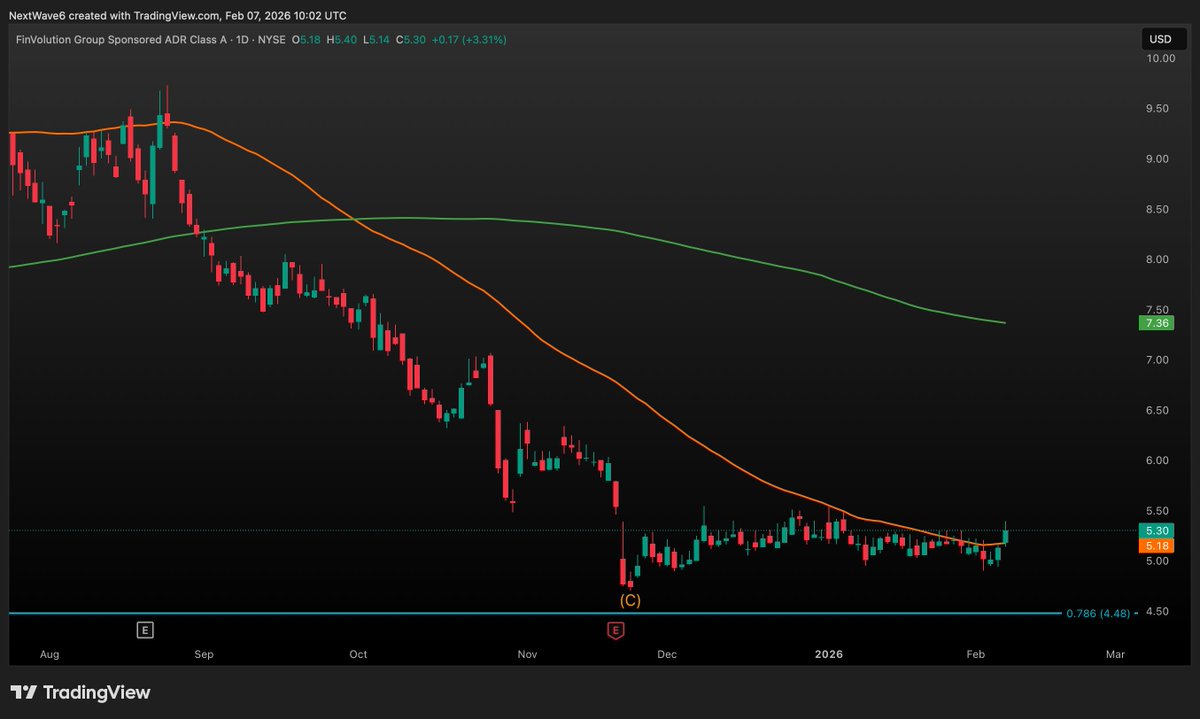
$FINV Price has finally broken the 50 Day MA I will probably take a starter position on Monday as we could be in Wave 3 now But I wouldn't be surprised if we see another leg down, where I can add further Search for $FINV on my profile to see why I have a $26 (400% up) target
What a crazy week! 15-20% moves have seemed normal lol, both up and down Do you think we continue today's green next week?
And price closes for the week right at this trend line Will we get a confident break of the trend line next week? $TGT
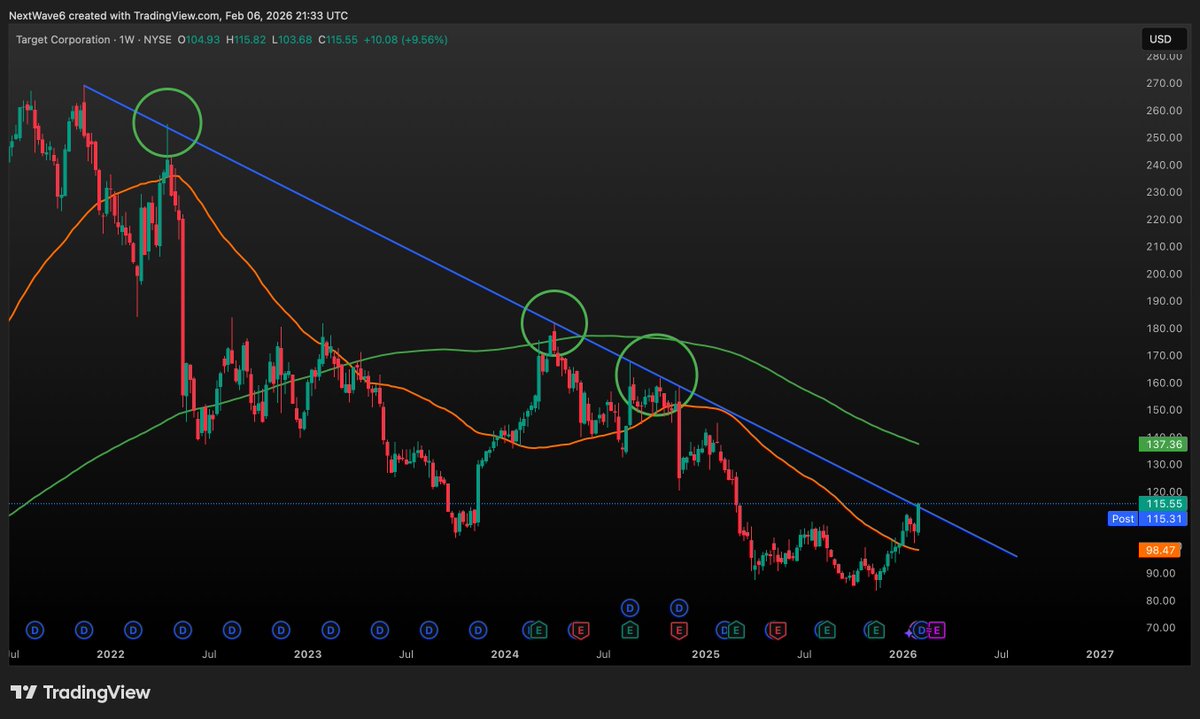
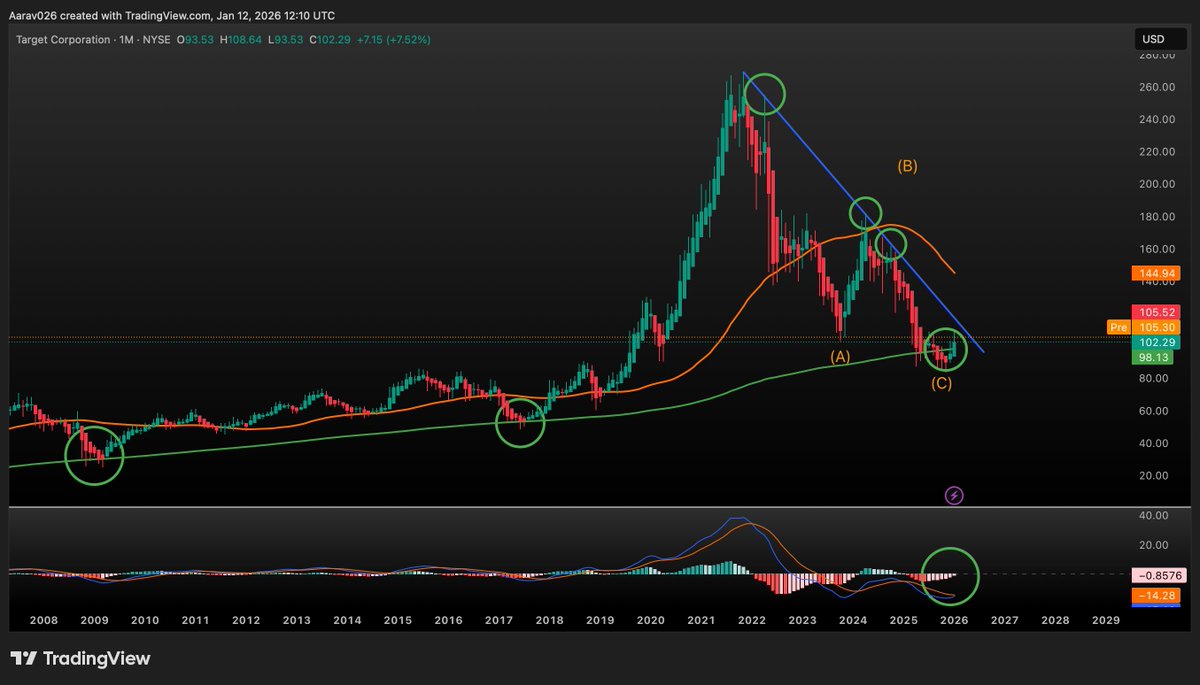
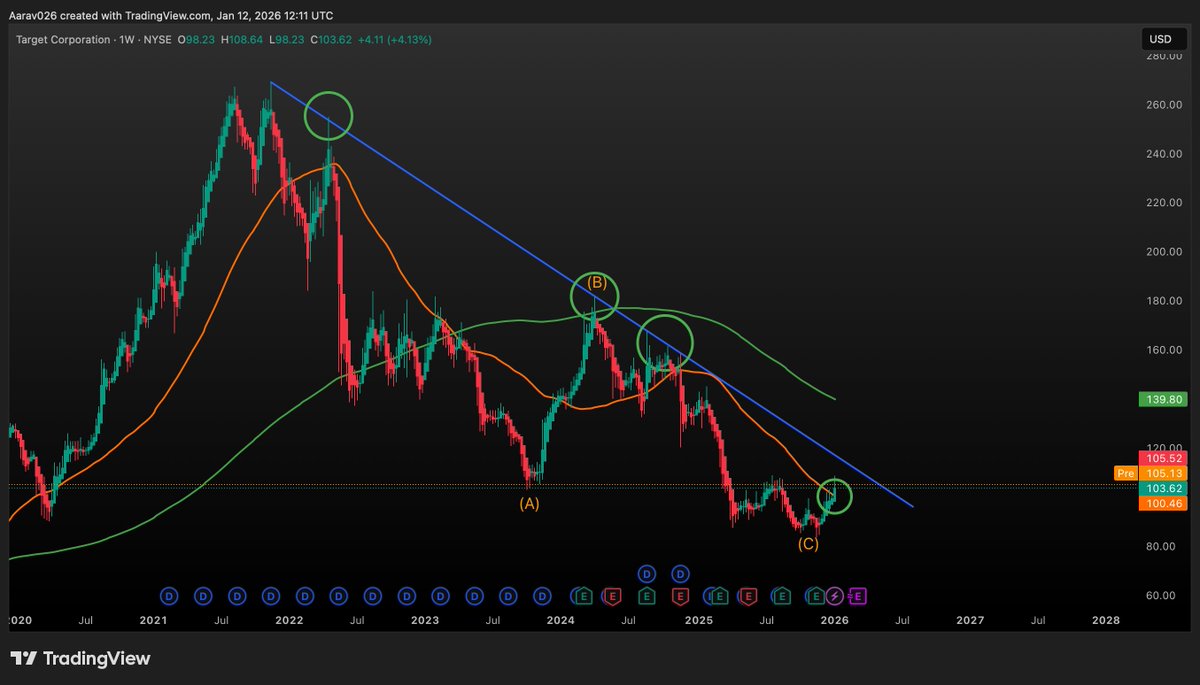
$TGT A low-risk long term opportunity brewing here: 1. Price is approaching this trend line which has not been broken since Nov 2021 2. The 200 month MA has been reclaimed 3. The 50 week MA has been reclaimed 4. Monthly MACD is about to flip green 4.3% dividend yield too
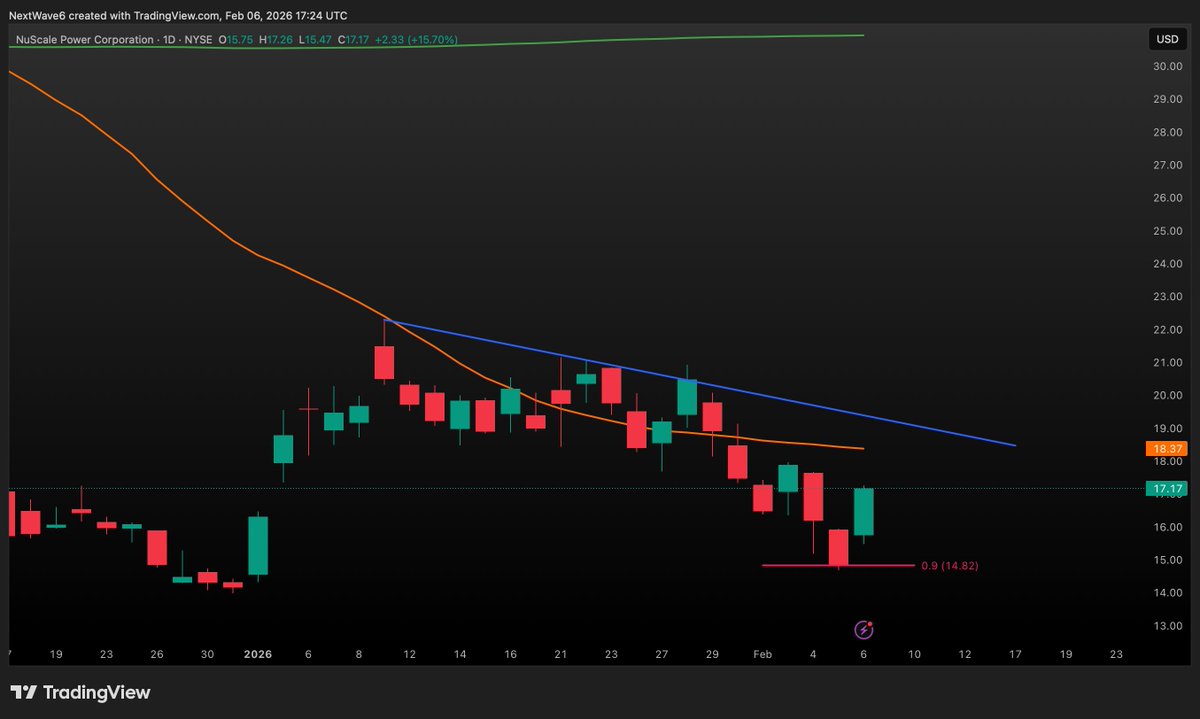
0.9 FIB works too... $SMR +17.5% today
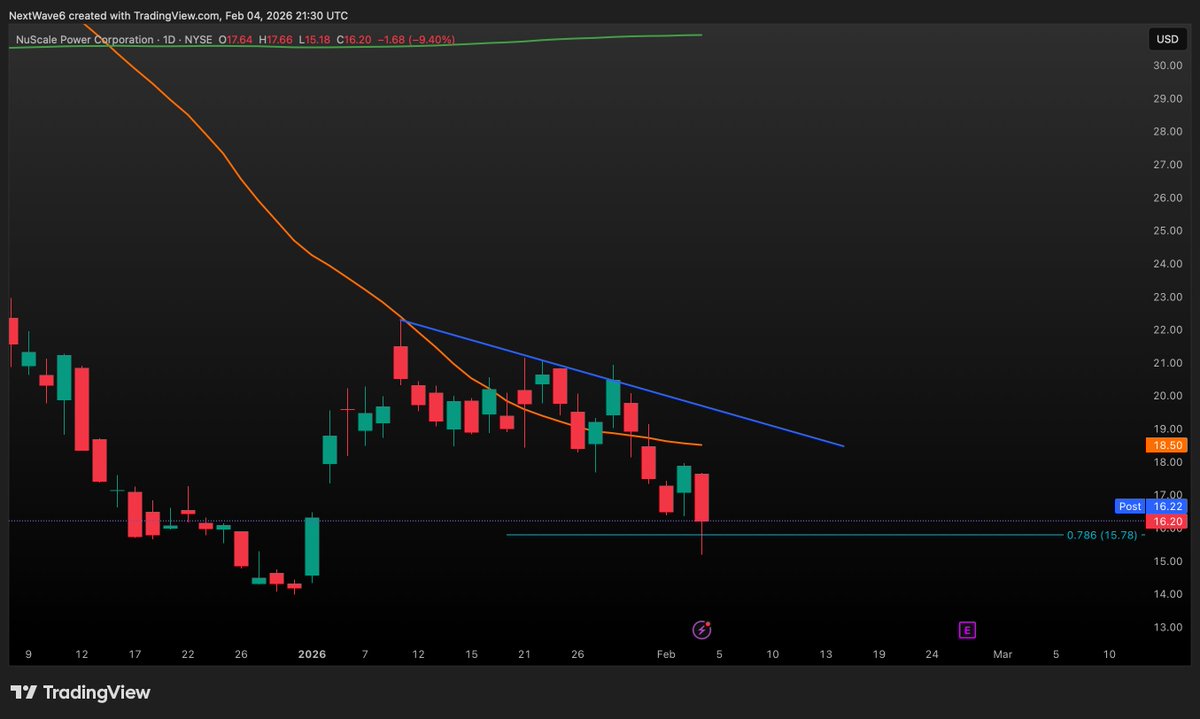
$SMR Before adding to my position here I want to see 3 things: 1) A hold of the 0.786 FIB level 2) Reclaiming the 50 Day MA 3) A break of the blue trend line What do you think of $SMR 🤔?


United States Trends
- 1. #WWENXT N/A
- 2. Purdue N/A
- 3. Real ID N/A
- 4. SWAT N/A
- 5. RINO N/A
- 6. Courtney N/A
- 7. Jaida Parker N/A
- 8. Alaska N/A
- 9. Kurt Cobain N/A
- 10. Murkowski N/A
- 11. #RingRoyale N/A
- 12. Jackson Drake N/A
- 13. Cluff N/A
- 14. Sesko N/A
- 15. Collins N/A
- 16. Greg Gutfeld N/A
- 17. ALDO EN RR N/A
- 18. Baylor N/A
- 19. Nancy Guthrie N/A
- 20. Save America Act N/A
Something went wrong.
Something went wrong.