
Plus3 Forecasting
@Plus3Forecast
Consistently lower your entry risk with the #Plus3Fuse ◦ Trade the $SPY ◦ #SP500 ◦ #ES_F ◦ $ES ◦ $NQ ◦ Day Trading ◦ Swing Trading ◦ Trader Enlightenment
You might like


eventually our website will have detailed information about the use of Plus3Fuse lines, for now perhaps this little cheat sheet will be of of help. please feel free to ask any questions or make suggestions - thank you! #Plus3Forecasting #Plus3Fuse

Happy Thanksgiving friends! I was going to say X friends but doesn't sound right lol While the rest of the world is busy carving turkeys and being grateful for “family time,” we both know what we’re actually thankful for - Red days that shake out the tourists, Gamma squeezes…
We reached a EQ line and this is of course resistance. Breaking above will open up the next level. Ref chart: x.com/Plus3Forecast/…
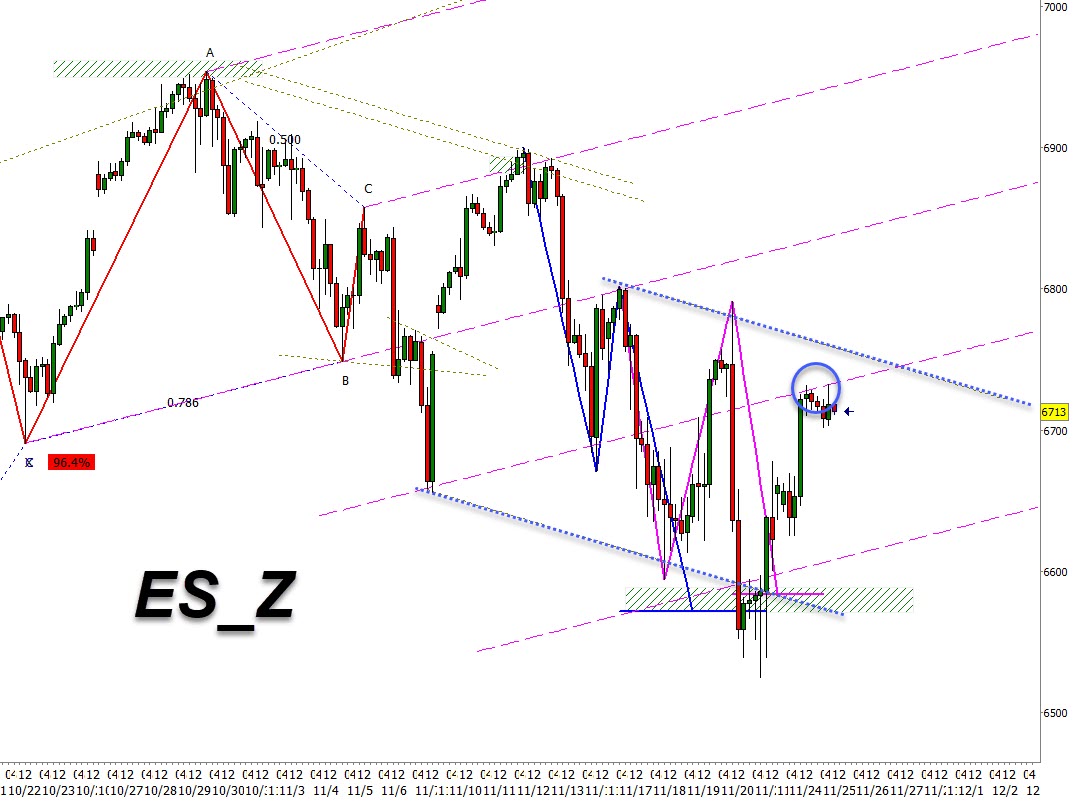
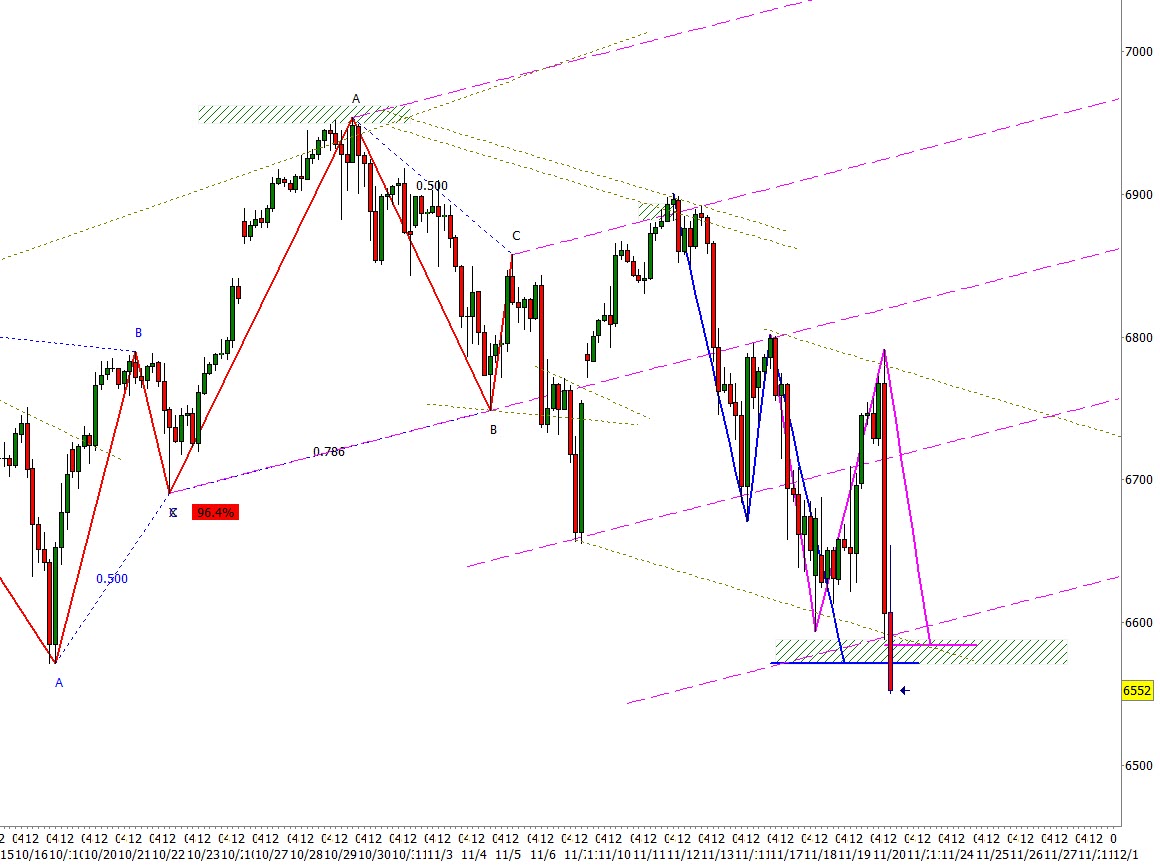
Maybe I was too quick to judge (ha!) but still watching this area where the two ABCDs terminated. I don't know about you guys but that looks like exhaustion. And if that is the case, a CIT low should be in but it's also liable to be messy, as in a dirty bottom. If price can…

🔥Plus3fuse is 6712.00 - as always firm above/weak below. The 📌message has more info on Fuse lines. $ES_Z
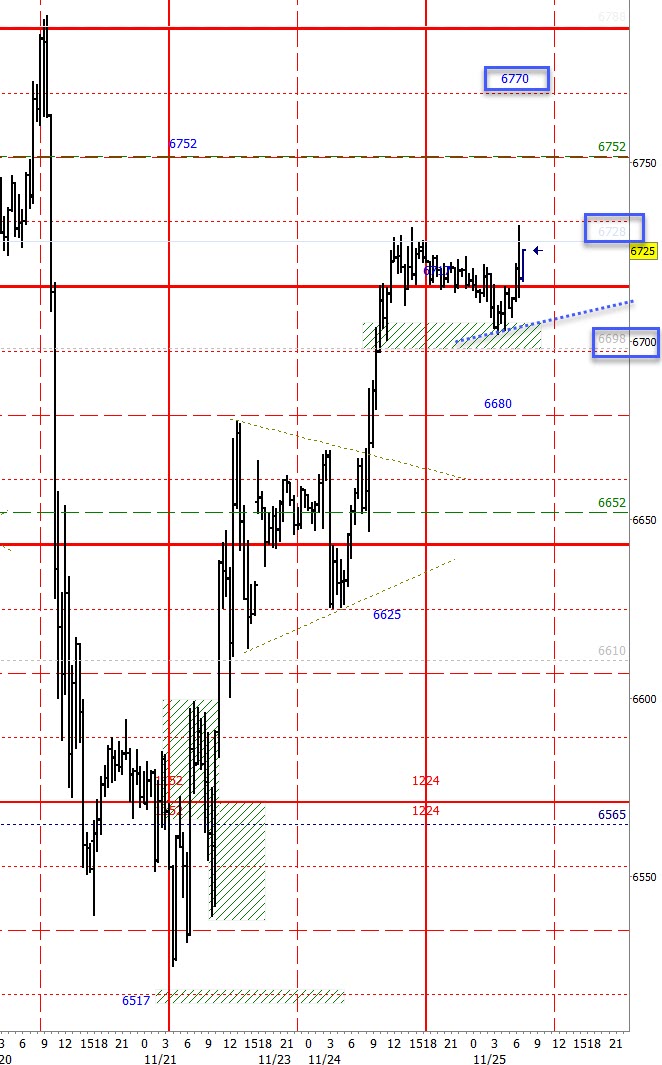
$ES_Z 30min: That 6698 I mentioned yesterday is still in play, you can see how we tested that zone overnight and recovered. For today, we could get a rinse & repeat as long as we can manage to hold above 6698 on any countertrends. IF we get stuck below 6698 we could get a rinse &…
2nd and last update of the day 🔥🔥Plus3fuse is 6710.00 as always firm above/weak below. The📌message has more info on Fuse lines. $ES_Z
🔥Plus3fuse is 6664.00 - as always firm above/weak below. The 📌message has more info on Fuse lines. $ES_Z

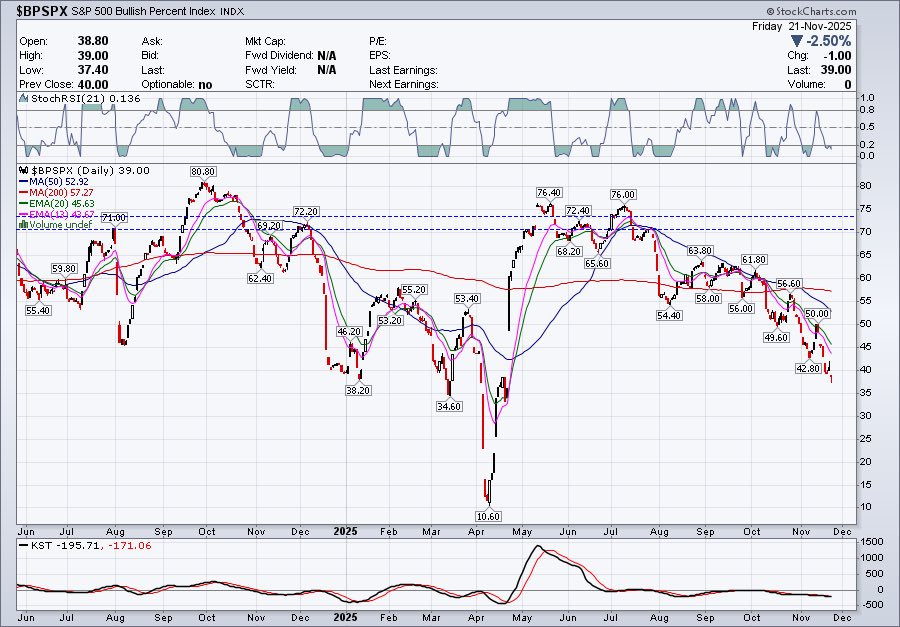
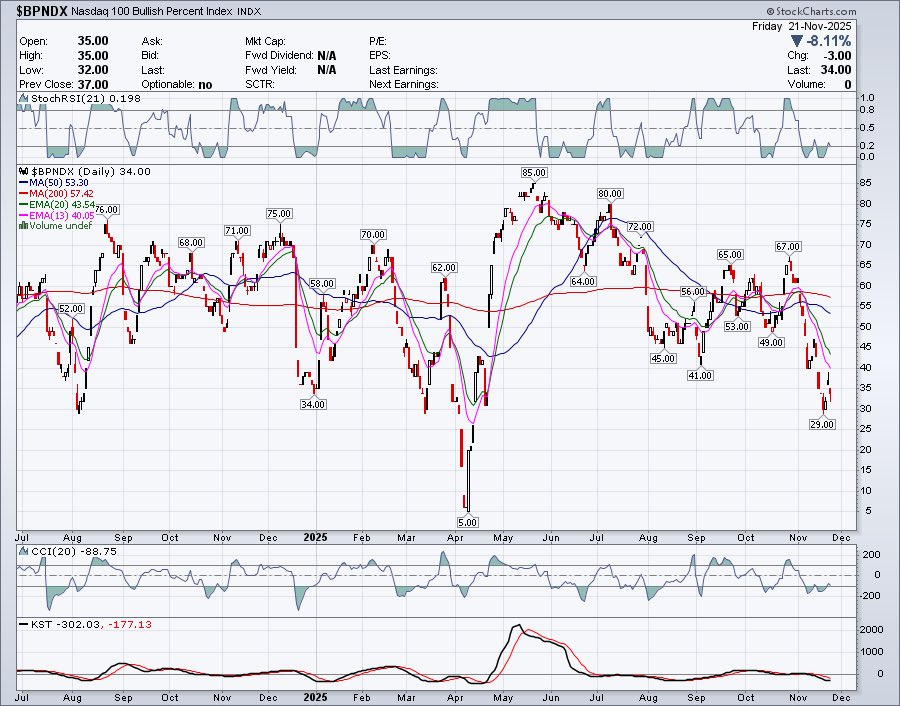
Something else that’s very cautionary is that the P&F charts for both $BPSPX & $BPNDX went bearish last week. A similar concept to my tracking StochRSI on $BPSPX & $BPNDX for KI$$ swing purposes. So this underscores the need to make sure price breaks out above resistance levels…
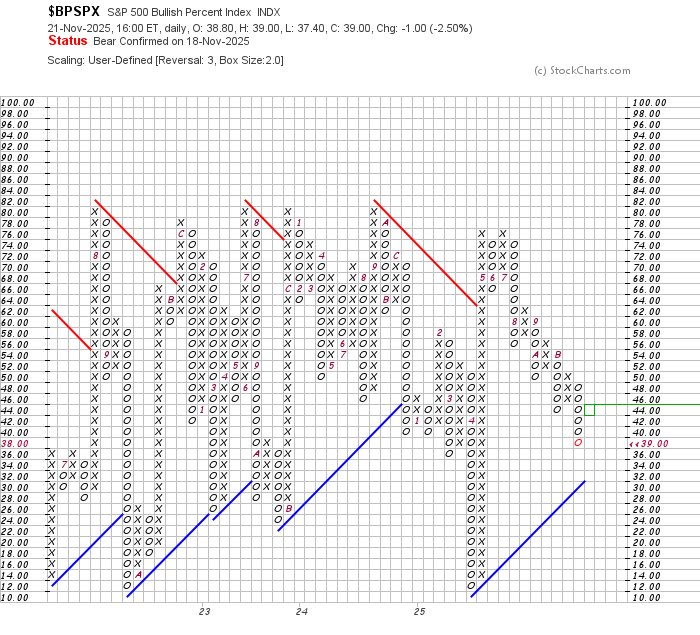
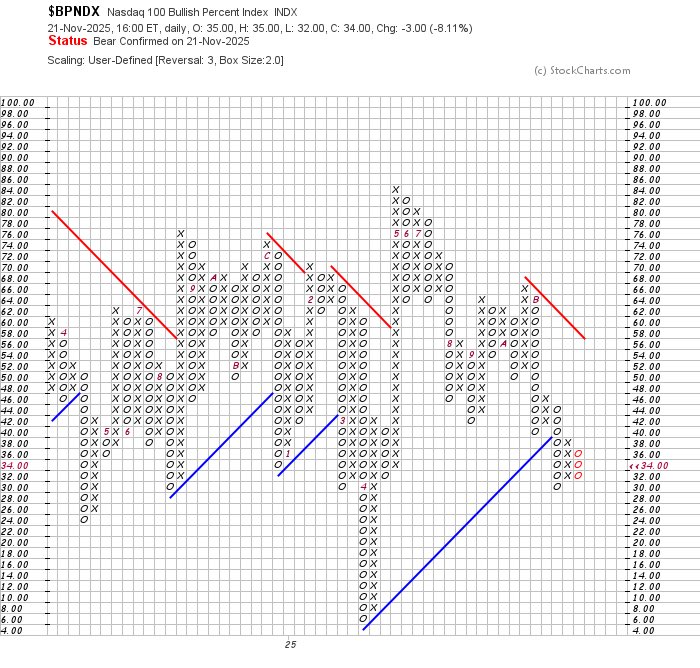
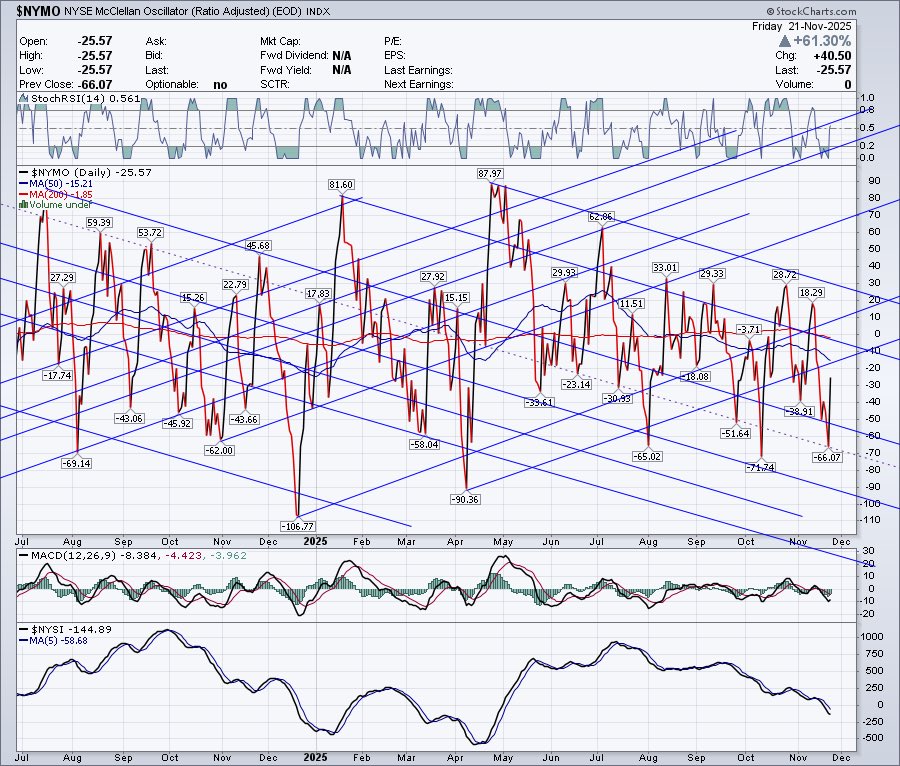
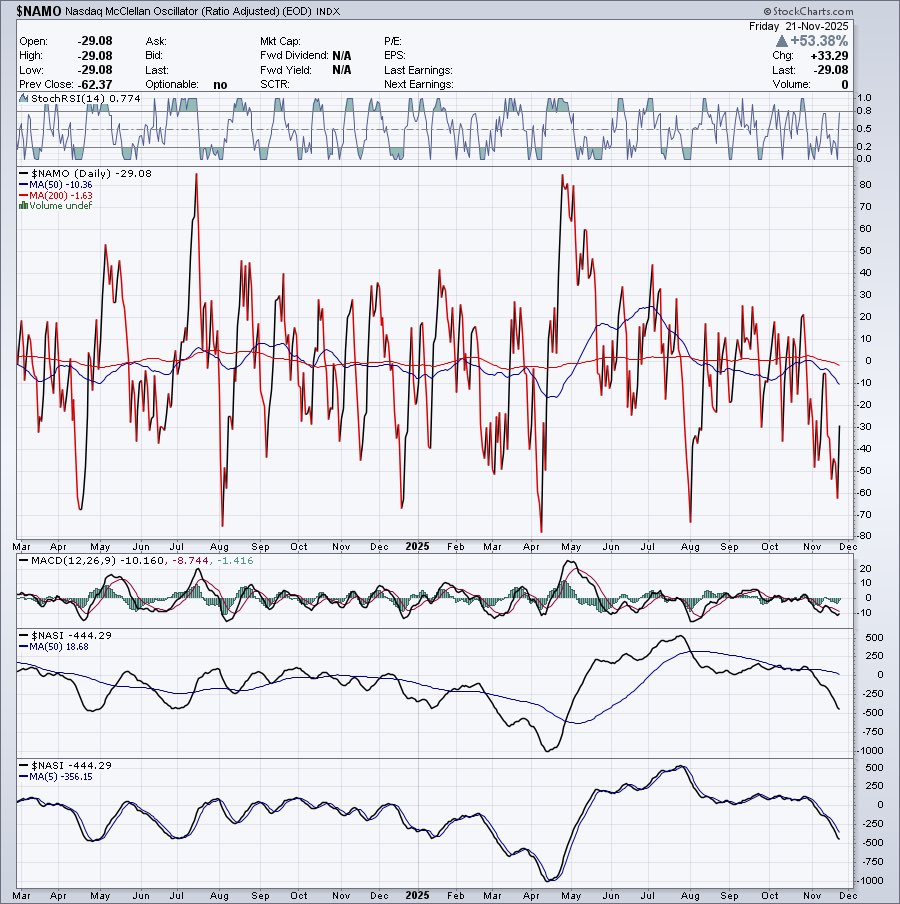
I want to shift bullish on $SPX $ES stocks because of what looks like an intraday wedge into Friday’s low. But for now, need price levels & pattern confirmation, because my KI$$ indicators are still bearish (StochRSI on $BPSPX & $BPNDX under 0.20, and $NYSI & $NASI below their…
Maybe I was too quick to judge (ha!) but still watching this area where the two ABCDs terminated. I don't know about you guys but that looks like exhaustion. And if that is the case, a CIT low should be in but it's also liable to be messy, as in a dirty bottom. If price can…
With that push past the target, outside of a reversal bar in this area, we are leaving the comfortable zone and we've come to the end of the useful life of this pattern. If you notice the lower channel in grey, this could also signal exhaustion and if that is the case, a reversal…
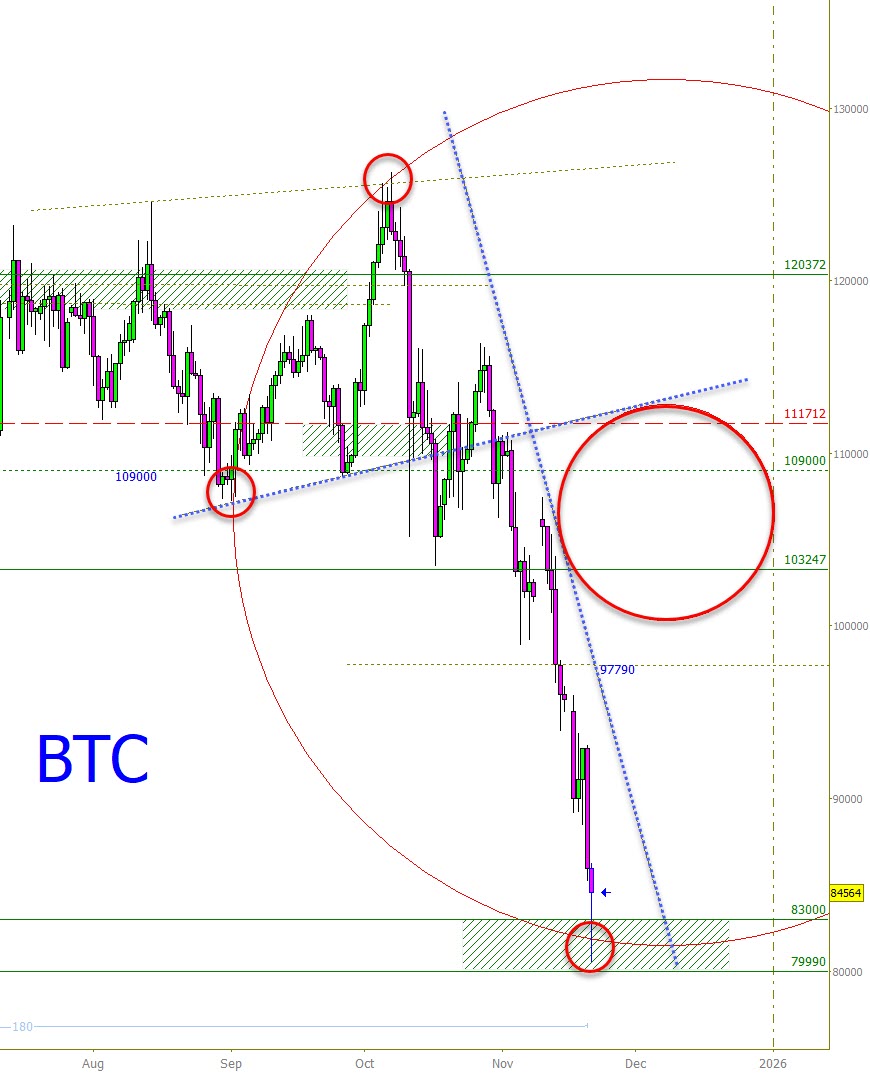
Daily $BTC chart, low squaring out and there is good reason to call a CIT here. Evidence would be the ability to hold above the zone in green. Market geometry people can study the lines and see how breaking out of the descending line will confirm the start of a confirmed CIT.…
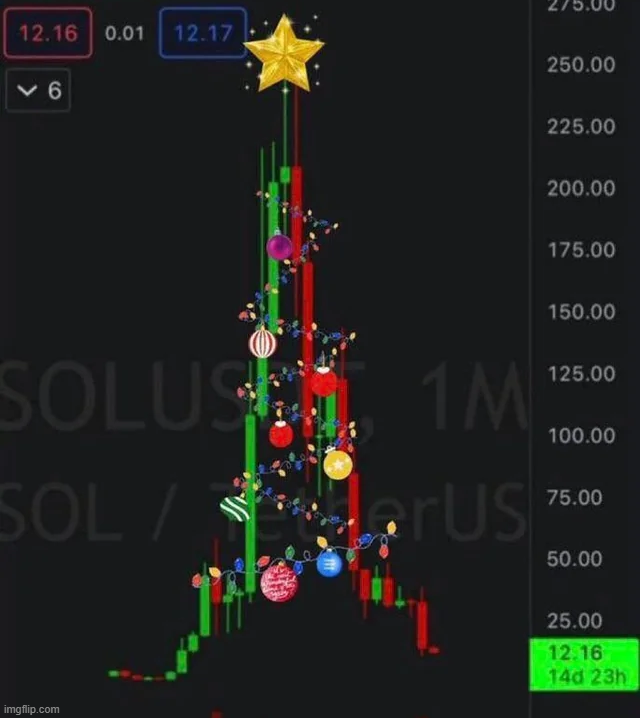
Looks like Santa’s delivering coal AND a crash 😶 ...time to HODL and hope for a New Year miracle!🙏😇


United States Trends
- 1. Black Friday 298K posts
- 2. Good Friday 46.2K posts
- 3. #DaesangForJin 54.2K posts
- 4. #ENHYPEN 168K posts
- 5. #2025MAMAVOTE 97.3K posts
- 6. ARMY Protect The 8thDaesang 2,877 posts
- 7. #GalxeID 5,113 posts
- 8. yeonjun 59.1K posts
- 9. #FridayFeeling 1,571 posts
- 10. Ravens 60.4K posts
- 11. Mnet 198K posts
- 12. Lamar 48.2K posts
- 13. Third World Countries 38.2K posts
- 14. ilya 21.1K posts
- 15. Sarah Beckstrom 252K posts
- 16. Mr. President 20.8K posts
- 17. Shane 26.1K posts
- 18. BNB Chain 6,816 posts
- 19. Jack Ruby N/A
- 20. Wegmans 2,248 posts
You might like
-
 ً
ً
@turintrader -
 Bob Lang
@aztecs99 -
 Benn Maldonado
@BennMaldonado -
 CyclesFan
@CyclesFan -
 TheGannMan
@stoxrock -
 [email protected]
@GannAnalysisLLC -
 Queen
Queen
@tey_west -
 Chris Kimble
@KimbleCharting -
 PaxTrader777🇺🇸
@paxtrader777 -
 TradeWithProfile
@tradewithprof -
 Chris Carolan $=1/∞
@spiralcal -
 Chris Ciovacco
@CiovaccoCapital -
 Gann Club
@gannclub -
 Fibonacci Princess aka Trader Tammy
@TraderTammy1 -
 See It Market
@seeitmarket
Something went wrong.
Something went wrong.