
PrecisionStockPicks
@PrecisionPicks
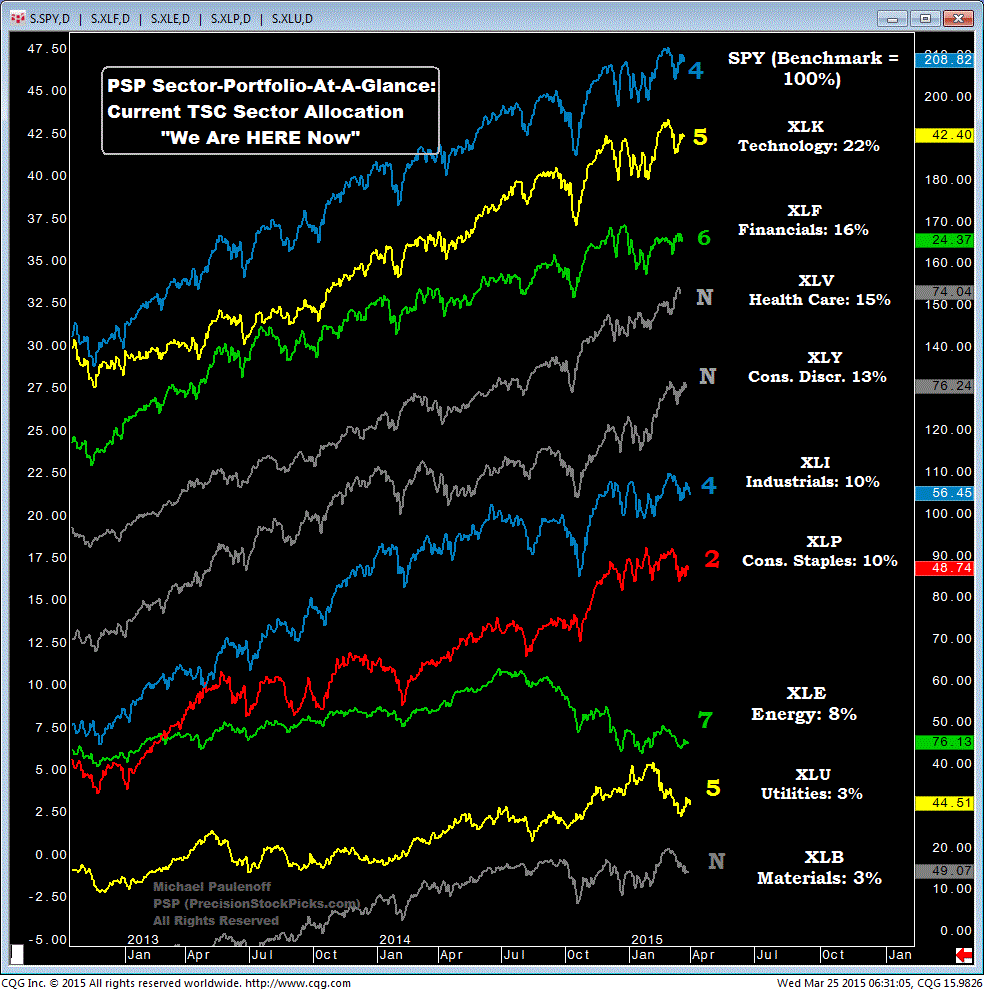
PSP is home to my 'S&P 500 At-A-Glance' Sector Summary where I rank every sector on a 1-10 Trend Strength scale. Daily updates of the SPY, XLF, XLE, and more.
You might like


This AMs S&P Sectors Table, with my 1-10 Trend Strength Coefficient $SPY $XLK $XLF $XLV $XLY $XLI $XLP $XLE $XLU $XLB
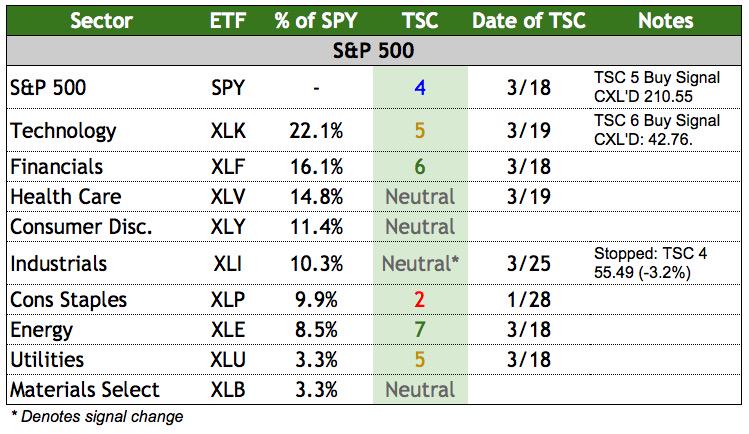
S&P Sectors-At-A-Glance, with my 1-10 Trend Strength Coefficient $SPY $XLK $XLF $XLV $XLY $XLI $XLP $XLE $XLU $XLB
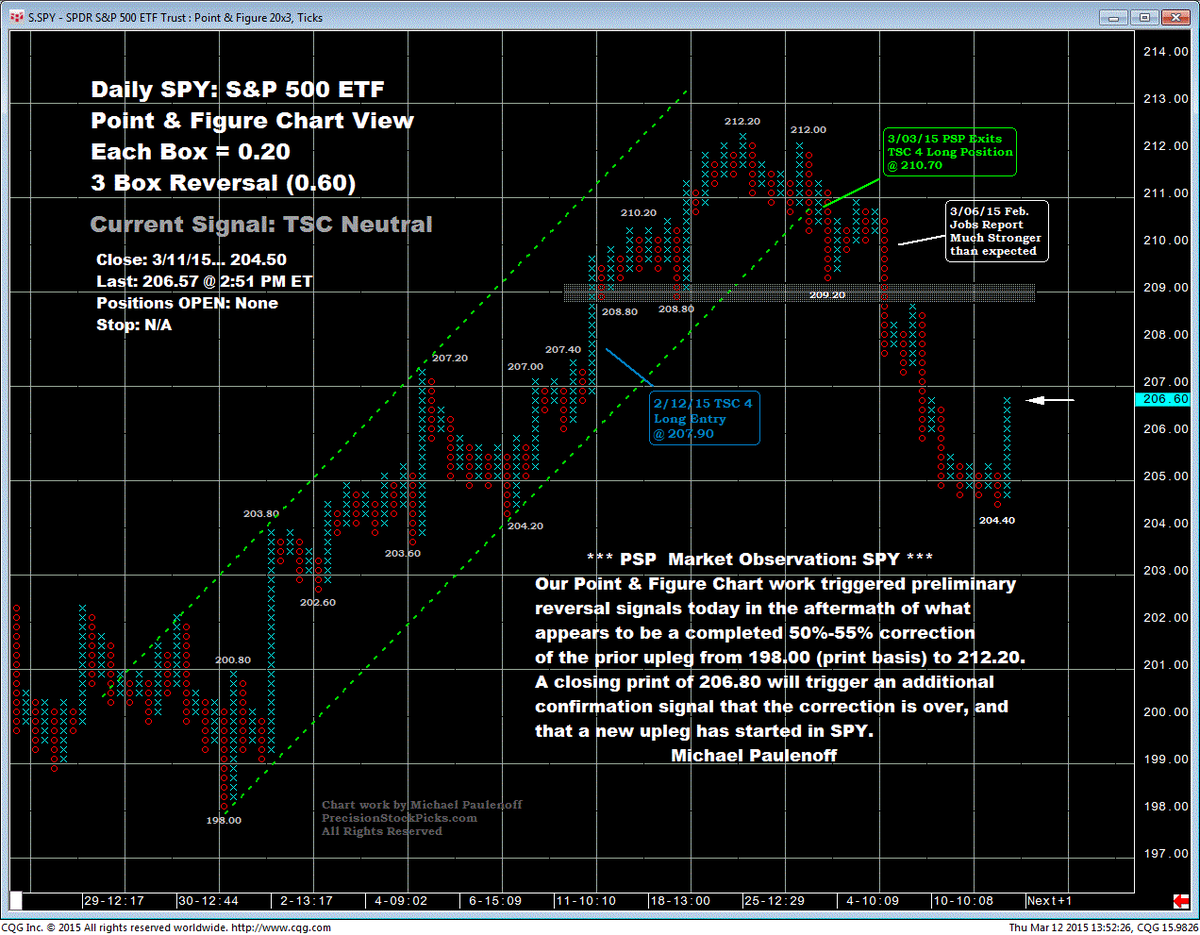
$SPY Point & Figure Triggers Preliminary Upside Reversal Signal
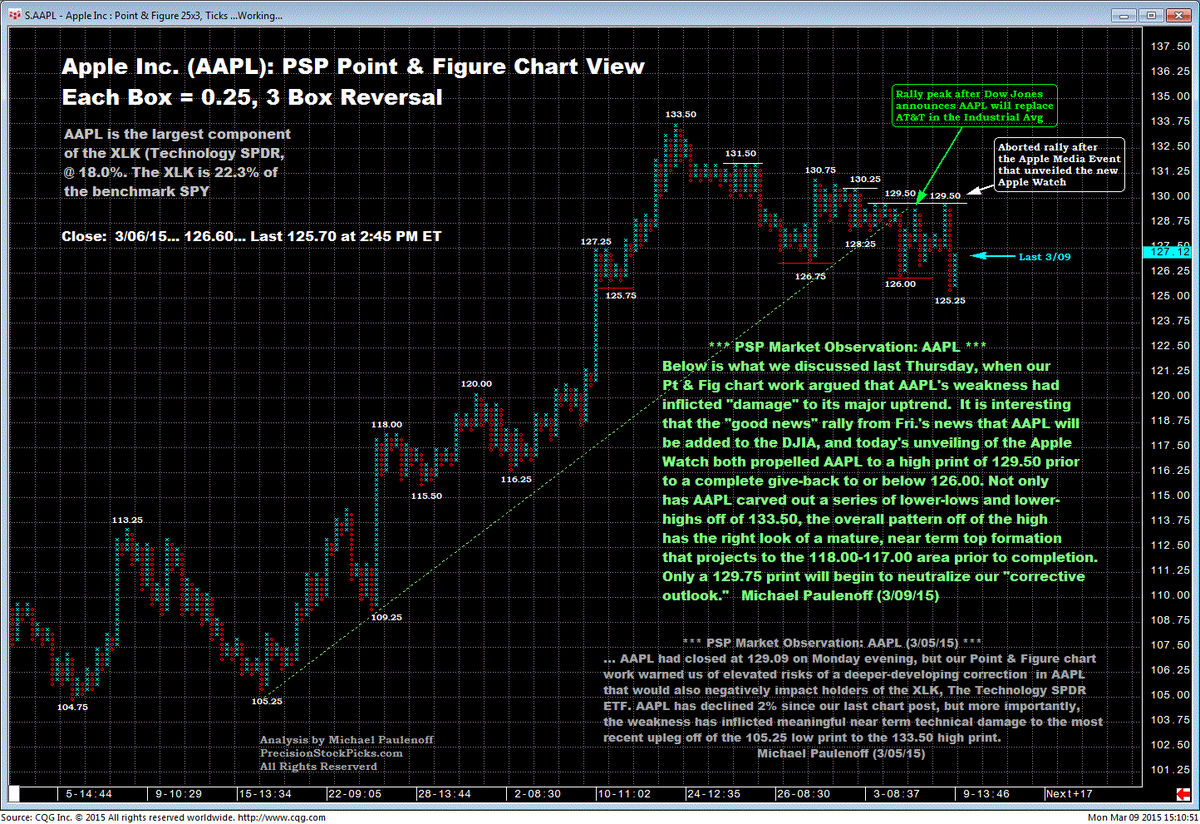
$AAPL Continues to Follow Our Pt & Fig. Chart Script
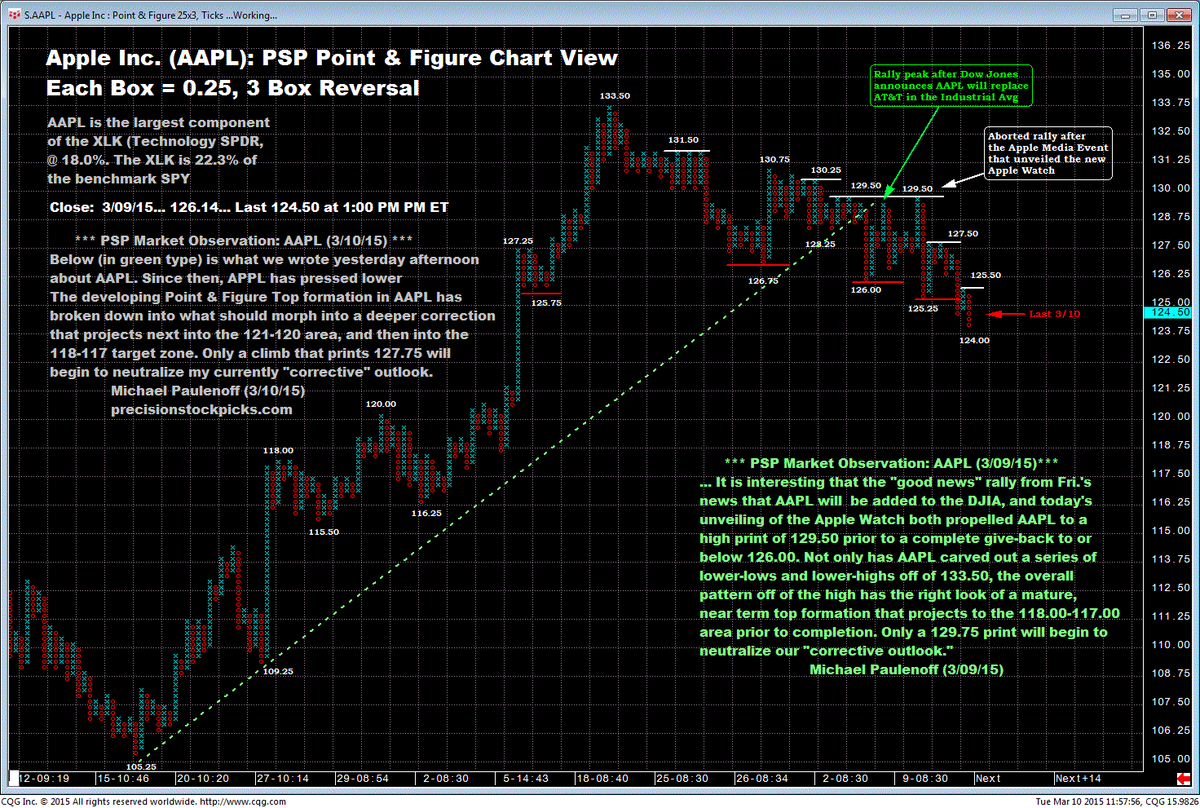
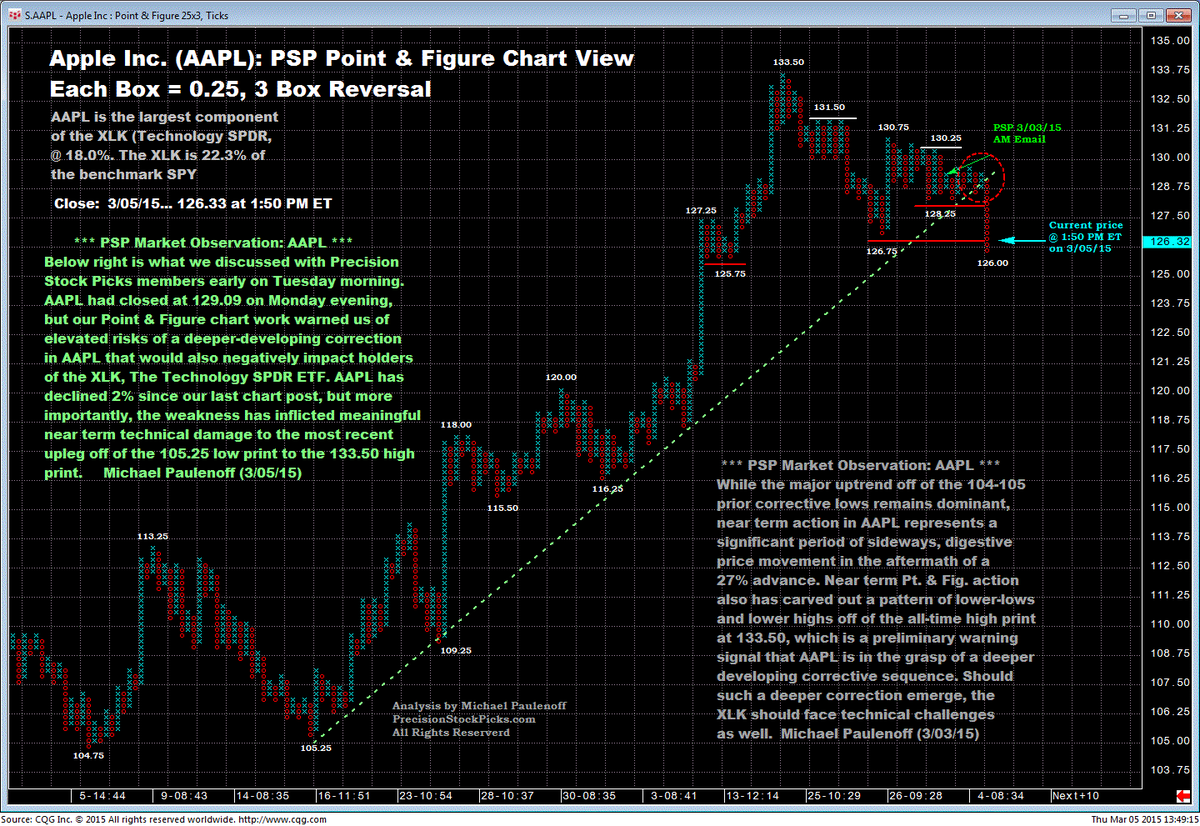
$AAPL's Weakness Follows Our Near Term Technical Script
Brent Crude Oil Nears an Important Inflection Point $BNO $USO stks.co/t1b9v
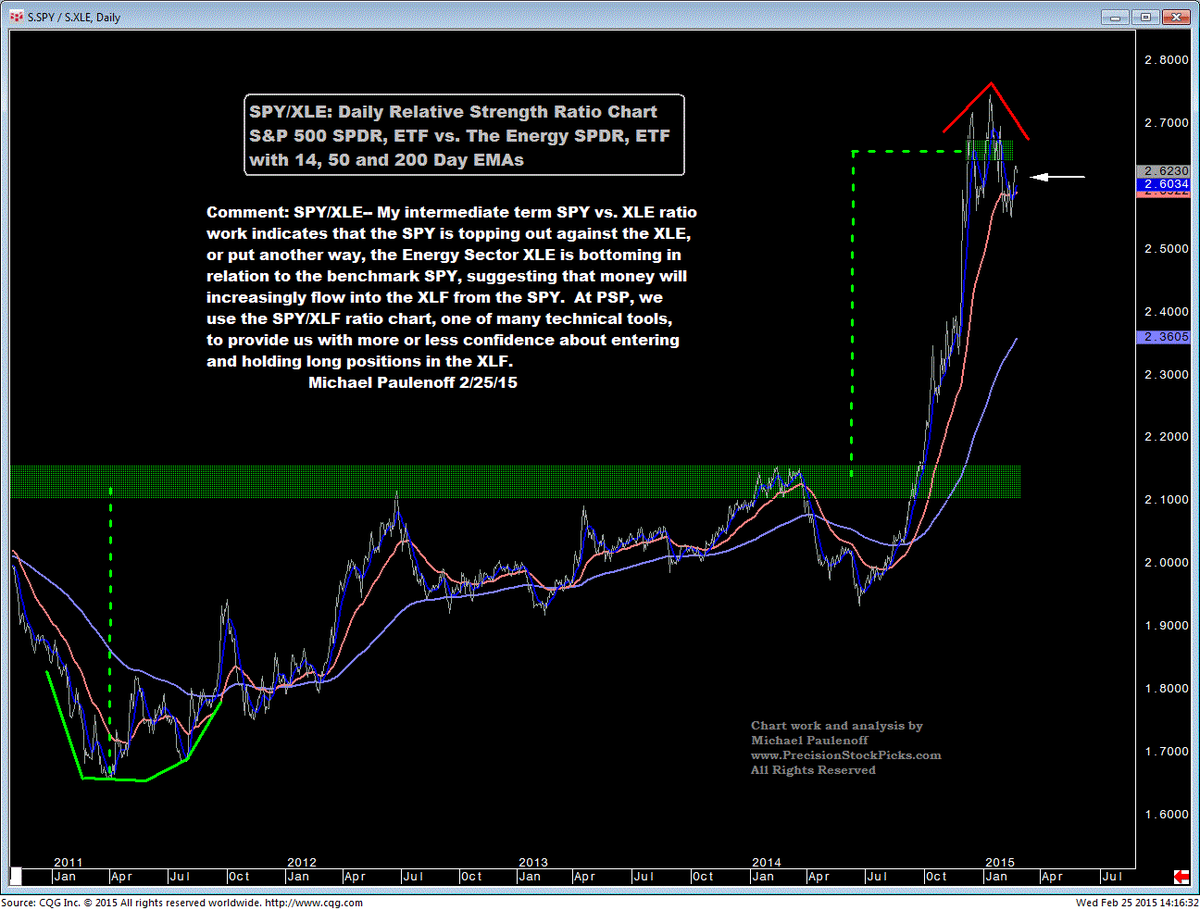
Is Ratio Chart Telling Us Anythig Abt The Expected Relative Performance of Benchmark $SPY vs the Energy Sector $XLE?
Post-Yellen, Our $SPY PT & FIG Chart Points Higher stks.co/p1ZJe
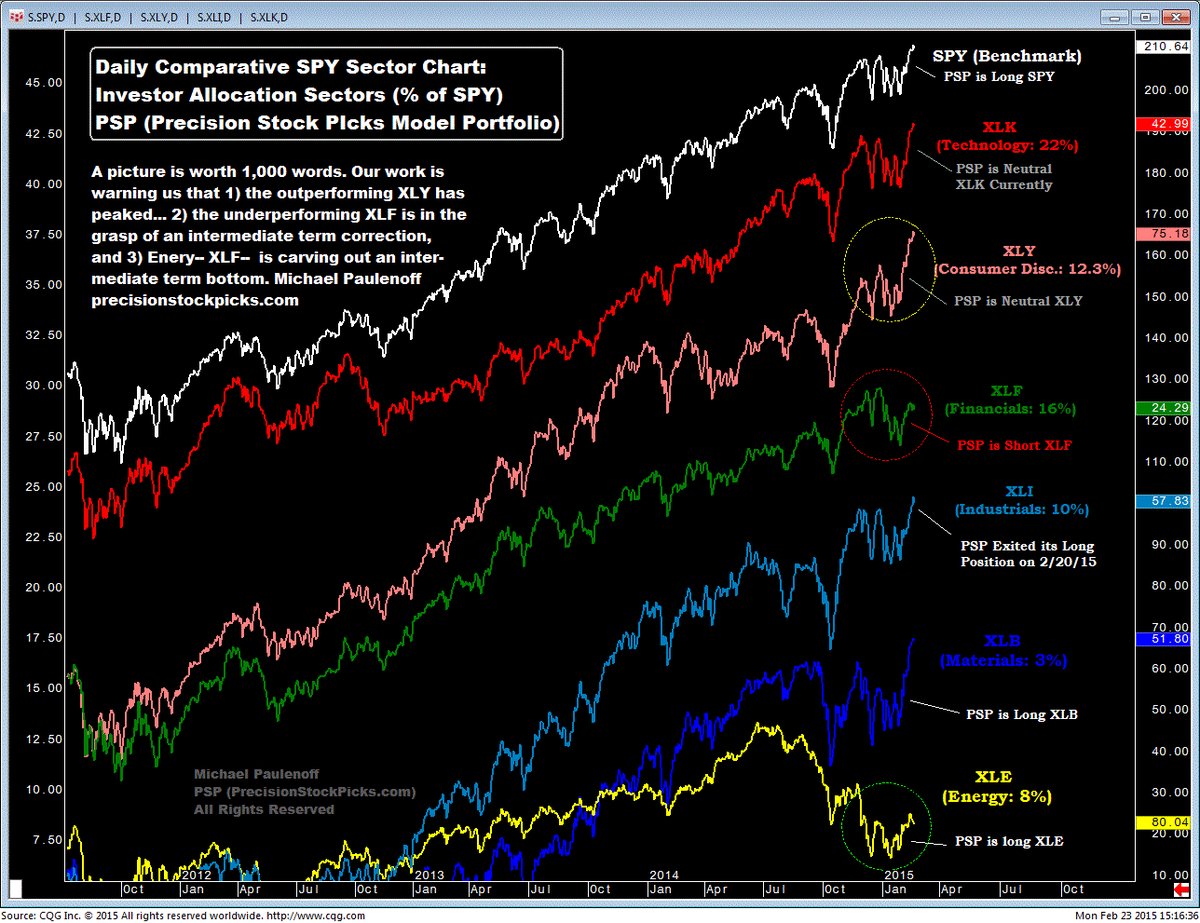
A birdseye view of the $SPY and its major "offensive" sub-sectors has a story to tell...$XLK $XLF $XLY $XLI $XLB $XLE
Brent Oil Nears an Important Inflection Price Zone $USO $BNO stks.co/a1Koo
Is $XLP Hinting About a Change in Profile for the Benchmark $SPY? stks.co/c1K6p
Is the $SPY vs. $XLY Relationship Telling Us Something Important About The Real Economy? stks.co/p14H3
Sooner than later, the $XLI Will Need $GE to Take the Lead stks.co/j1JgI
Is the $SPY/$XLE Ratio Whispering Anything Important About The Underperforming Energy Sector? stks.co/c1F4K
$XLI experienced the longest and deepest correction (-12.5%) and has led the upside charge. What now? stks.co/d1ElN
NEW POST: $SPY Reverses into a Key Downside Reversal Session... stks.co/b0FM1
all eyes on the 10-year yield... $TLT $TBT $TNX stks.co/i0InH
$GLD has triggered its 1st bullish strength of trend coefficient 6 signal since Aug '12 $PHYS $NUGT stks.co/h0HMf
$DXY is under pressure, and is vulnerable to Yellen testimony stks.co/f0GtG


United States Trends
- 1. Epstein N/A
- 2. Jay Z N/A
- 3. Pusha N/A
- 4. Mariah N/A
- 5. Iron Lung N/A
- 6. SANTA FROST WARM SIGN N/A
- 7. Billy Porter N/A
- 8. Bill Gates N/A
- 9. #OPLive N/A
- 10. #Santa1stFSinShanghai N/A
- 11. #questpit N/A
- 12. Hanoi Jane N/A
- 13. Watts N/A
- 14. Marina N/A
- 15. Izzo N/A
- 16. Girls FTW N/A
- 17. Moltbook N/A
- 18. Podz N/A
- 19. $Accelerando N/A
- 20. #DragRace N/A


Something went wrong.
Something went wrong.