
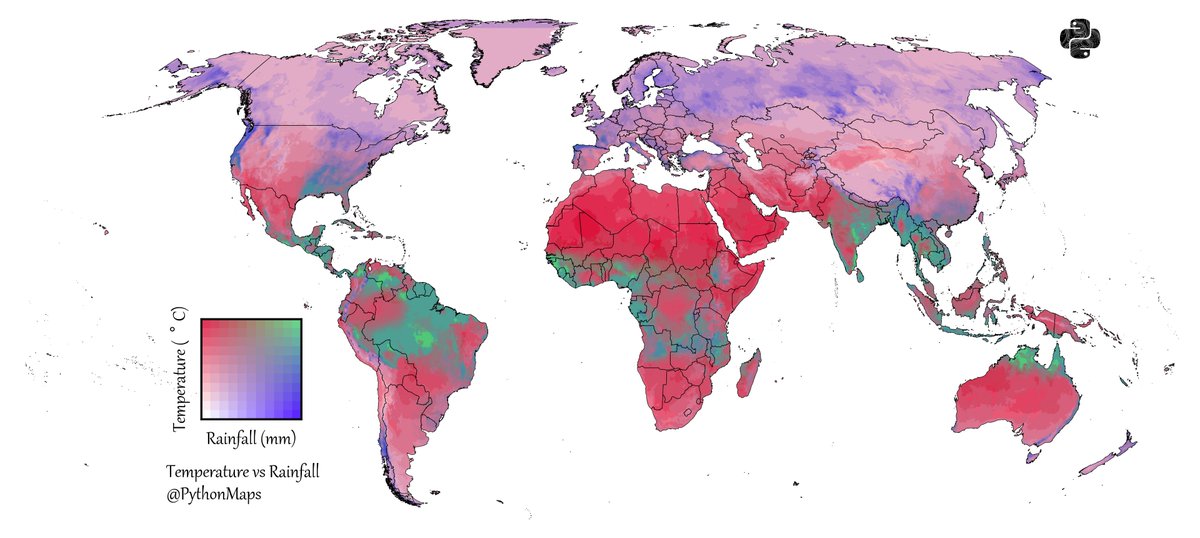

How is Colombia’s Pacific region so red? Looks fishy

The center of the Amazon is that dry? Maybe is data of the dry season?


thank you when my girl didn't go down she said it was bivariate and now I know why I couldn't finish.
United States Trends
- 1. Good Thursday 23.5K posts
- 2. Happy Friday Eve N/A
- 3. #Talus_Labs N/A
- 4. #thursdayvibes 1,774 posts
- 5. Lakers 81.9K posts
- 6. Luka 71.8K posts
- 7. #River 4,319 posts
- 8. Wemby 27.8K posts
- 9. Marcus Smart 6,518 posts
- 10. #LakeShow 5,866 posts
- 11. Unplanned 5,971 posts
- 12. #AmphoreusStamp 7,662 posts
- 13. Blazers 9,389 posts
- 14. Captain Kangaroo 1,196 posts
- 15. Russ 11.5K posts
- 16. Vatican 10.6K posts
- 17. Richard 45.6K posts
- 18. Ayton 17.5K posts
- 19. Shroud 5,739 posts
- 20. Shabbat 6,997 posts
Loading...
Something went wrong.
Something went wrong.