

p is for practice - #XLMUSD TradingView tradingview.com/chart/XLMUSD/L… always charting probabilities. XLM investors put the long pants on trying to be trending.
Talk to yourself about hobbies and ponder things you're reading. engange in deep thought. get below the surface lexicon. Read the lexicon of Angels, the scriptures and seek first the kingdom of God. Those 1,500 - 3,000 words could be 10% for the Lord, at least.
Most people only use about 1,500 to 3,000 words regularly in everyday conversation, a range known as the surface lexicon.
ES 10/9 - #ES1! TradingView tradingview.com/chart/ES1!/zvA… @TopstepTV #FASTMARKETS plan the trade, trade the plan.

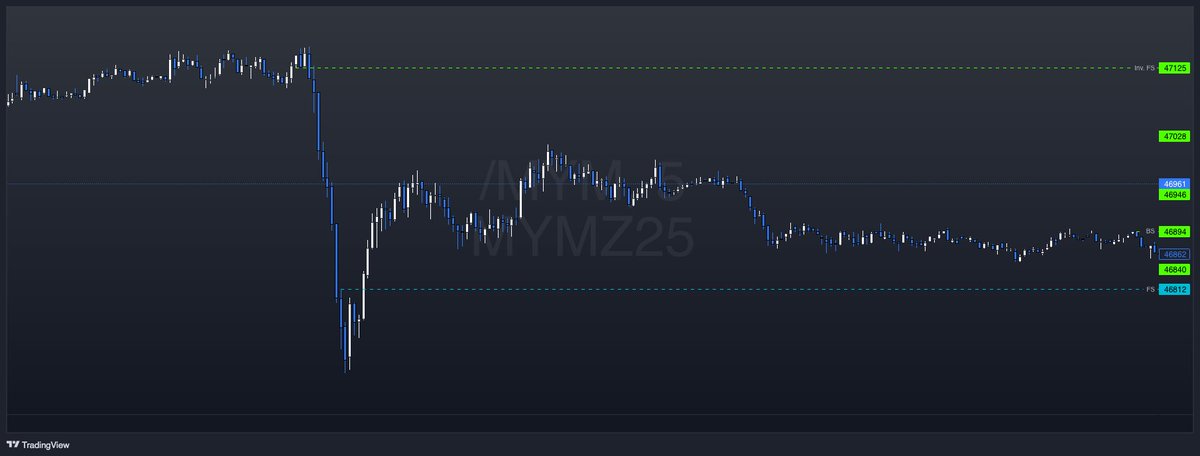
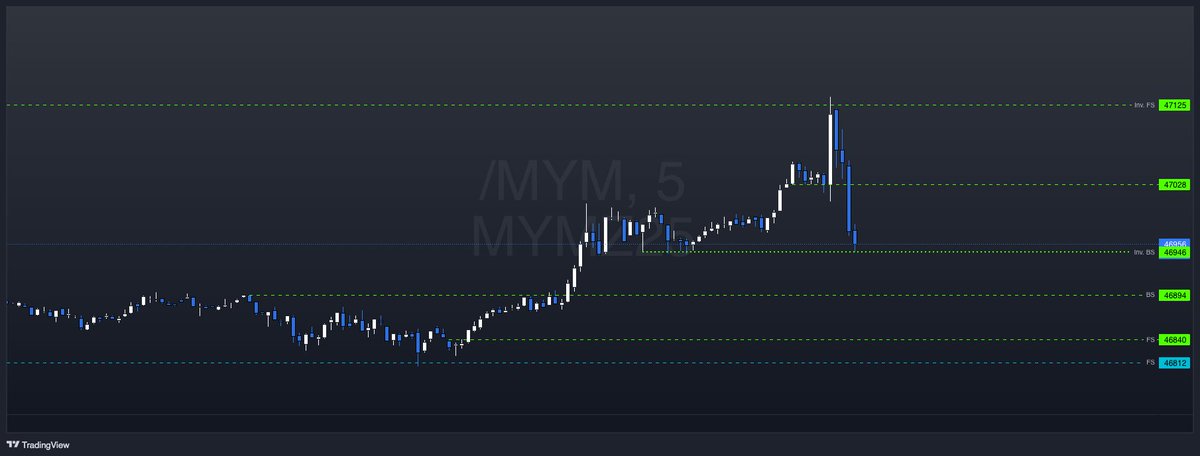
Gold chart from earlier this morning/last night. tradingview.com/chart/GC1!/WAb…

Look at these candles. The 5min Inverse FrontSide (Inv.FS) level in green was the perfect target to short and the long was a 15min Frontside (FS) in blue which also tested perfectly at 2:00 UTC-6
ES 10/6 Week 41 tradingview.com/chart/ES1!/KET…

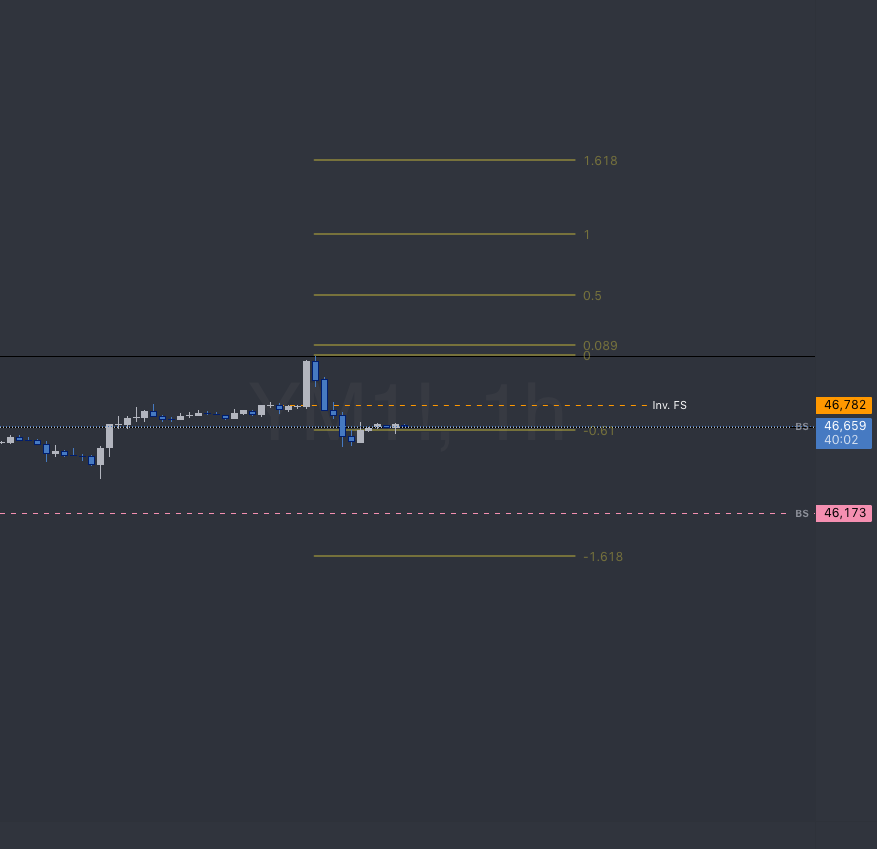
YM 10/2 - #YM1! TradingView tradingview.com/chart/YM1!/aTu… @TopstepTV #fastmarkets

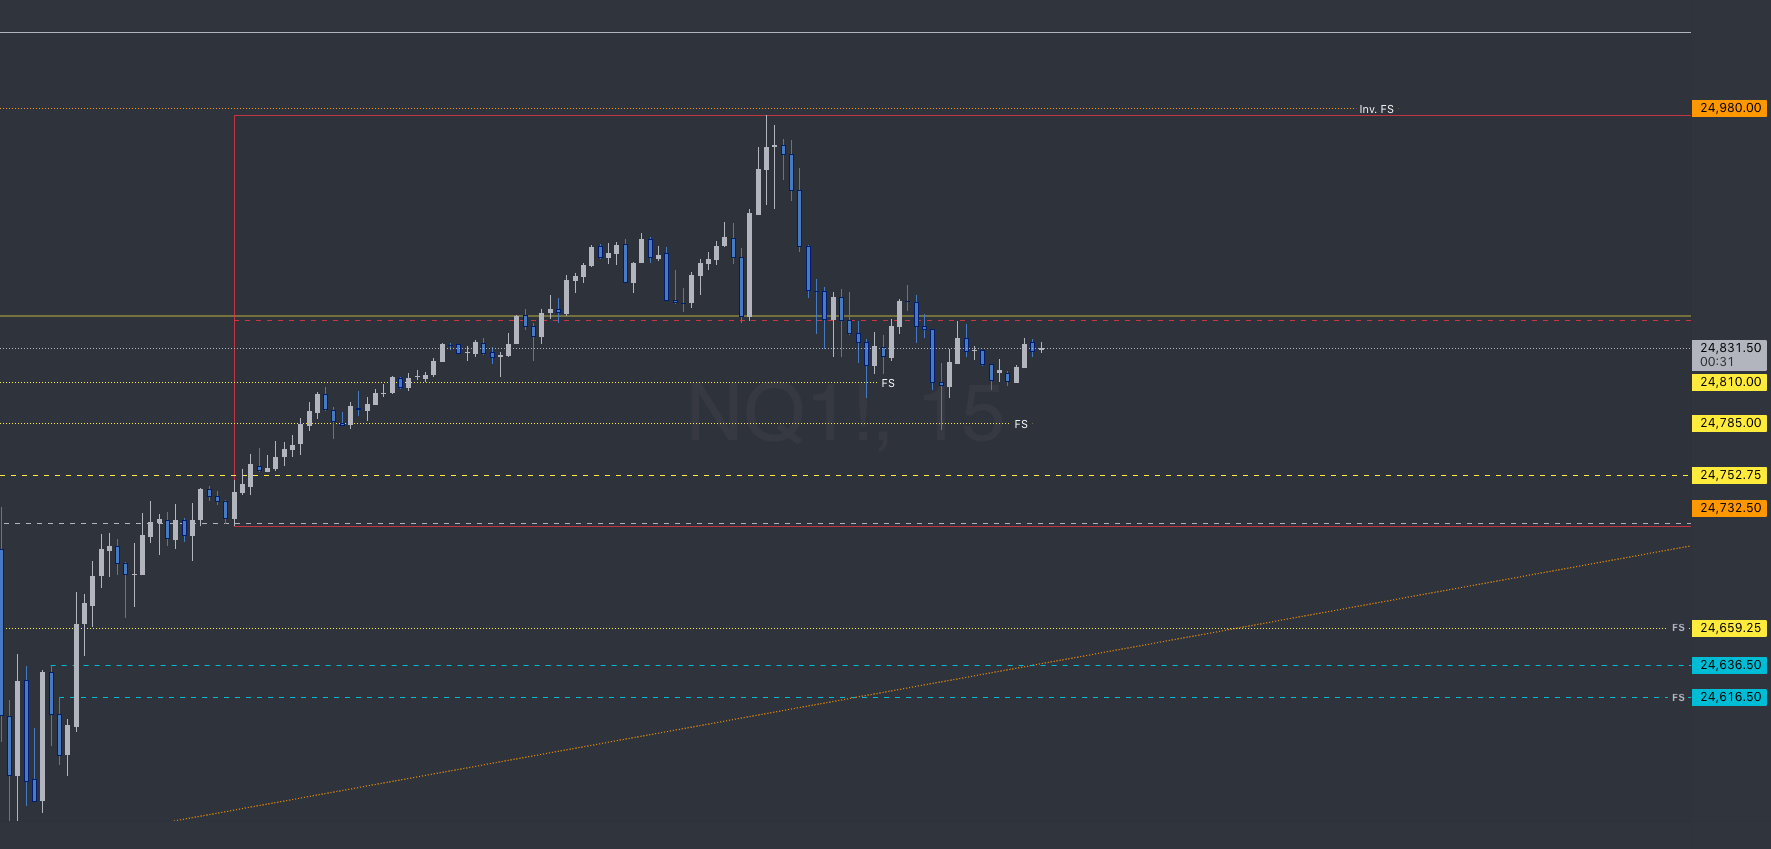
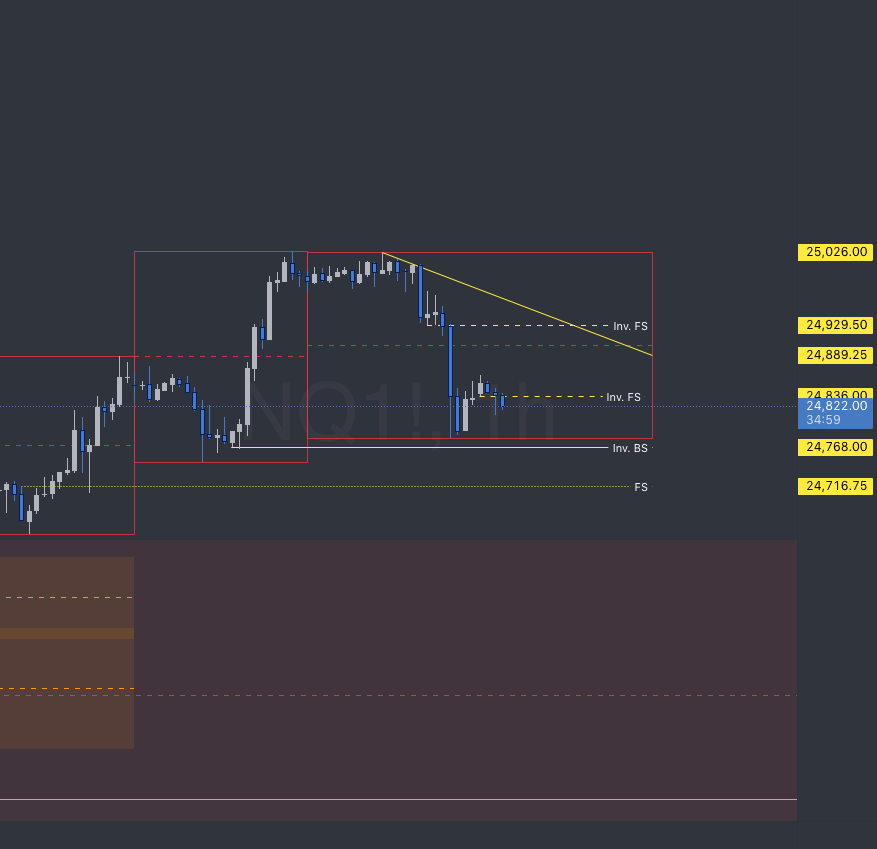
NQ 9/30 - #NQ TradingView tradingview.com/chart/NQ1!/VUz… @Topstep @CoachDBA #FastMarkets
Gold | 9/30 - #GC1! TradingView tradingview.com/chart/GC1!/9TZ… @Topstep #FastMarkets

tradingview.com/chart/YM1!/ZIn… Here you go @CoachDBA How do I trade this haha #fastmarkets @Topstep

ym - 9/24 - #YM1! TradingView tradingview.com/chart/YM1!/KG6… #FastMarkets
NQ 9/24 - #NQ1! TradingView tradingview.com/chart/NQ1!/xu5… #FastMarkets
GC - 9/24 #GC1! TradingView tradingview.com/chart/GC1!/PJK… #fastmarkets #topstep

#BTC 2day replay. 30second replay. Where Bitcorn has been will help us guess where it is going. Support levels are now being built off the daily trend but Resistance lingers. Comparative and procedural analysis are the area's of thinking to see the next t forming.
Replay for XLM Week 38 - #XLMUSD TradingView tradingview.com/chart/XLMUSD/f…


United States 트렌드
- 1. Columbus 136K posts
- 2. President Trump 1.02M posts
- 3. Middle East 230K posts
- 4. #IndigenousPeoplesDay 9,318 posts
- 5. #WWERaw 51.1K posts
- 6. Seth 46K posts
- 7. $BURU 1,040 posts
- 8. Thanksgiving 53.7K posts
- 9. Macron 204K posts
- 10. Marc 46.5K posts
- 11. Darius Smith 3,354 posts
- 12. HAZBINTOOZ 3,564 posts
- 13. Apple TV 4,738 posts
- 14. Mike Shildt 1,947 posts
- 15. Egypt 240K posts
- 16. Flip 53.2K posts
- 17. #drwfirstgoal N/A
- 18. #IDontWantToOverreactBUT 1,316 posts
- 19. Kash Doll N/A
- 20. Bochy N/A
Something went wrong.
Something went wrong.