
おすすめツイート


Looking to buy some Ordinal? Worry no more. This is my top pick project on #Ordinal You don’t wanna miss out on this! ⚫️A propitious project indeed @ogradation 🟠Inscribed on Block 9, the oldest block on Ordinals 🗽Superb Team Work Available on 🔥 magiceden.io/ordinals/marke…
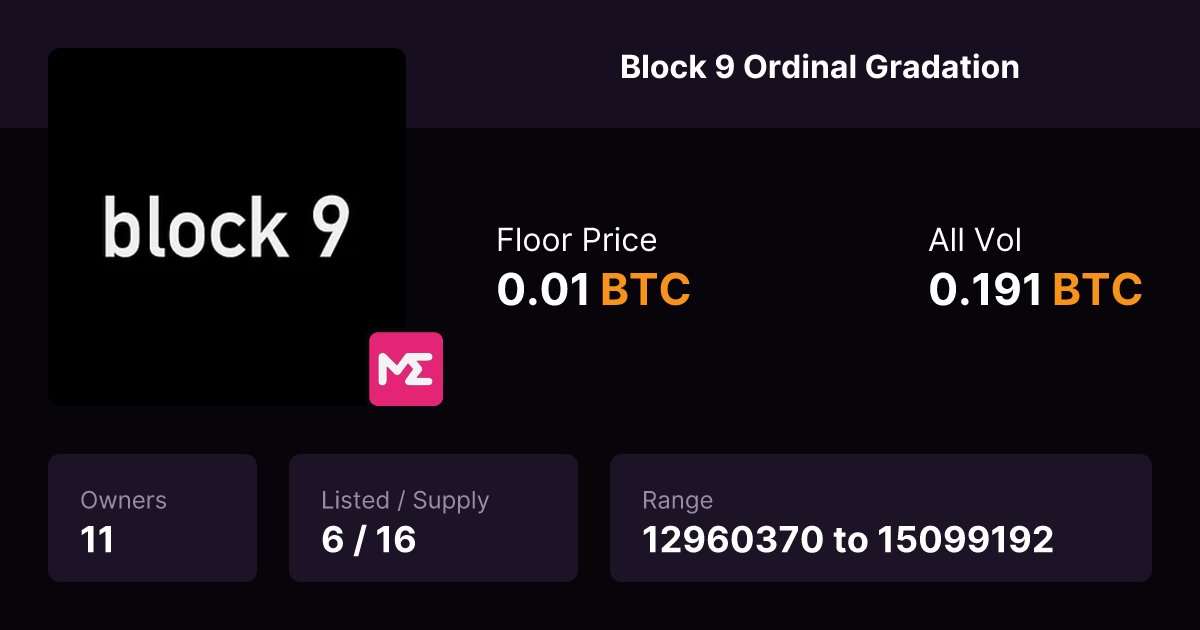
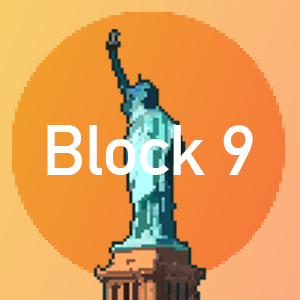
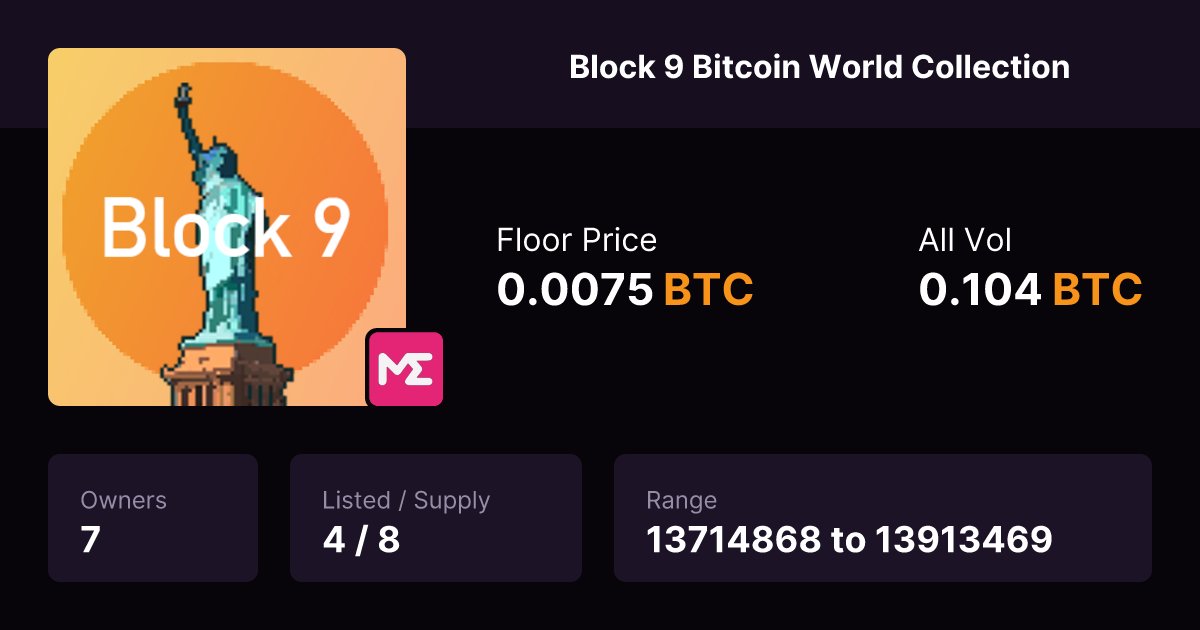
Our entire collection is inscribed on Block9. 【Block9】Ordinal Gradation magiceden.io/ordinals/marke… 【Block9】Bitcoin World Collection magiceden.io/ordinals/marke… What will happen next collection... #Ordinals #MagicEden #block9

We're thrilled to announce a new collaboration with @AbstractNOAH Mint Details Chain: Abstract Mint Price: TBA Supply: TBA Launchpad: Opensea Mint Date: in 2025 Raffle is live in our discord server: discord.gg/Vs9DGnJysX


🔥Late night GIVEAWAY MF🔥 💀want one of my ape sick skulls!? 🔥like this, follow me, click share and… 🔥drop your apechain address in the comments!!


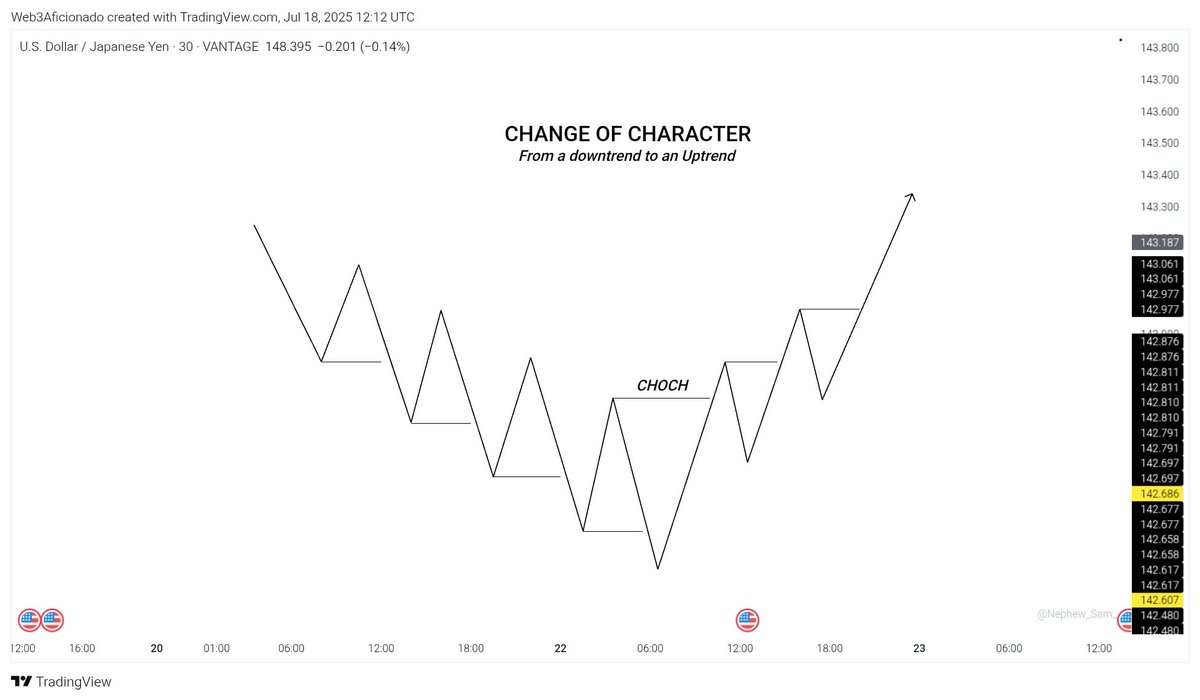
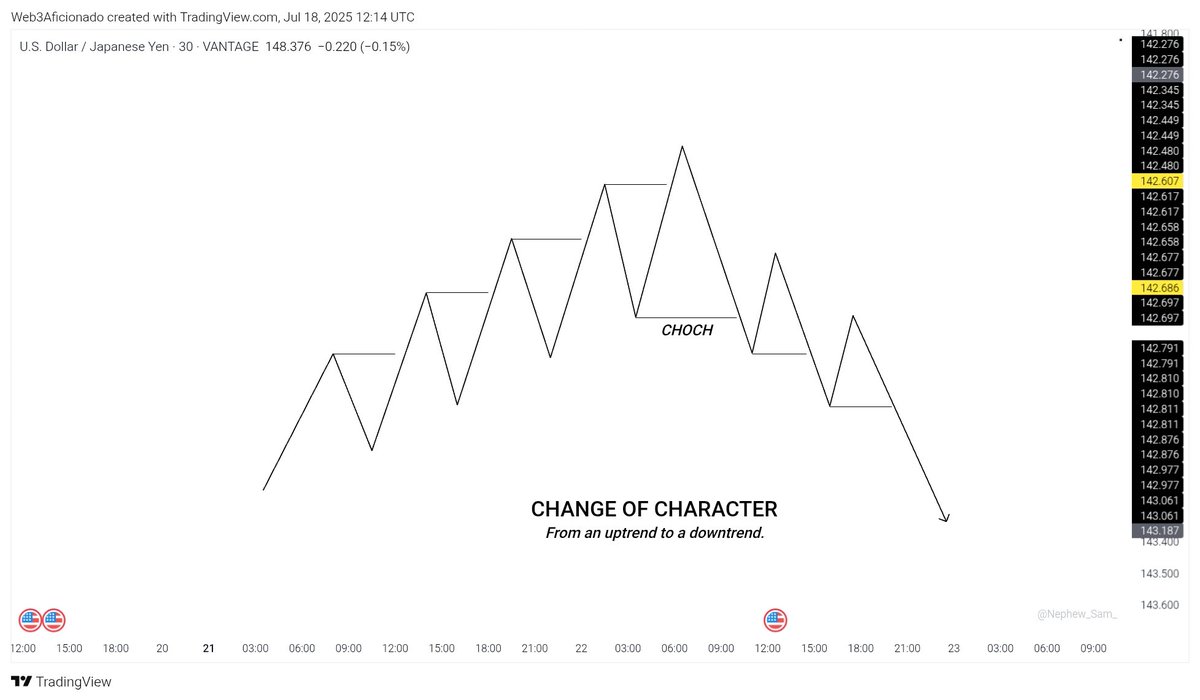
Change of Character (CHoCH) is a reversal break unlike a BOS which is a continuation break. This is the first sign a trend might be reversing. It might be a reversal from a downtrend to an uptrend, or a reversal from a downtrend to an uptrend.
Break of Structure (BOS) This is when price breaks a previous high or low. It signals a possible continuation of the current trend. Example: ▪︎In an uptrend, price breaks the last HH, that's a bullish BOS. ▪︎In a downtrend, price breaks the last LL that's a bearish BOS.


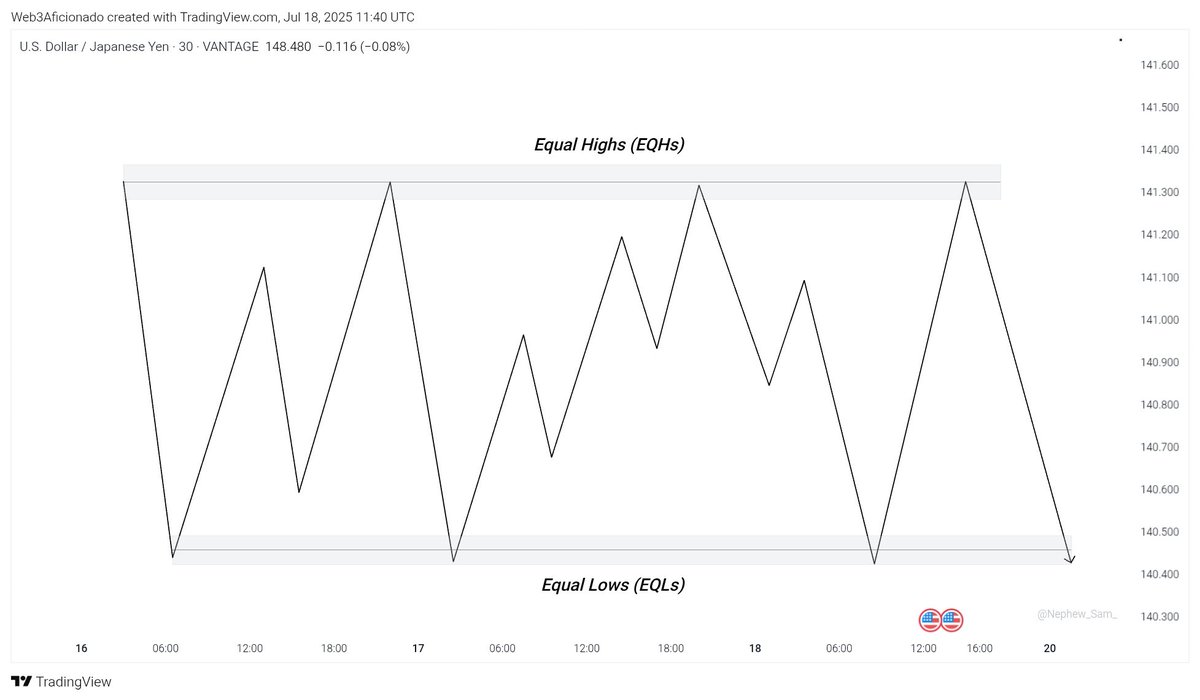
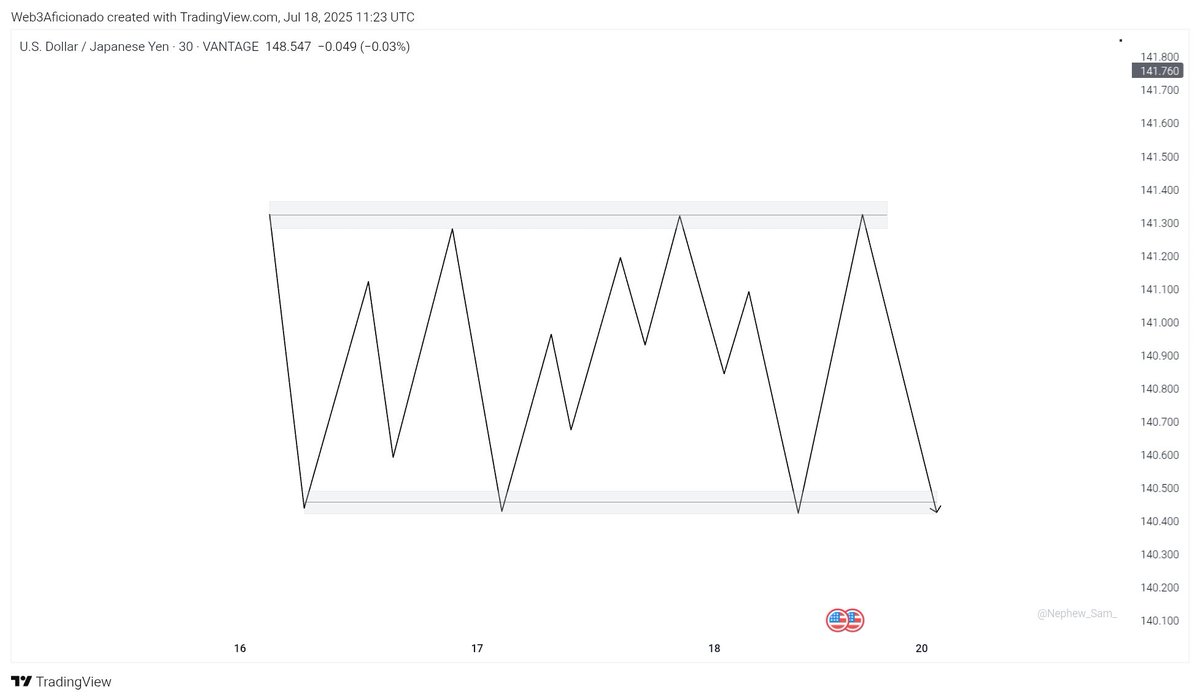
CONSOLIDATION: Some call it a ranging market or sideways. This is when price ranges between two levels creating Equal Highs (EQHs) and Equal Lows (EQLs). It shows that there's no clear direction.
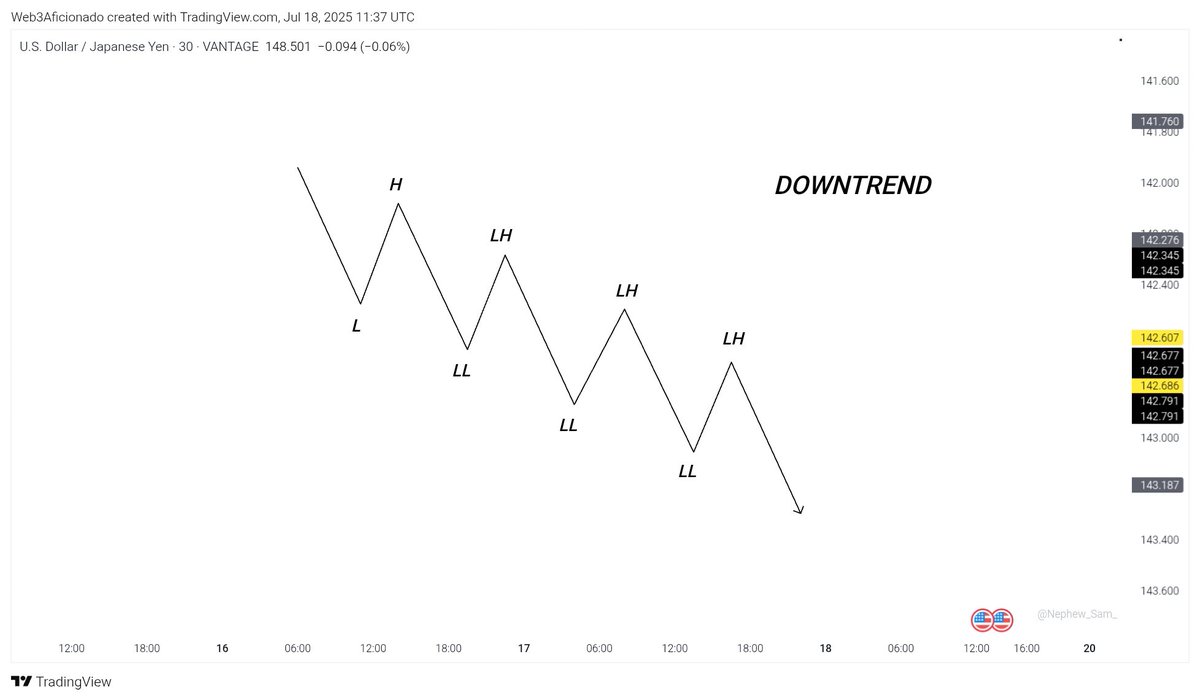
DOWNTREND (Bearish Structure): Price prints series of Lower Lows and Lower Highs. This structure shows that sellers are in control of the market which means price is going down.
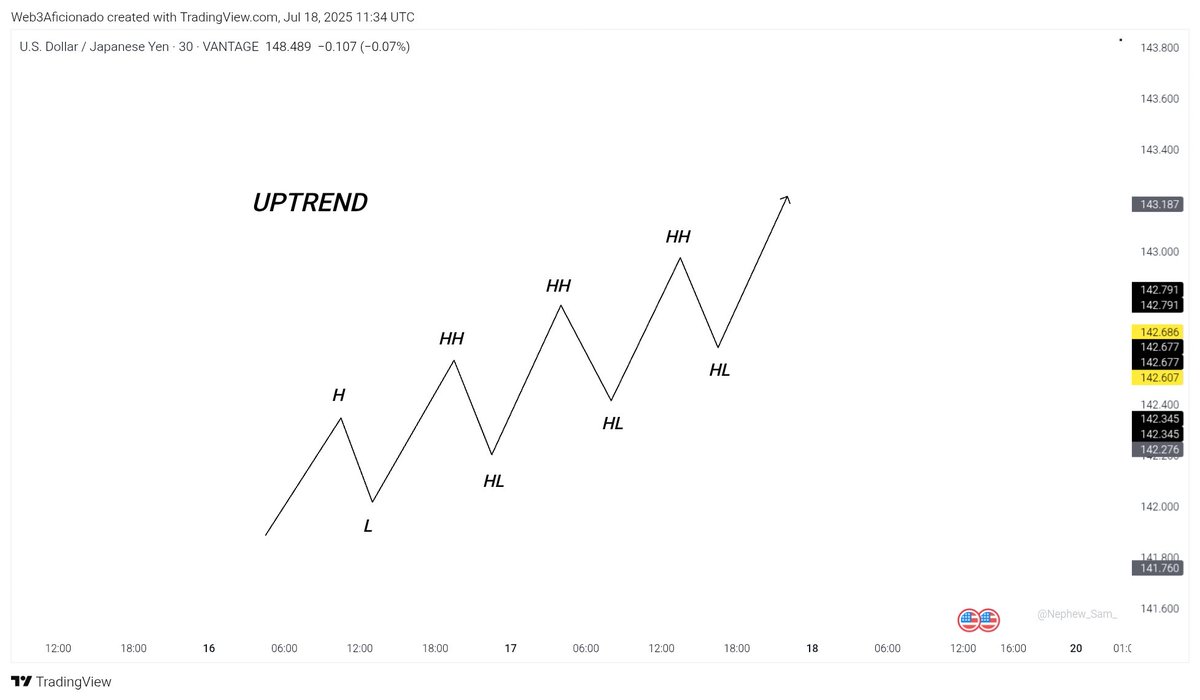
UPTREND (Bullish Structure): Price forms series of Higher Highs (HH) and Higher Lows (HL). In this trend, buyers are in control of the market which means price is going up.
There are three (3) basic movements in the market: ▪︎ Uptrend 📈 ▪︎ Downtrend 📉 ▪︎ Consolidation Your job is to spot which one is happening and trade with it.

Before we dive in, don't forget to give me a follow @Web3Aficionado, like and repost 🔄 this thread for more people to see. You can also join my telegram channel where I drop trade ideas, market insights... t.me/tradewithafici…
MARKET STRUCTURE — The Blueprint of Price Action Market structure is the foundation of technical trading. It tells you where the market is going before any indicator does. Simple breakdown of Market Structure for beginner Traders 🧵
@TW3_Aficionados x @SpongeBro_hl WL Giveaway We’ve locked in Whitelist spots for the SpongeBro mint How to Enter: Follow @TW3aficionados & @SpongeBro_hl Like + RT this post & the pinned post on @SpongeBro_hl Comment your Evm address 12 hours only More spots in Discord

Well...📈


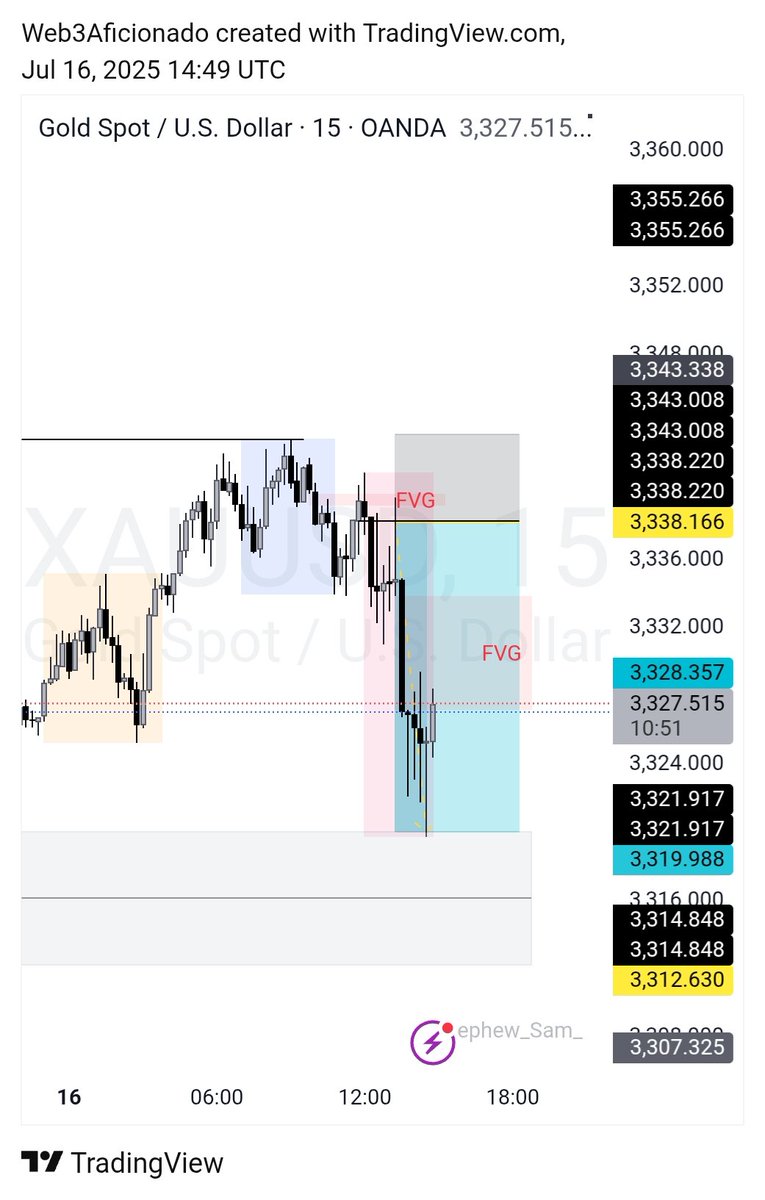
Got late to the party I guess 🙂↔️ $XAUUSD

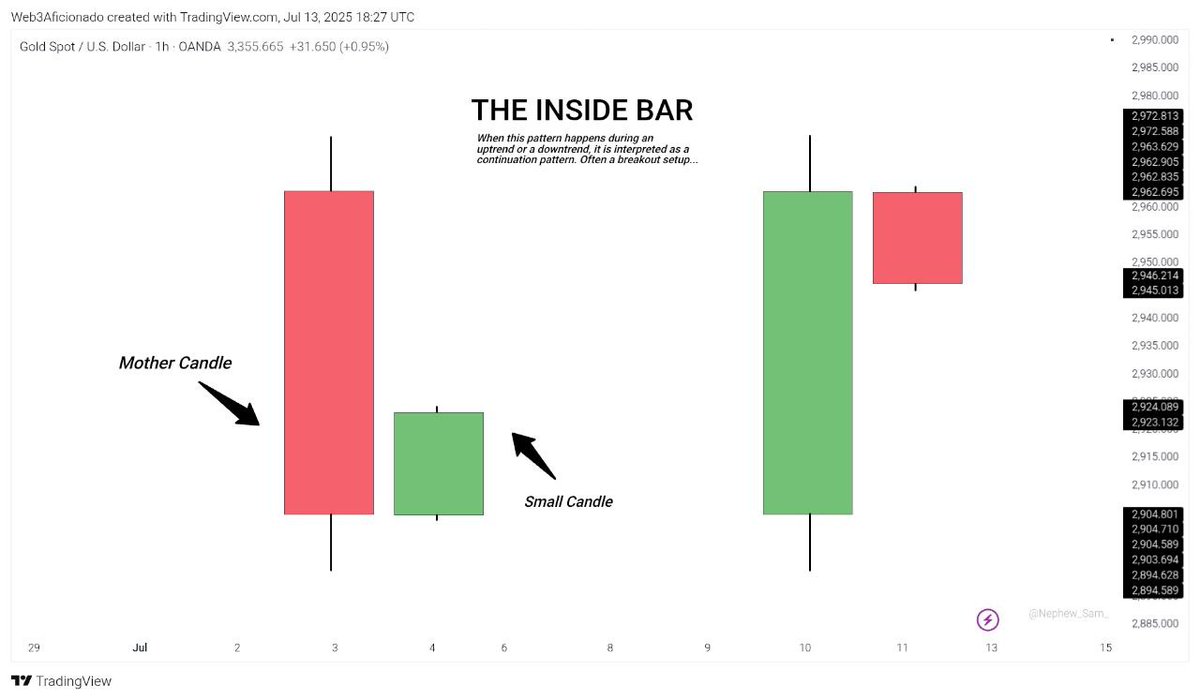
The Inside Bar: A smaller candle that forms completely within the range of the previous one. Psychology behind the formation: Market is in a state of pause or indecision, often after a big move. You can think of it as the market holding its breath.
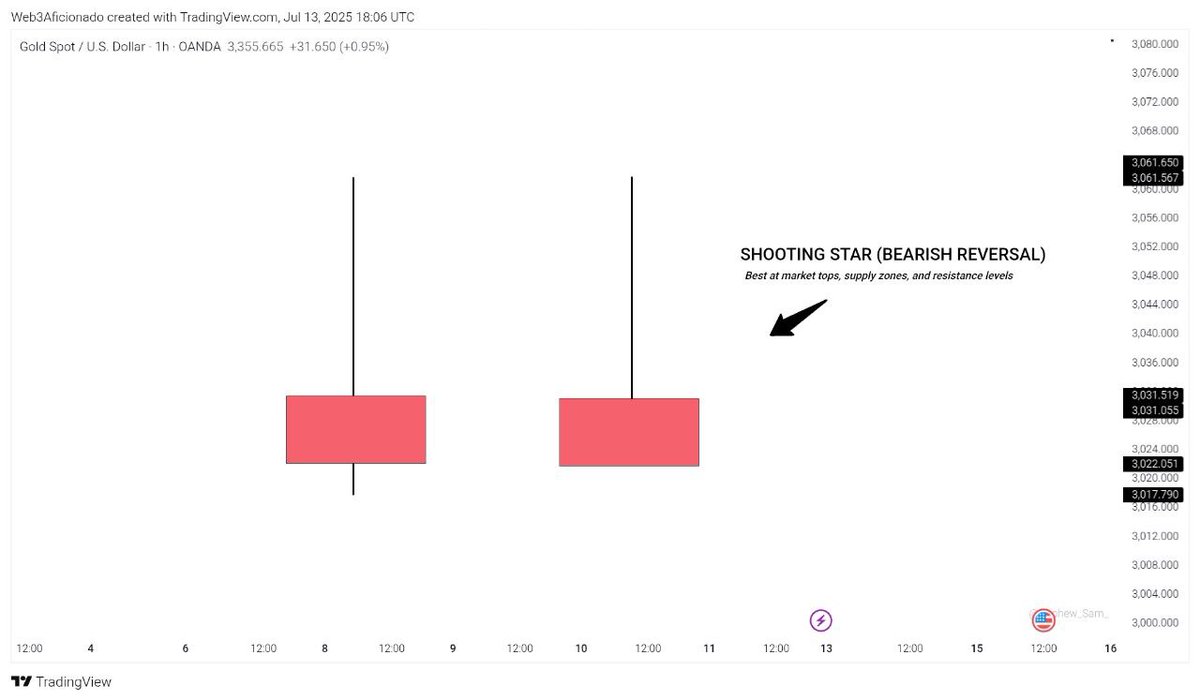
Shooting Star (Bearish Reversal) It has a small body with a long upper wick. Psychology behind the formation: Buyers pushed price up, but sellers rejected it hard and brought it back down. It shows weakness in buying pressure.
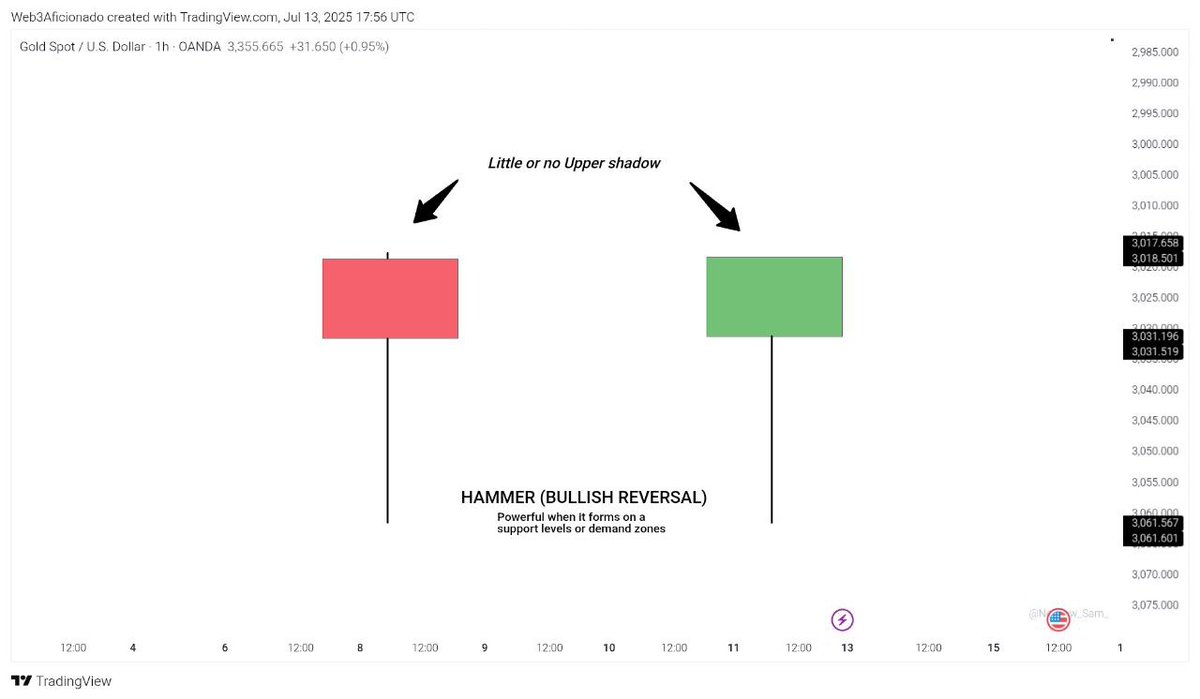
Hammer (Bullish Reversal) This candle usually have a small body with a long lower wick. Psychology behind the formation: Sellers tried to push price down, but buyers fought back and closed price near the top. Rejection of price going lower is what gives a potential bounce.
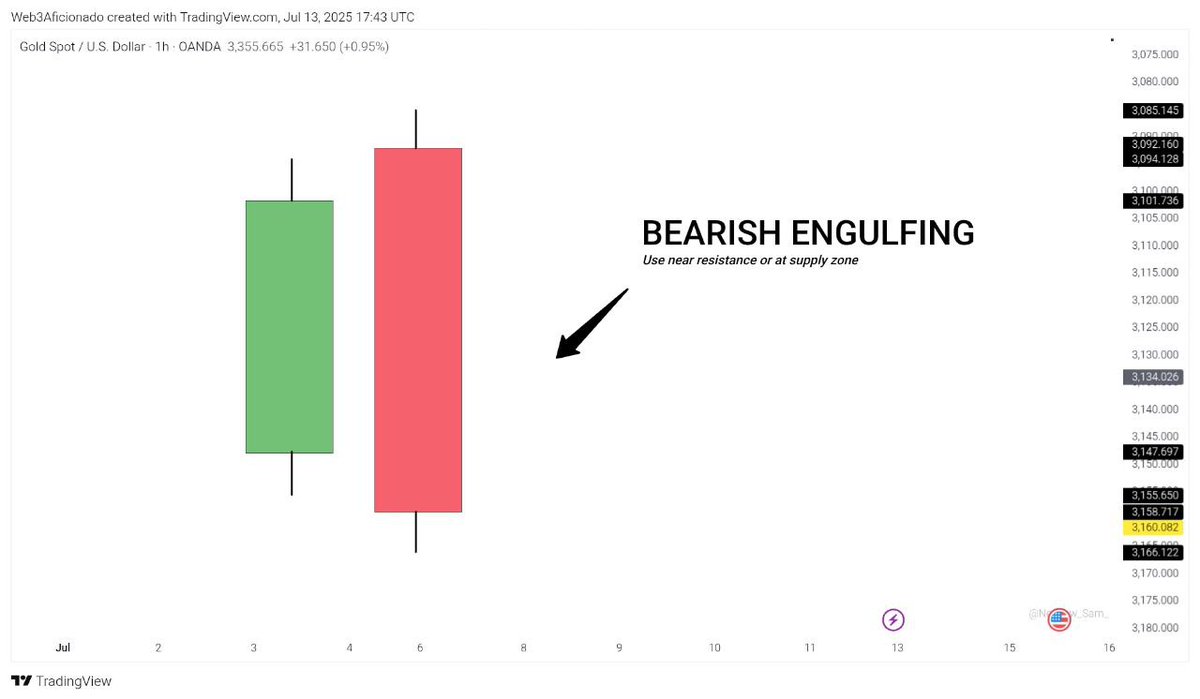
Bearish Engulfing Pattern: It is the vice versa of a bullish engulfing bar. A bullish candle followed by a large bearish one that covers it completely Buyers tried to push price up, but failed. It signals possible reversal Use near resistance or at supply zones.
Bullish Engulfing Pattern: A bearish candle followed by a strong bullish candle that engulfs the first. This pattern shows that sellers were in control, but buyers came in aggressively and took over. A shift in momentum from bearish to bullish.
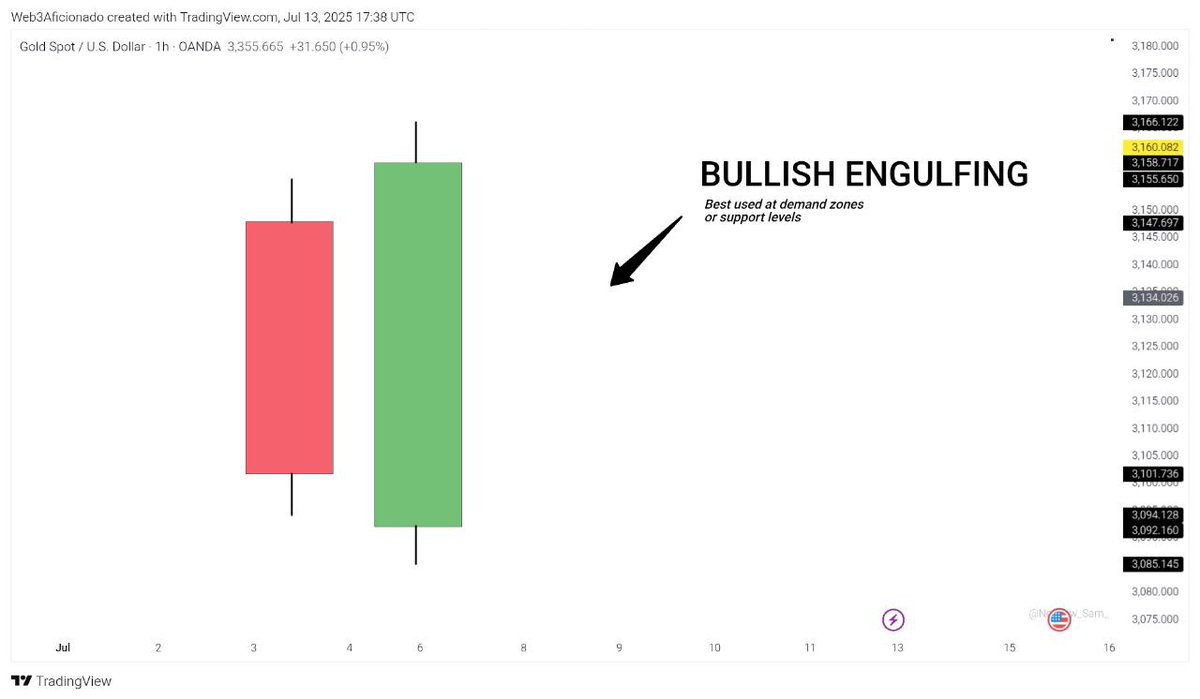
Candlestick Patterns Simplified It’s not just about memorizing shapes. Candlestick patterns show you the psychology behind price — who is in control, who is getting trapped, and where the market might go next. Here’s how to read them properly🧵


United States トレンド
- 1. Knicks 13.4K posts
- 2. Shamet 2,930 posts
- 3. #AEWDynamite 21.8K posts
- 4. #CMAawards 5,549 posts
- 5. Brandon Williams 1,047 posts
- 6. Derik Queen 4,424 posts
- 7. #Survivor49 3,954 posts
- 8. FEMA 68.9K posts
- 9. Vooch 1,162 posts
- 10. Vucevic 6,296 posts
- 11. Labaron Philon 1,129 posts
- 12. NO CAP 14.6K posts
- 13. #AEWCollision 8,772 posts
- 14. #SeeRed N/A
- 15. Coby White 1,142 posts
- 16. Nany 2,015 posts
- 17. Sam Harris 3,293 posts
- 18. Chisa 32.2K posts
- 19. FREE HAT 1,648 posts
- 20. Blazers 4,191 posts
おすすめツイート
-
 𝕬𝖋𝖎𝖈𝖎𝖔𝖓𝖆𝖉𝖔⚡️
@Web3Aficionado -
 Whale Coin Talk
@WhaleCoinTalk -
 Matt Radchenko
@RadchenkoMatt -
 BwcDeals
@BwcDeals -
 Xen Plalism
@PlaIism -
 Büsra.eth
@busraeth -
 Crys10
@nappisaa_ -
 Jonathan Tan
@frontiernaut -
 Cardano Feed ($ADA)
@CardanoFeed -
 Gaurav
@hiGaurav12 -
 Harry||NFT 👑
@harry_nft2 -
 Citizen Conflict
@CitizenConflict -
 Crypto Prince | Web3 & NFT Promoter
@crypto_prince2
Something went wrong.
Something went wrong.