
SDTradingSignals
@TradingSignals8
Supply-demand based trading signals on U.S equity and future markets.
You might like


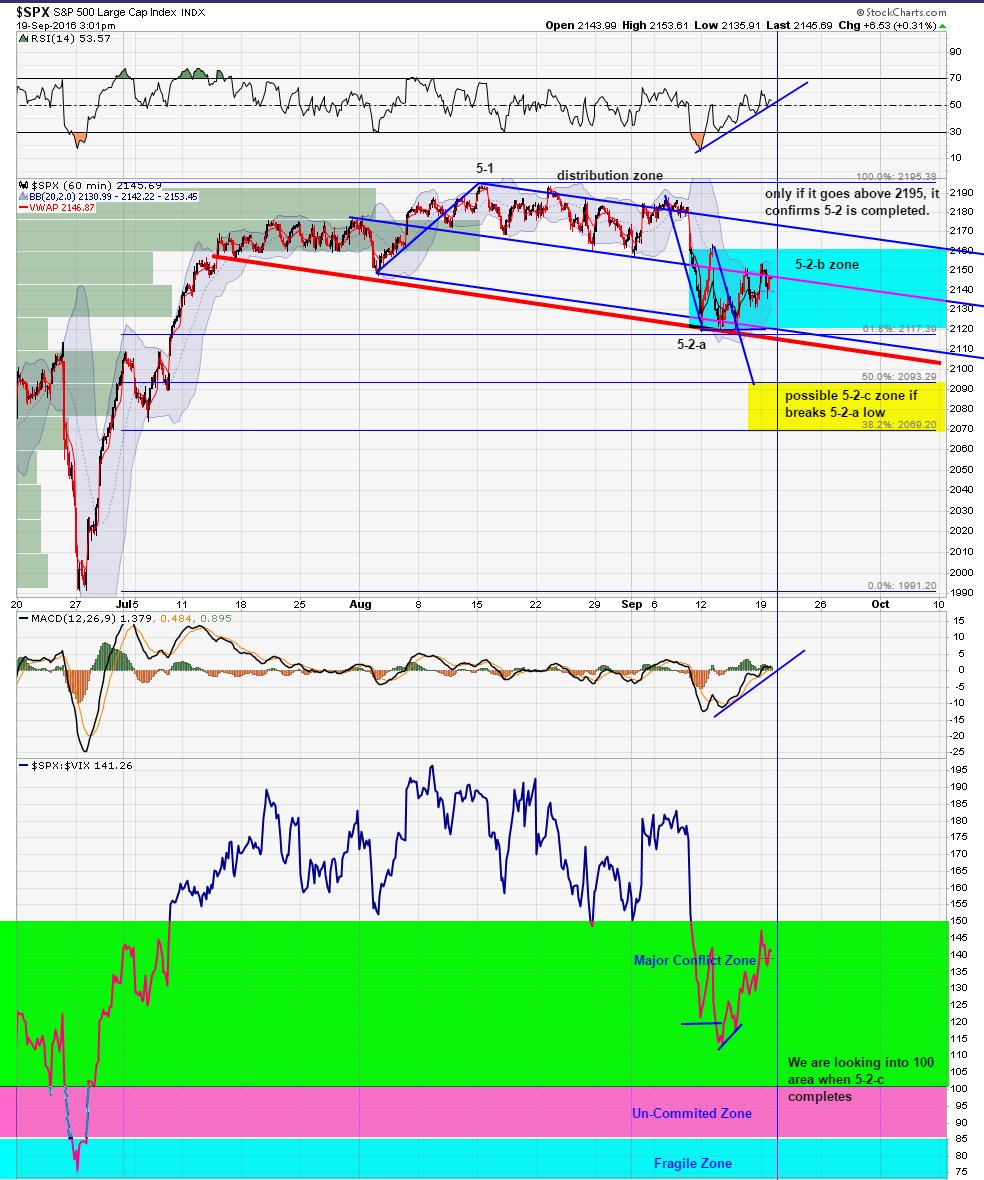
$SPX $VIX Now 50-50 chance for either BREXIT like drop or 2160.
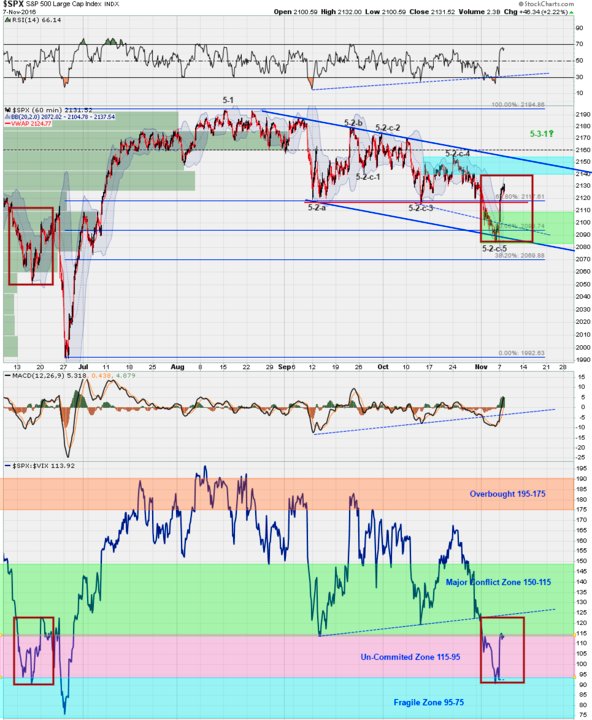
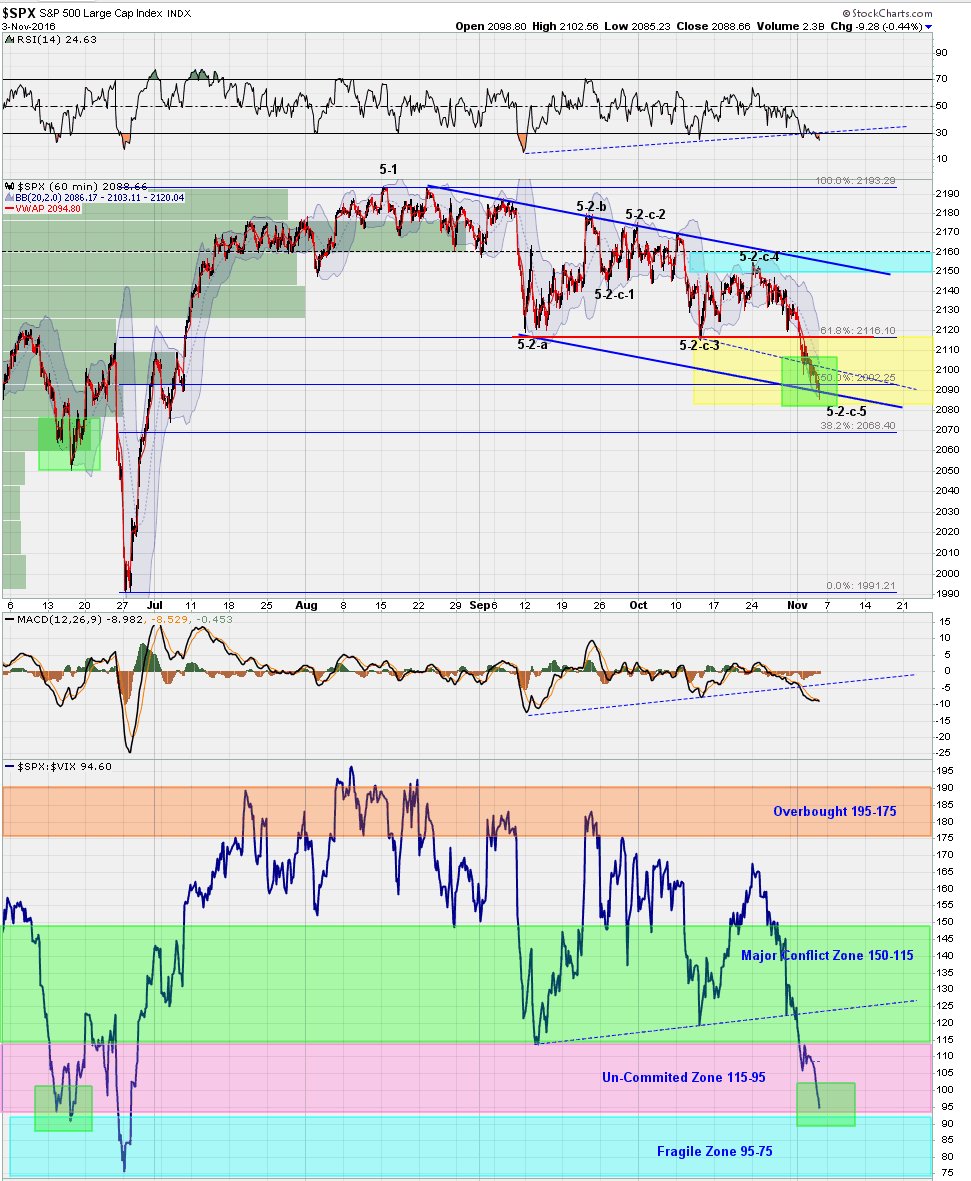
$SPX $SPY $VIX on 5-2-c-5 wave down, time to watch and buy stocks around 2080-2100
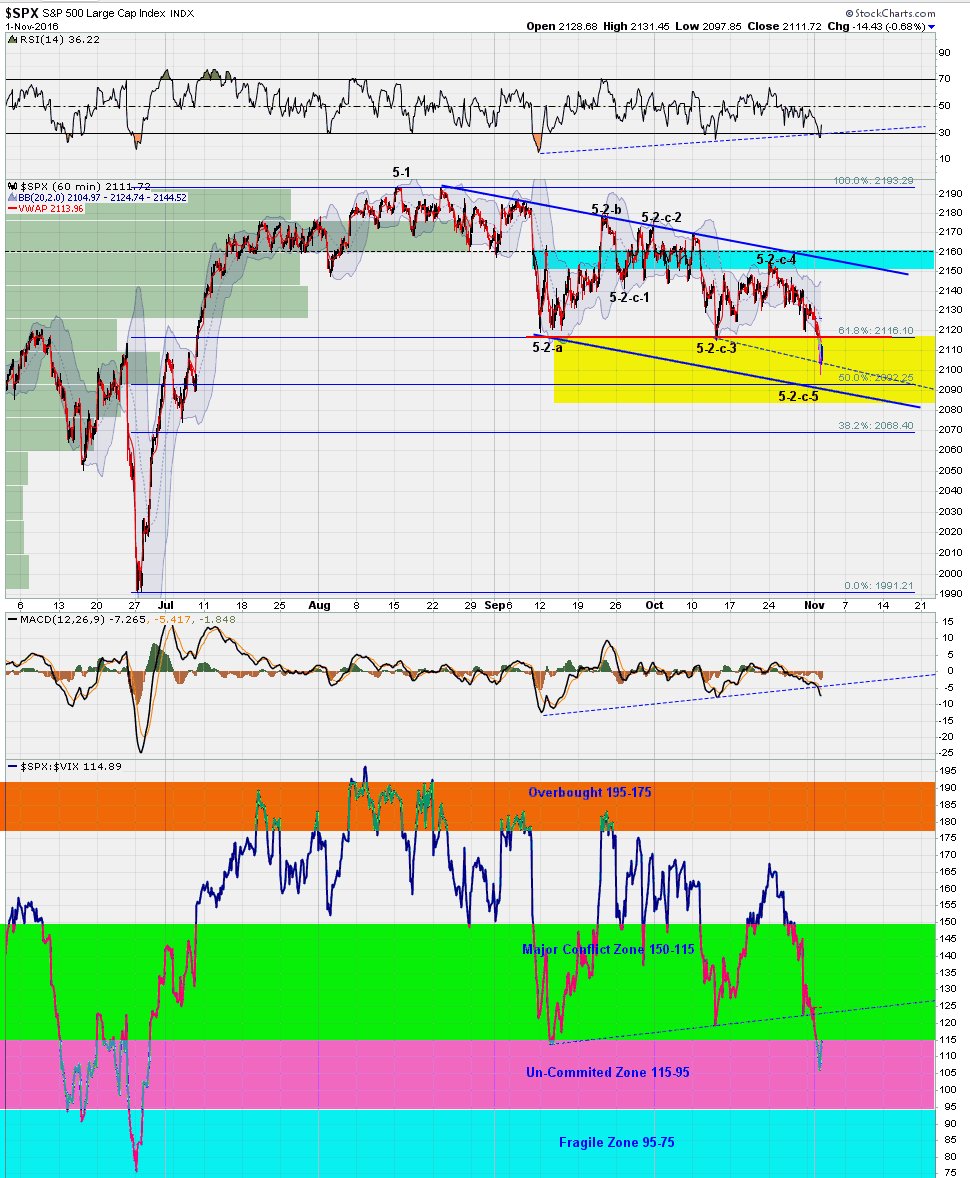
$SPX marked the end of 5-2-c-3 today, from here to wave 4 type of bounce top 2145 (2160max) bounce, should follow by wave 5-2-c-5 down

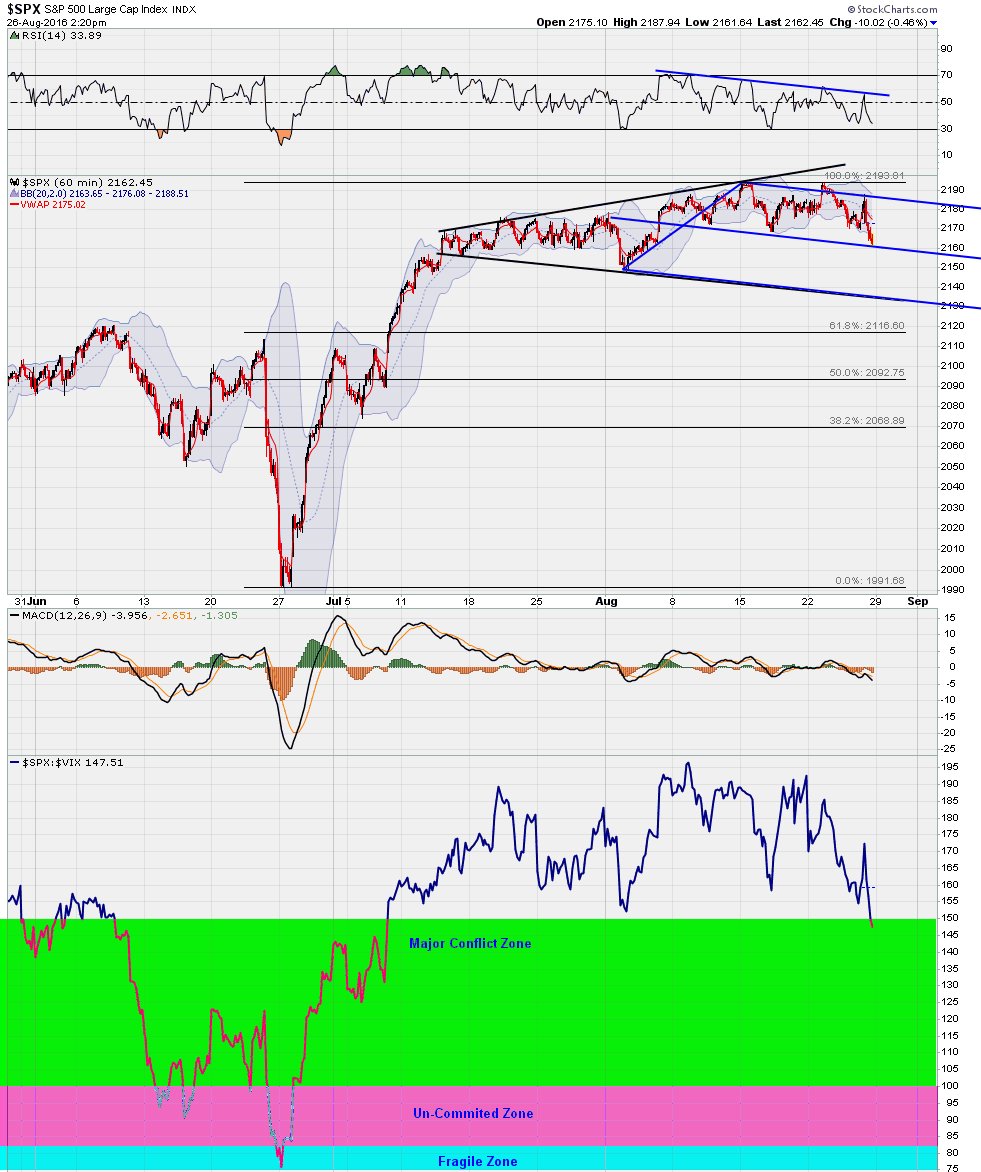
#spx Triangle with 2160 at the center, it will test both trend-lines at least one more time before decide which side to breakout.
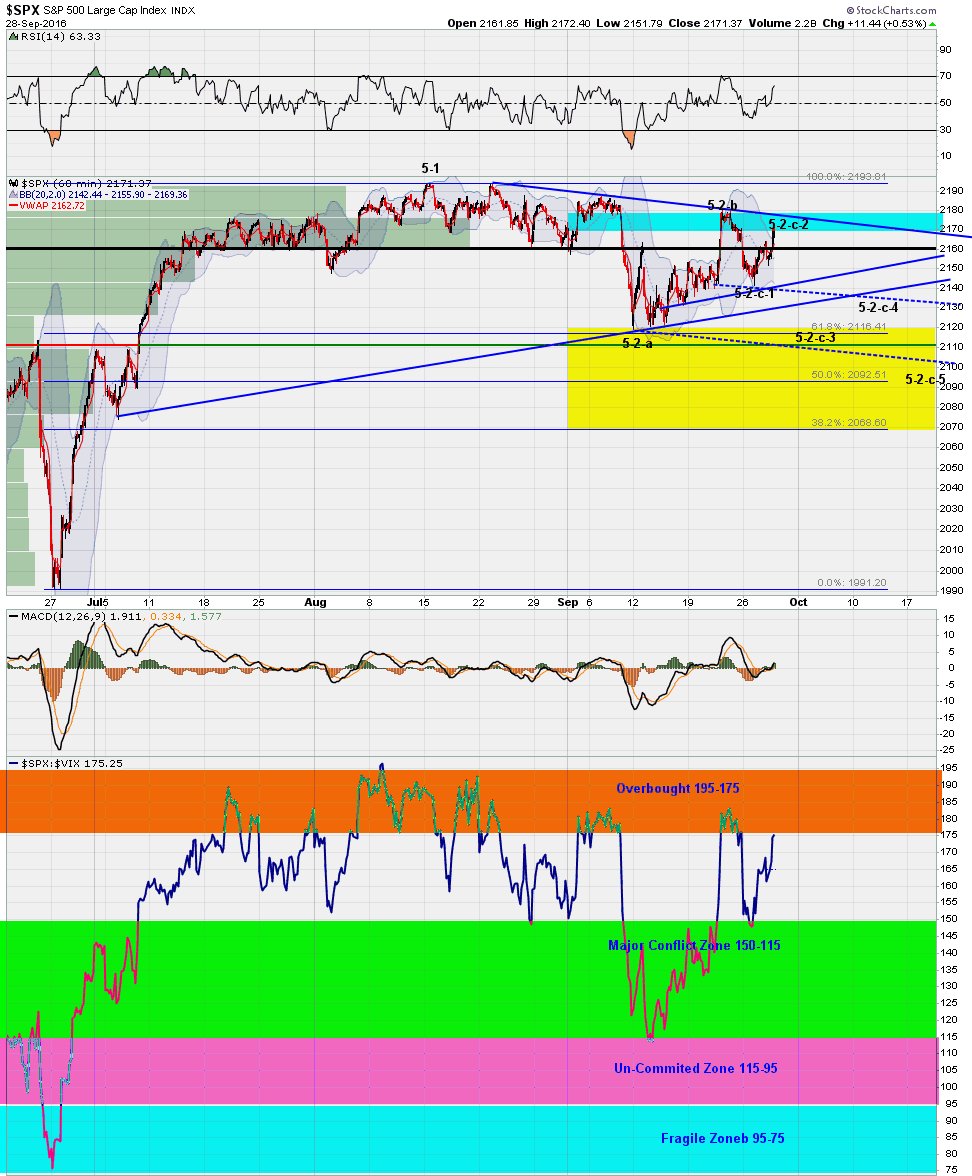
$SPX is on wave 5-2-c that could take entire October to complete.

$spx Chart update, still b wave in progress, waiting for c wave to start
$SPX $VIX oversold bounce is likely set up another downside move towards 9/21 fed rate decision day

Last time #SPX gained >1% after declining by 2% the prior trading session: 1/14/16 FWIW, #SPX crushed fwd 20 days.

NYSE Today: # of Decliners outpaced # of Advancers by 17x, 10th worst breadth day since 1970...


VIX options activity signals a possible volatility spike schaeffersresearch.com/content/analys…

SPX-NYSI weekly chart is telling us a downside move is likely happen in September

Its time to break something, wedge, channel, expanded triangle


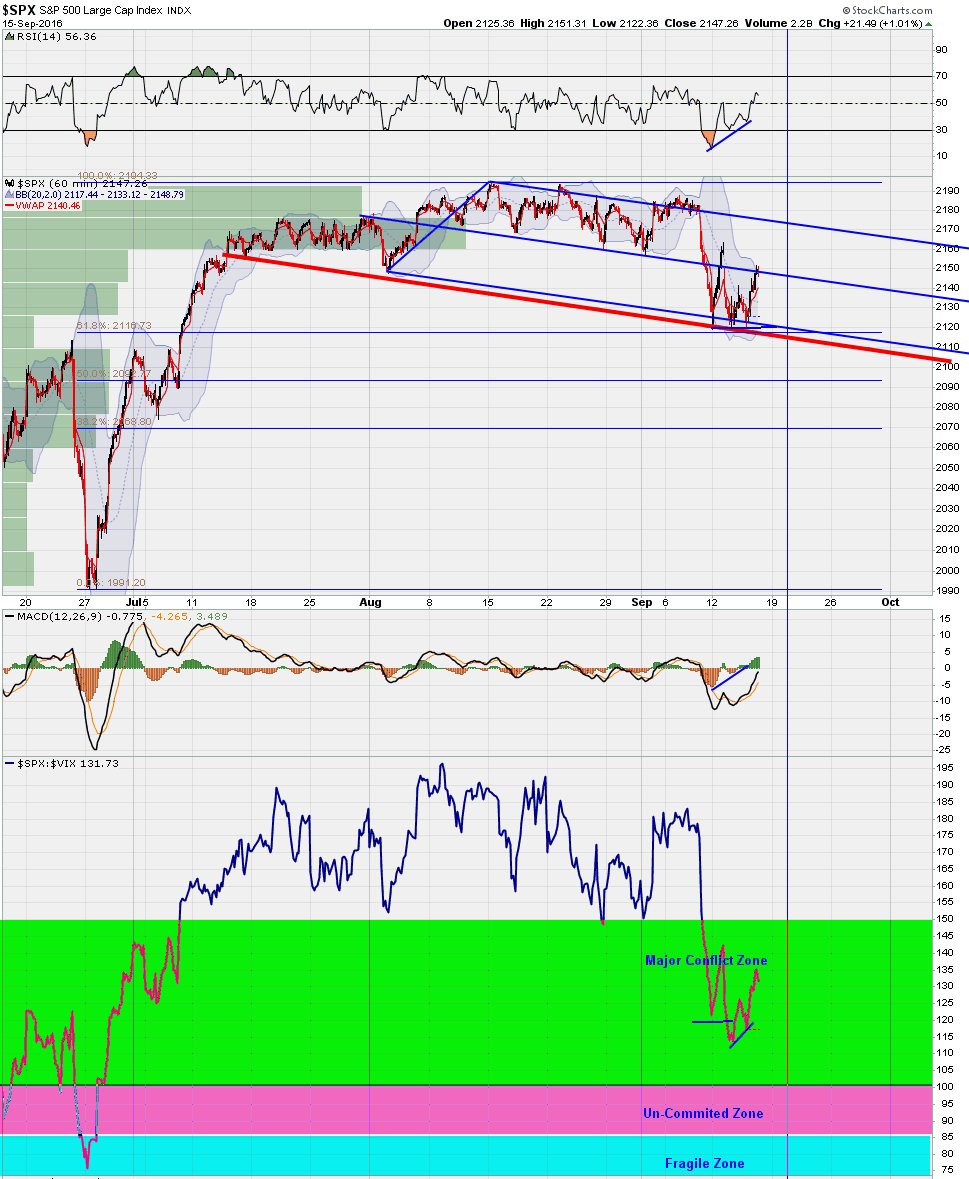
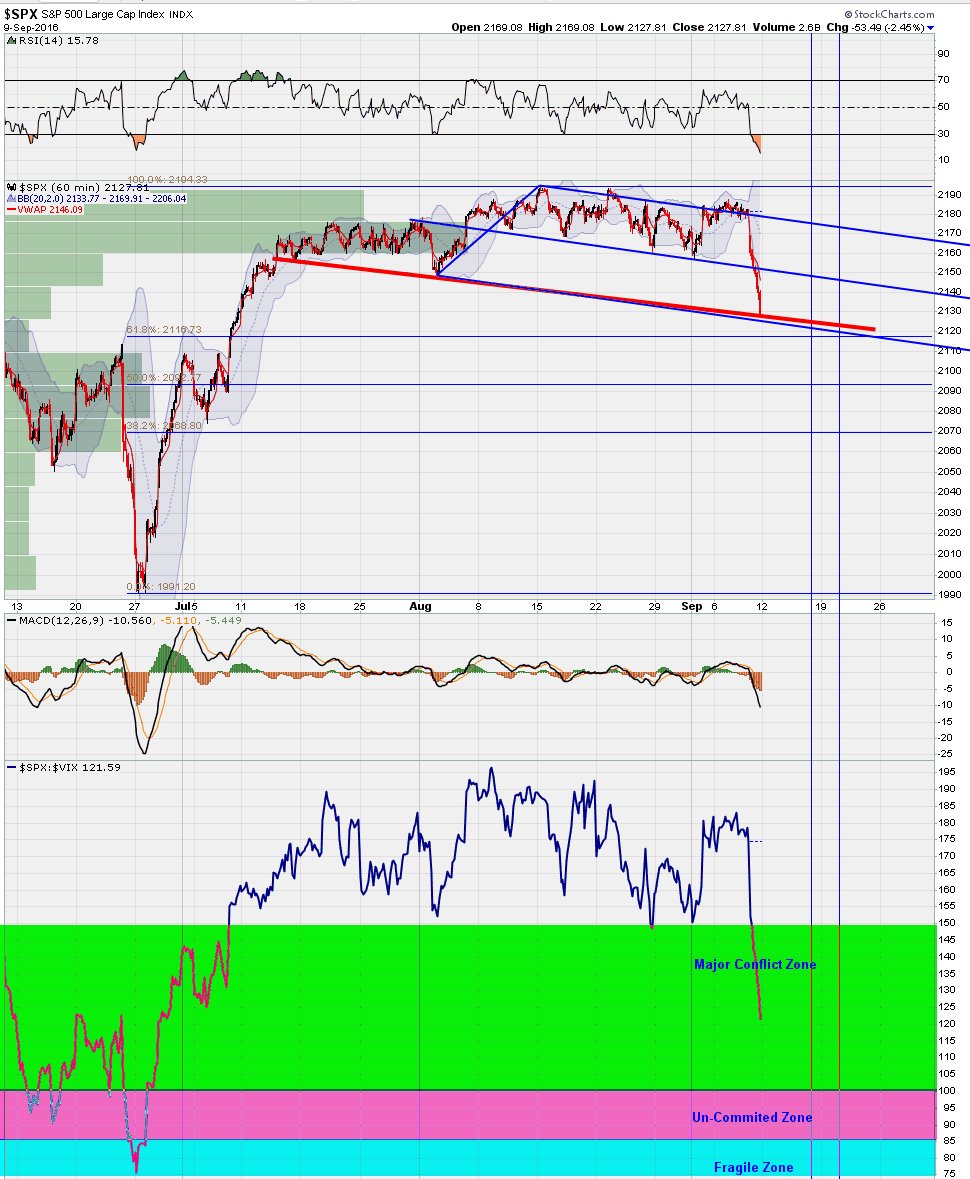
2160 hit and SPX:VIX hit 150 a well, 2160 is a support and buy point, if lost 2160 in close, next target is 2130.
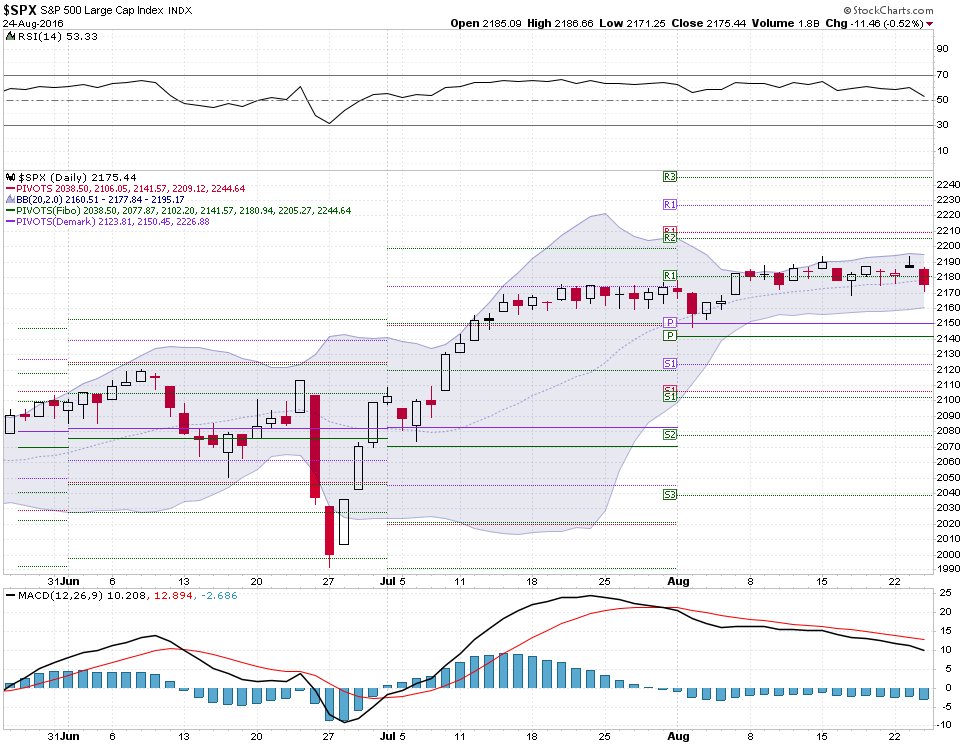
SPX Closed today below daily middle bollinger Band, the lower BB is now at 2160, Aug. pivot point is 2140, 2150.


United States Trends
- 1. Good Sunday 60.8K posts
- 2. Klay 26.2K posts
- 3. McLaren 111K posts
- 4. #sundayvibes 4,875 posts
- 5. #FelizCumpleañosNico 3,840 posts
- 6. Ja Morant 12.2K posts
- 7. Lando 138K posts
- 8. #FelizCumpleañosPresidente 3,468 posts
- 9. For the Lord 29.3K posts
- 10. #AEWFullGear 73.5K posts
- 11. Piastri 81.4K posts
- 12. Tottenham 43.8K posts
- 13. South Asia 38.9K posts
- 14. Oscar 130K posts
- 15. Max Verstappen 69.6K posts
- 16. Arsenal 172K posts
- 17. #LasVegasGP 234K posts
- 18. Childish Gambino 2,973 posts
- 19. Uranus 4,142 posts
- 20. Rubio 99K posts


Something went wrong.
Something went wrong.