


New blog post: Reporting on KPIs tells us where we are right now and how that measures against where we want to be. Stringing a series of KPI reports together in a dashboard can tell a story. Use pie charts, bar charts, gauges, and tables. #reporting #jira bit.ly/3l3hkC1
See how VisualScript can help you visualize critical reports related to Feature Planning. #featureplanning #SAFe #reports #jira #reporting #productroadmap bit.ly/37dlcL1
If you recently installed VisualScript or if you're looking for a new reporting tool, come join us for one of our recurring workshops about using VisualScript. Learn how to make informative Jira dashboards. The next workshop is on August 12th. #jira bit.ly/38CjcNo
VisualScript's standard reports provide a lot of flexibility for software development teams to report on metrics when they need questions answered quickly. Visualize your metrics easily and make better data-driven decisions. #dev #agile #jira bit.ly/39Ujm3d
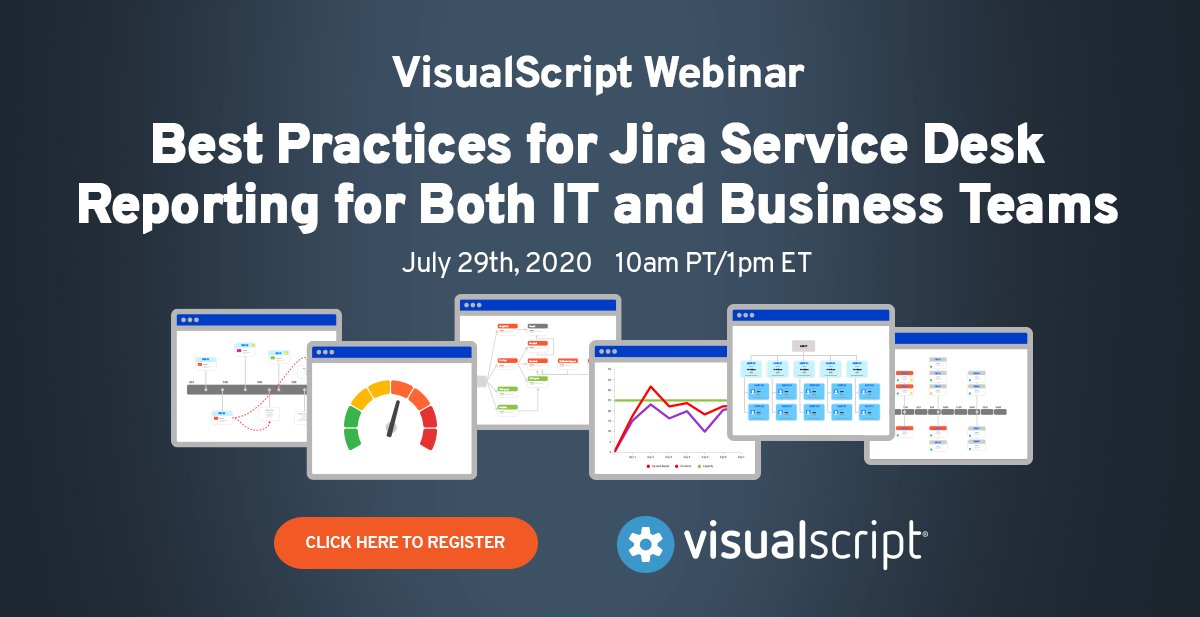
Join us for our next webinar about reporting best practices for Jira Service Desk. You'll learn how to provide much needed context to help stakeholders make well-informed decisions. Register for July 29th 10am PT. Hope to see you there. #jira #reporting bit.ly/3f8e7P7
Want to get the most out of your VisualScript investment? This week we're starting a recurring webinar series for getting started with VisualScript. Sign up for this week's session: July 15th, 10 AM PT. Come with questions big and small. #reporting #jira bit.ly/38CjcNo

A Time in Status Report shows your service desk performance in context of your actual workflow. This report shows the average length of time a ticket spends in each status and shows the path of ticket status changes. youtu.be/K_jxIPTjvSA

youtube.com
YouTube
Time in Status Report for Your Jira Dashboard
Want to get the most out of your VisualScript investment? This month, we're starting a recurring series for getting started with VisualScript. First date is set for July 15th, 10 AM PT. Come with questions big and small. #reporting #jira bit.ly/38CjcNo

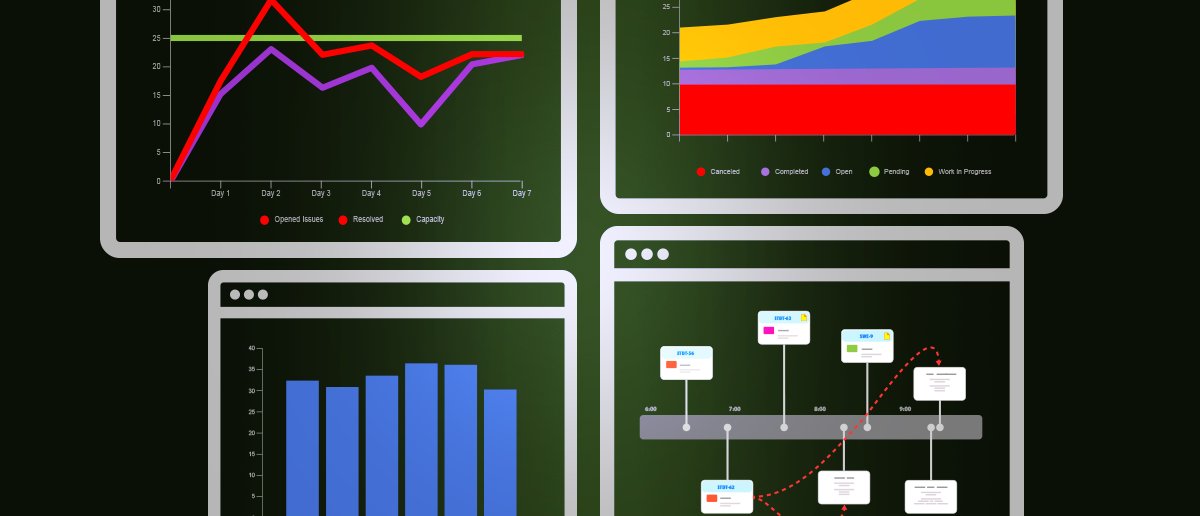
How do you measure the performance of your service management team? We have four critical reports you should know about. We will cover capacity flow, problem timelines, stacked area charts , and bar charts. #itsm #reporting #jira #jiraservicedesk bit.ly/3gzaQso
Join us to learn reporting best practices for Jira Service Desk. You'll learn how to provide much needed context to help stakeholders make well-informed decisions about process changes, staffing, infrastructure, and more. #jira #reporting bit.ly/3f8e7P7

The latest update adds 7 new standard reports for the Atlassian Stack. These standard reports make it easy to create a custom dashboard with a wide variety of information to help your team present KPIs to stakeholders and make good data-driven decisions. bit.ly/2VxQqYU
Check out this upcoming Temecula/West Palm Beach ACE on July 22nd. Evan is going to demo how business teams can use JSD for their service management and create reports using VisualScript. #jiraservicedesk #jsd #jira #reporting bit.ly/2Z2mYLi

4 reports that are critical for IT Service Management: seeing the right metrics in the right context will help your team come up with a plan to address any issues or problems based on data, not just hunches. See what they are. #itsm #reporting #JSD #jira bit.ly/3fujSGG

VisualScript lets you quickly see your SLA KPIs across projects and teams. For example, you can see what percentage of SLAs are met vs breached. The gauges can easily be tailored to what data you want to see, even across multiple projects. #ITSM #reports youtu.be/df51OsjeCrE

youtube.com
YouTube
Health Gauges for ITSM - VisualScript Reporting for Jira Service Desk
New webinar next week to cover best practices for reporting for business teams using JSD and VisualScript. And we're still mailing a free t-shirt to every attendee! Hope you can join us. June 24th, 10 am Pacific Time. #jira #jiraservicedesk #ESM bit.ly/3cYr0Jz

Create a dashboard for your Jira Service Desk that helps you tell a story with data in context. This video shows how the Open vs Resolved Pie Chart and Capacity Flow Report can work together to help your team & stakeholders see what's happening #ITSM youtu.be/I9JkbHeCNyA

youtube.com
YouTube
A Quick View by Evan Golden: Open vs Resolved Pie Chart and Capacity...
New webinar alert! Are you using JSD for business teams like HR and Facilities? Interested in exploring it as an option? If this is you, our next webinar will go over best practices for reporting for business teams using JSD. Sign up today! #jira #jsd bit.ly/3cYr0Jz

Check out our white paper on #ITSM reporting. Traditional metrics only provide part of the story, they provide the what, but not the why. Effective data-driven decision making requires in-context reports that answer why. #reporting #JSD bit.ly/2zjy5H6

See how VisualScript can help you visualize critical reports related to Feature Planning. #featureplanning #SAFe #reports #jira #reporting #productroadmap bit.ly/37dlcL1
Check out the new built-in standard reports in VisualScript. You can generate a chart or graph using any field and within any project (Jira Core, Jira Software, and Jira Service Desk). They are super flexible and powerful. bit.ly/37ktnWc #jira #reporting #charts


United States 趨勢
- 1. George Santos 12.9K posts
- 2. Prince Andrew 41.9K posts
- 3. No Kings 302K posts
- 4. #askdave N/A
- 5. Duke of York 17.8K posts
- 6. Louisville 5,394 posts
- 7. #BostonBlue 1,115 posts
- 8. Gio Ruggiero N/A
- 9. Norm Benning N/A
- 10. Zelensky 86.9K posts
- 11. Teto 19.6K posts
- 12. Rajah N/A
- 13. Arc Raiders 7,941 posts
- 14. #DoritosF1 N/A
- 15. Andrea Bocelli 25.4K posts
- 16. Max Verstappen 12.3K posts
- 17. #iwcselfieday N/A
- 18. #SELFIESFOROLIVIA N/A
- 19. Chandler Smith N/A
- 20. Shabbat Shalom 14.7K posts


Something went wrong.
Something went wrong.