WellDatabase
@welldatabase
WellDatabase changes the way you see oil and gas data. Get the mapping, analytics, and data management you need to get ahead, at a price you can handle.
You might like


Is your workflow designed to zero in on a specific target while also exploring the surrounding area? You can achieve this by using a polygon tool for manual selection, importing API lists, or leveraging shapefiles. hubs.la/Q02_k2g30

Our step-by-step guide shows you how to cut through the noise and build visualizations that actually tell a story. Check out our latest blog and see what you can create. hubs.la/Q02_8G9z0

We have some new map features to share with you. Read/watch this tutorial to learn how to highlight wells using data layers for analyzing well performance and creating type curves across different regions. bit.ly/41teQFF

Do you need a tool to make informed oil and gas decisions around EUR patterns, comparing well performance or identifying production hotspots? See how the advanced mapping with our Plus and Pro accounts can give you the flexibility and insight you need! bit.ly/4ijHcIv

Did you know WellDatabase uses an 8-step allocation process to calculate quarterly/annual production data into monthly volumes? Learn more: //support.welldatabase.com/knowledge/allocation-process-for-production-reported-annually-or-quarterly #OilAndGas #ProductionAllocation

Who has time for anything extra these days, it seems? So here we are to help you make quicker decisions by customizing your maps to instantly pick out complex relationships with a glance of the eye. ttps://blog.welldatabase.com/blog/customizing-your-map-color-by-properties

Whether you're tracking well statuses, comparing production levels, or analyzing operator positions, maintain consistency in your visualizations without the extra setup. Learn all about it here and be sure to watch the video on YouTube! bit.ly/3ZA0Fgw

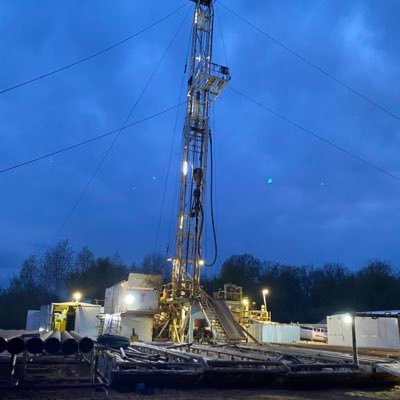
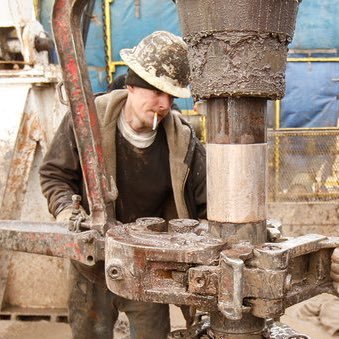
While you're diving into that delicious turkey and pie, be thankful for our awesome rig crews keeping the wheels turning! Learn how to access a rig report by navigating to: hubs.la/Q02ZC1yj0 #rigs #oilandgas #rigreport

Did you know that lists are more than just boring tables? There are many options which enable you to dive deep into your data and easily find related information. Learn more: bit.ly/3YHti9U #oilandgas #energydata #datamanagement

Did you know that WellDatabase has published definitions for every data field available in our platform? These definitions are designed to provide a clear understanding of the exportable data points. Download your copy here: bit.ly/3CaPSQX #oilandgas #datamanagement

Anyone can combine disparate data sets. With technology and modern tools, mapping is done for you, providing unique insights for everyone—from mom-and-pop shops to majors. Watch the full discussion here on Collide bit.ly/3AwsE78 How AI empowers small businesses.
Did you know when production is reported at the lease level, WellDatabase has a detailed process to allocate this production to the well? Learn more in the following article: bit.ly/48wSR25 #productionallocation #allocation #oilandgas

In the world of data, it's better to REST API than to RIP (Rest in Peace)! Did you know that our Pro and Enterprise level subscriptions provide access to data through our REST API? hubs.la/Q02VJqzJ0 #restapi #oilandgasdata

Cleaning data is a time suck. Get the cleanest, most up-to-date data without wasting time. hubs.ly/Q02Vlrjr0

Did you know you can completely customize the colors of your map's well spots? Dive into this article to learn how to tweak the colors for well spots. hubs.la/Q02VxzJj0 #oilandgas #mappingtools #datamanagement

Have you ever wondered why some fields in WellDatabase display both "aliased" and "reported" values? You're not alone; this is a common question we receive. Learn more in the following article: : bit.ly/3UcJr5U #oilandgas #datamanagement #normalizeddata #dataintegrity

Looking forward to what's instore at the SPEE 2024 Software Symposium! It's already off to a great start. #software #data #oilandgas #AI

A CEO, CRO, and CTO walk into a bar. The CEO says "I'll have a beer." The CRO says "I'll have an H2O." The CTO says "I'll have an H2O too." The CTO died. Join us as we co-sponsor the Happy Hour with our friends from Velocity Insight and Pod2. bit.ly/3Ykblzt

Heat maps are very useful when trying to identify broad trends on large data sets. Switch layers between well spots and heat maps to see the highest producing areas on your map or create a data layer to maintain your well spots in relation to the heat map.bit.ly/3ZXmIP5

Did you know we offer various ways for you to get in touch with us? There is no right or wrong way, just choose the one that is the most convenient for you! If you have questions, we are here to help. #oilandgasdata #datamanagement #energyindustry


United States Trends
- 1. #Worlds2025 48.3K posts
- 2. Doran 19K posts
- 3. #T1WIN 29.6K posts
- 4. Good Sunday 47.9K posts
- 5. Faker 34.1K posts
- 6. #T1fighting 3,558 posts
- 7. Sam Houston 1,622 posts
- 8. Oregon State 4,643 posts
- 9. Option 2 4,382 posts
- 10. Vergil 8,807 posts
- 11. Boots 29.5K posts
- 12. #Toonami 2,730 posts
- 13. Keria 11.4K posts
- 14. Hyan 1,512 posts
- 15. Louisville 14.3K posts
- 16. UCLA 7,777 posts
- 17. #FlyTogether 2,133 posts
- 18. Nikki Glaser 1,045 posts
- 19. OutKast 22.4K posts
- 20. PETE DAVIDSON N/A


Something went wrong.
Something went wrong.