
YinYang Algorithms
@YinYangAlgo
Provider of Technical Indicators and Bots 📈 20+ Custom Indicators and Bots 🔥🤖 Join our Community ⤵️ Discord: http://discord.gg/ccEHem37FB
Our All-Inclusive suite of Indicators and Strategies will help you trade by identifying key locations of Support and Resistance, Volume Profiles, Momentum, RSI and more! 📈 - Automate your trades 24/7 with our Bots 🔥🤖 - Get access here ⤵️ YinYangAlgorithms.com #Bitcoin #BTC

Technical Analysis: #EURUSD potential Double Bottom. EURUSD is looking quite bearish in the short term with strong bullish potential if the double bottom occurs. #forextrading

#SPX500 has been undergoing some bullish momentum over the last few days. This may lead to a potential push to the $5350 region over the next few days. Further movement will take time to tell; but overall it’s currently looking good. #trading

#GOLD - Bearish Correction Incoming! A small pump may occur over the next few days; however we don't think this is long term. We believe Gold may get rejected ~$2474 and continue in a downtrend towards the ~$2190 region. #XAUUSD

#BTC Potential new ATH by the end of this month. A Bullish movement could result in a new ATH by the end of this month for #Bitcoin. A new ATH by the end of this month would put the price of BTC back on track with its trajectory to reach 198k by end of June 2025.

Our SFX Signals & Overlays Indicator has been released! Real-time Buy & Sell Signals that are ranked for their strength! Identify Trend Momentum and Support and Resistance locations. Works on all #stocks, #cryptocurrencies and Indices! Get a 7 Day Free Trial today!

💯 The parabolic movement #Bitcoin must exhibit to reach its projected $198k by June 29th, 2025 (ATH of this Bull Run) will catch many people by surprise 🚀🌕 #BTC


Parabolic Movement is coming much quicker than most people realize. If #BTC is to reach its projected ATH Price of this Bull Market by its projected Date it needs to move at the Slope defined by this Green Trend Line. #Bitcoin

Our #BTC #Halving [YinYangAlgorithms] Indicator has just been released! This Indicator predicts WHEN the Halving, High and Low will occur and at what PRICE! It will also help you identify if it is Overbought or Oversold and where Support and Resistance is. tradingview.com/script/8XkevvY…
![YinYangAlgo's tweet image. Our #BTC #Halving [YinYangAlgorithms] Indicator has just been released! This Indicator predicts WHEN the Halving, High and Low will occur and at what PRICE! It will also help you identify if it is Overbought or Oversold and where Support and Resistance is.
tradingview.com/script/8XkevvY…](https://pbs.twimg.com/media/GB0VhPxXEAAK_No.jpg)
![YinYangAlgo's tweet image. Our #BTC #Halving [YinYangAlgorithms] Indicator has just been released! This Indicator predicts WHEN the Halving, High and Low will occur and at what PRICE! It will also help you identify if it is Overbought or Oversold and where Support and Resistance is.
tradingview.com/script/8XkevvY…](https://pbs.twimg.com/media/GB0V81MWgAAbkcY.jpg)
Want to Learn how to Trade? Automate your Trades 24/7 with our Bots? Improve and Speed Up your Technical Analysis? Simply Comment or DM us your TradingView Username and you'll be added to our Premium TradingView Indicators and Strategies for a 7 Day Free Trial! #BTC📷 #Bitcoin📷

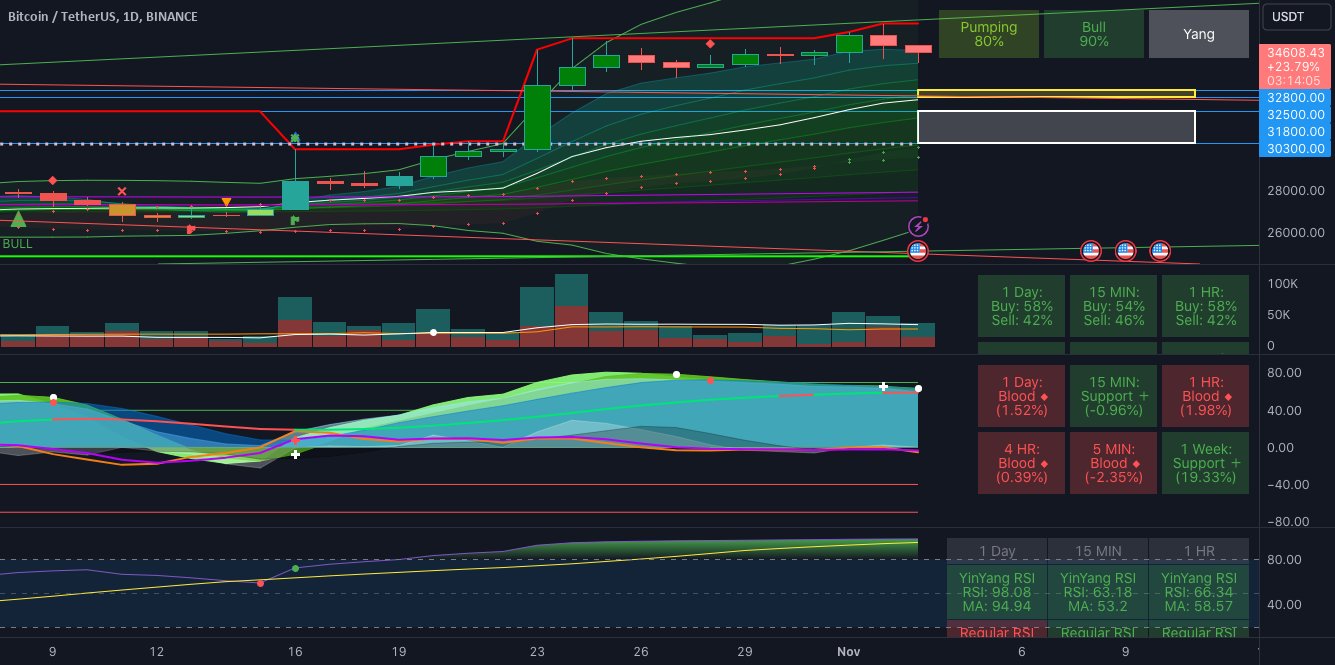
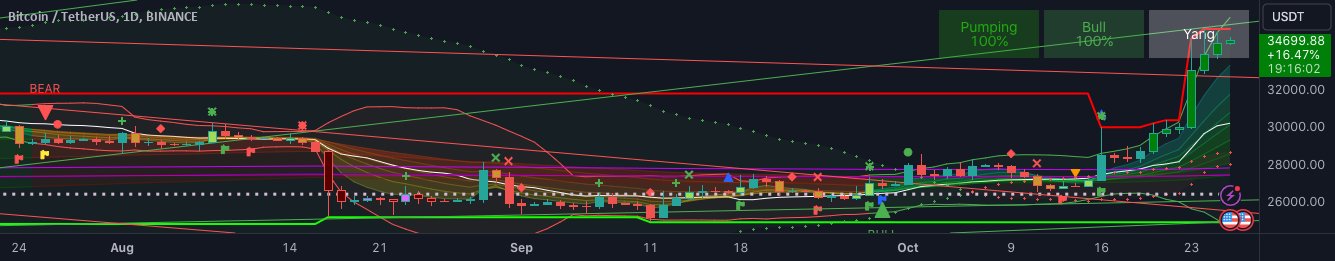
If #BTC closes below 34.7k in the next few hours there is Potential for a short term SHORT. Short Zone 1: 32.5k - 32.8k Short Zone 2: 30.3k - 31.8k Check out our prediction to see more as to why #Bitcoin may move to these zones. tradingview.com/chart/BTCUSDT/…
Our Machine Learning: Optimal RSI Indicator was just featured by YouTuber Soheil PKO, check it out to see how you can better your #trading strategy and take advantage of a better, more accurate RSI. #BTC youtube.com/watch?v=R1Yg1g…
Our newest Premium Indicator, YinYang Trend has just been released! Now you can easily identify your Entry and Exit locations, as well as, multiple different levels of Support and Resistance within all #stocks and #crypto. tradingview.com/script/4qhtjCF…
#BTC is finally experiencing some of the effects of the Halving. We've been projecting Late October to Early November for this to happen and its now here. We should be seeing 40-44k by ~Mid February 2024. A small correction to 35-40k in March, and ~50k #Bitcoin by June/July 2024.
#BTC is pumping. However, don't FOMO and start a leveraged or short term Long swing trade now. #Bitcoin is VERY Overbought right now and likely will correct to 30-32k in the following 1-4 days. If you haven't bought yet for a Long Term Hold then yes, now is still a good time.
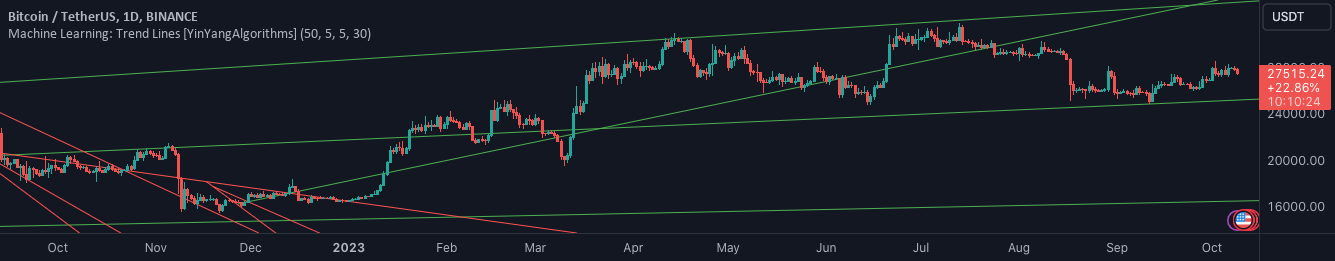
Trend lines have always been a key indicator that help predict many different types of price movements, especially vertically. Therefore we've decided to apply a Machine Learning Model to Traditional Trend Line Calculations. Trade like a pro! #Bitcoin #BTC tradingview.com/script/U3CHwiX…
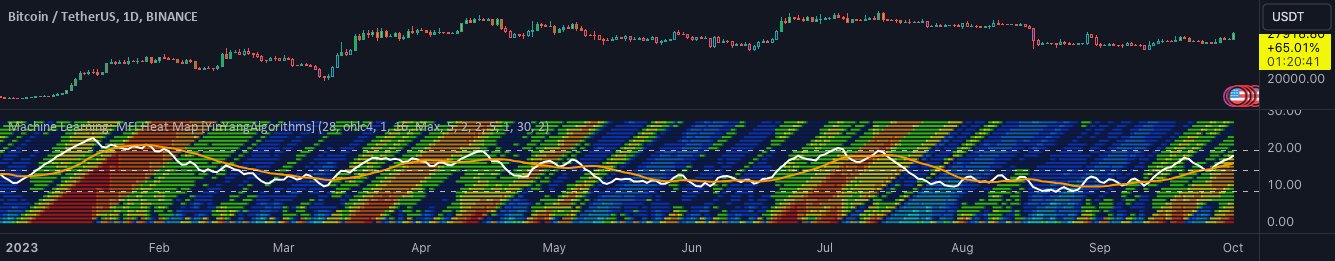
When trading #stocks, #bitcoin or other forms of equities, it's always important to get the most important data and in a way you can understand. We've just released our newest Indicator that will help you do just that! Machine Learning: MFI Heat Maps! tradingview.com/script/h3bdHkH…
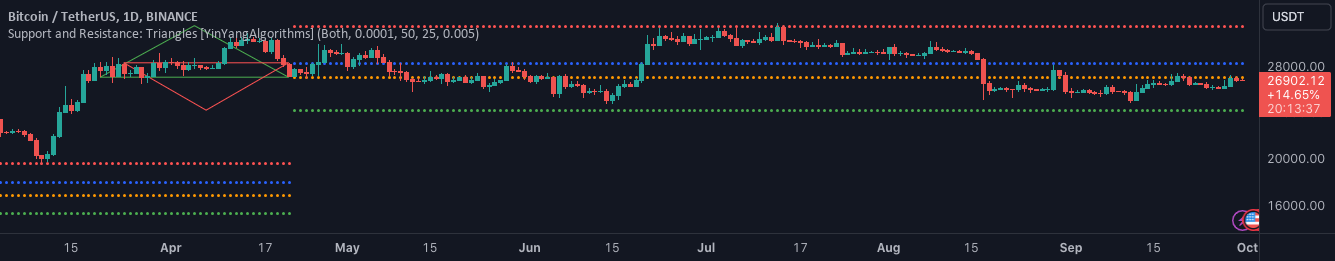
Triangles have always been known as the strongest shape. Its ratios are found in nature just like Fibonacci. Well, guess what?! It works in #trading too! Locate Support and Resistance locations based on Triangles and trade #Bitcoin and stocks like a pro! tradingview.com/script/RkeTwjo…
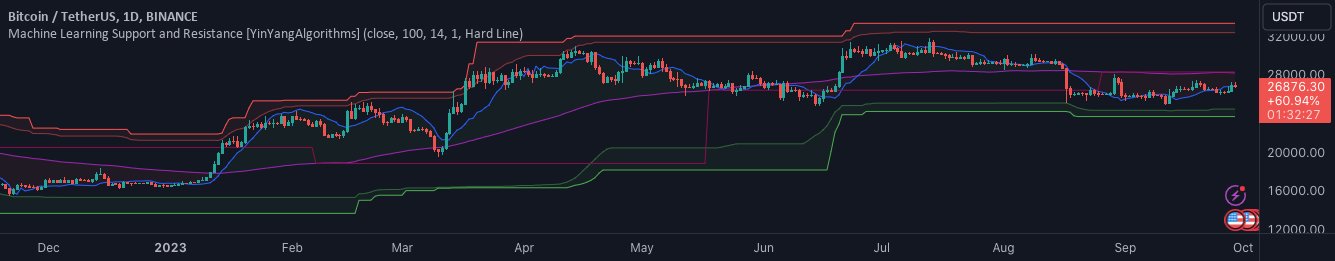
In a time where AI is crucial, why not use it in trading #Bitcoin? Check out our newest Indicator; Machine Learning: Support and Resistance. It projects where the Support and Resistance will be without relying on it hitting it already. #BTC tradingview.com/script/hurudMo…


United States Tendências
- 1. Merry Christmas 428K posts
- 2. Pro Bowl 30.8K posts
- 3. Ben Sasse 3,275 posts
- 4. Happy Holidays 117K posts
- 5. Ryan O’Hearn N/A
- 6. Steve Rogers 22K posts
- 7. Happy Festivus 4,672 posts
- 8. Lookman 11.3K posts
- 9. Semenyo 69.8K posts
- 10. Louisville 4,975 posts
- 11. #Fliffmas 2,844 posts
- 12. Captain America 7,280 posts
- 13. Iwobi 7,822 posts
- 14. Neymar 21.3K posts
- 15. #AvengersDoomsday 168K posts
- 16. Kam Williams N/A
- 17. Endgame 124K posts
- 18. Because Chicago N/A
- 19. Russell Brand 12.8K posts
- 20. Toledo 7,072 posts
Something went wrong.
Something went wrong.