
Angular UI
@_angular_ui
Master UI development with Angular and build professional applications. Created by @shhdharmen

Form Layout 6 = clean workspace creation flow, built with #Angular Material + Tailwind. Multi-section layout, plan selector, and responsive grid — all ready to plug into real apps. 👉 ui.angular-material.dev/blocks/applica…

An #Angular Material table that actually understands enterprise workflows. The Dashboard Template includes full filtering, sorting, status chips, search, and responsive columns — all ready to plug into real apps. Explore the template → ui.angular-material.dev/templates#dash…
Filterbar 3 uses #Angular CDK Overlay to render filters' descriptions with images in portal-based panels — no layout shifts, no scroll jumps. Clean UI + powerful UX. Live demo → ui.angular-material.dev/blocks/applica…
A polished account settings experience — built with #Angular Material + Tailwind. The Account Management 1 block includes profile fields, inputs, validation, layout, and responsive design. Try it → ui.angular-material.dev/blocks/applica…

Filters. Search. Status chips. Date ranges. The Dashboard Template, built using #Angular Material & #TailwindCSS gives you a table built for real SaaS dashboards — not just demos. For more details → ui.angular-material.dev/templates#dash…
An #Angular Material table that actually understands enterprise workflows. The Dashboard Template includes full filtering, sorting, status chips, search, and responsive columns — all ready to plug into real apps. Explore the template → ui.angular-material.dev/templates#dash…
Struggling with #Angular Material theming? Our newest chapter “Understanding Overrides Mixins” goes deep into: 🎯 Finding the correct tokens 🎯 Safe CSS overrides 🎯 Real-world card & tab redesign Live now on angular-ui.com/courses/angula… Take a quick look 👇
Upgrade your personal licence to teams licence this Black Friday Sale Step 1: Convince your boss ui.angular-material.dev/convince Step 2: Upgrade (use the same email as personal licence) ui.angular-material.dev/checkout/pri_0… Step 3: Party with your team 🎉

⏳ Final Hours! Black Friday Sale on #Angular Material Blocks ends TONIGHT. Save 30% on 300+ UI blocks + 2 premium templates. Don’t miss out! 👉 ui.angular-material.dev/#pricing
You've seen the blocks. You've bookmarked the templates. Now’s the last chance to get everything for 30% OFF — ending tonight at 11:59 PM UTC. 👉 ui.angular-material.dev/#pricing

⏳ Final Hours! Black Friday Sale on #Angular Material Blocks ends TONIGHT. Save 30% on 300+ UI blocks + 2 premium templates. Don’t miss out! 👉 ui.angular-material.dev/#pricing
Black Friday deal on Angular UI ends in a few hours. Get 30% OFF and level up your #Angular skills. 👉 angular-ui.com/buy-now/
⏳ Last few hours! Save 30% on all Angular UI courses at angular-ui.com. Build modern interfaces the right way — with step-by-step guidance. Ends TONIGHT → angular-ui.com/buy-now/
I've noticed a growing number of articles, videos, and courses dedicated to @angular signal forms. I'm truly impressed by how the community is staying engaged with the latest developments in the #Angular ecosystem. That said, I'd like to gently remind everyone that signal forms…

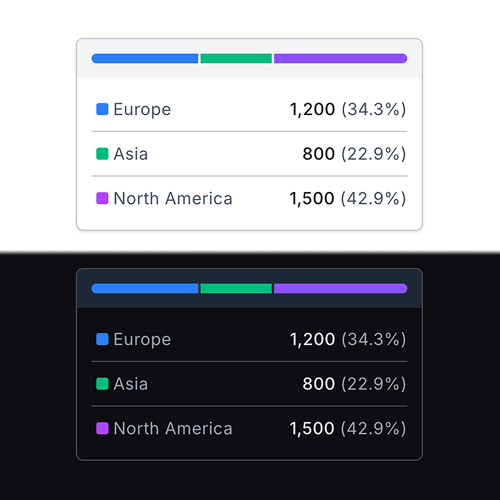
These Bar Lists make analytics easier to read — perfect for dashboards, admin panels, and SaaS insights. Get them + 300+ UI blocks and 2 premium templates at 30% OFF this Black Friday. 👉 ui.angular-material.dev/blocks/applica…

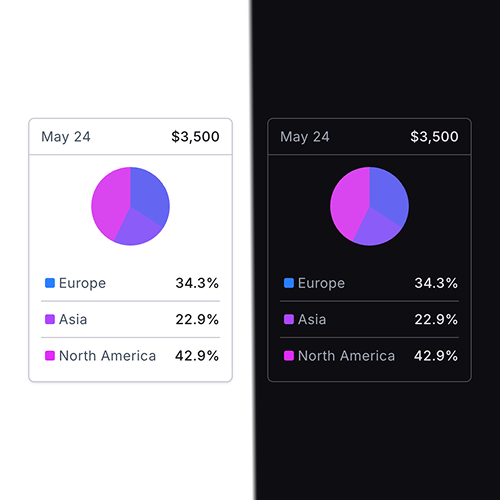
Which chart tooltip you like more? Both are built for #Angular, ChartJS and using #TailwindCSS Get them and more at ui.angular-material.dev/blocks/applica…
Hello @angular enthusiasts, Your favourite 🍞 toast library ngxpert/hot-toast now supports #Angular 21 Repo: github.com/ngxpert/hot-to… Docsite: ngxpert.github.io/hot-toast
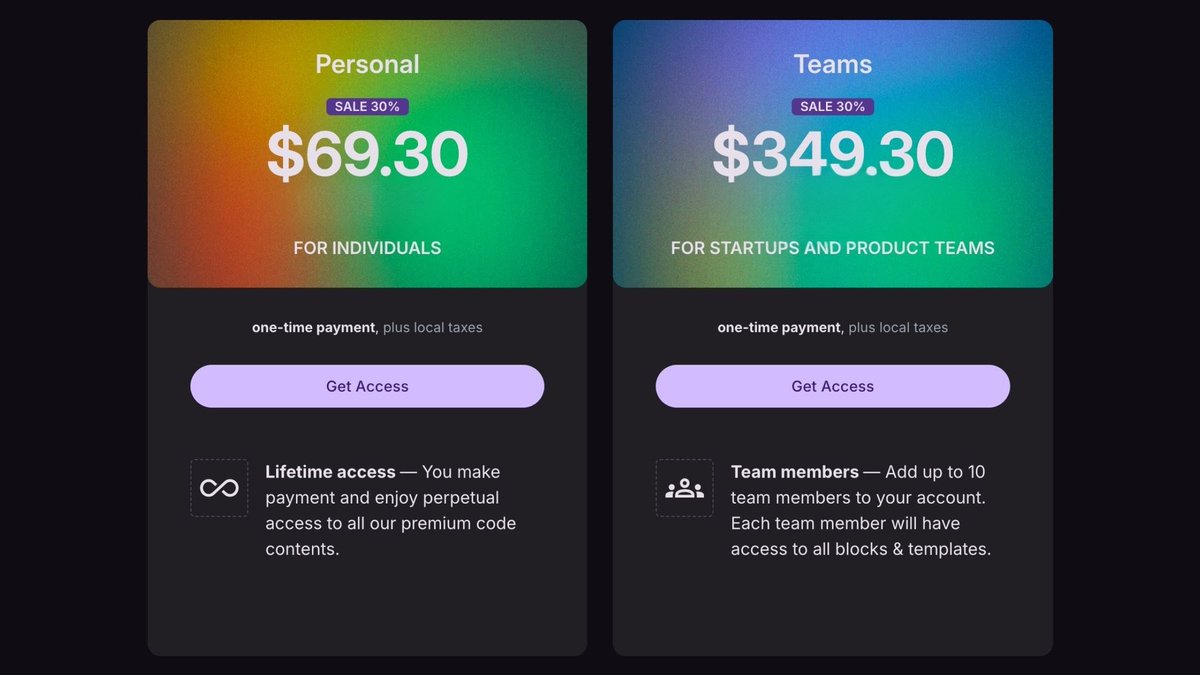
Stop designing pricing pages from scratch. Our Pricing Section blocks give you highly polished SaaS pricing layouts that just work. This Black Friday: 💜 300+ UI blocks 💜 2 premium templates 💜 All for 30% OFF 📅 Ends 30th Nov 👉 ui.angular-material.dev/blocks/marketi…

These chart tooltips turn raw charts into meaningful insights for your users. Get them — along with 300+ UI blocks and 2 premium templates, everything built using #Angular Material + Tailwind CSS — at 30% OFF this Black Friday Sale. 👉 ui.angular-material.dev/blocks/applica…

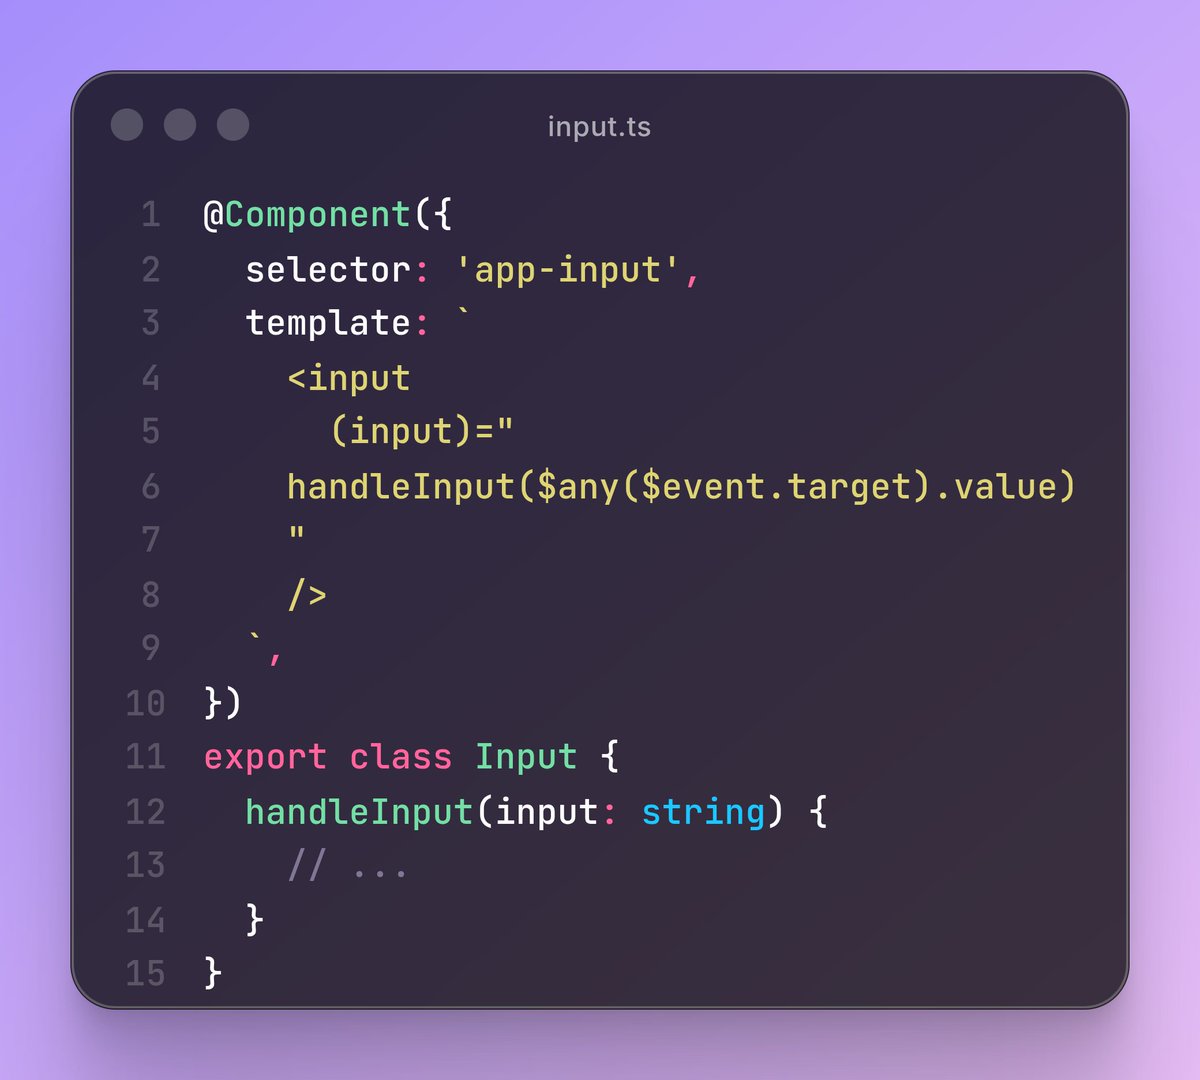
Did you know that in @angular you can disable type checking for binding expressions using `$any()`? For example, in code given, $event.target is cast to `any` equivalent to Typescript.


United States الاتجاهات
- 1. Jalen 72.6K posts
- 2. Eagles 115K posts
- 3. Chargers 83.8K posts
- 4. Herbert 33K posts
- 5. AJ Brown 10K posts
- 6. #BoltUp 4,592 posts
- 7. #WWERaw 49.2K posts
- 8. Saquon 11.5K posts
- 9. Cam Hart 1,353 posts
- 10. Sirianni 5,602 posts
- 11. Patullo 6,977 posts
- 12. #PHIvsLAC 3,794 posts
- 13. Tony Jefferson 3,037 posts
- 14. 4 INTs 3,460 posts
- 15. LA Knight 10.4K posts
- 16. Piers 80K posts
- 17. Greg Roman 1,434 posts
- 18. Cameron Dicker 1,882 posts
- 19. Tanner McKee 1,622 posts
- 20. #Dragula N/A
Something went wrong.
Something went wrong.