

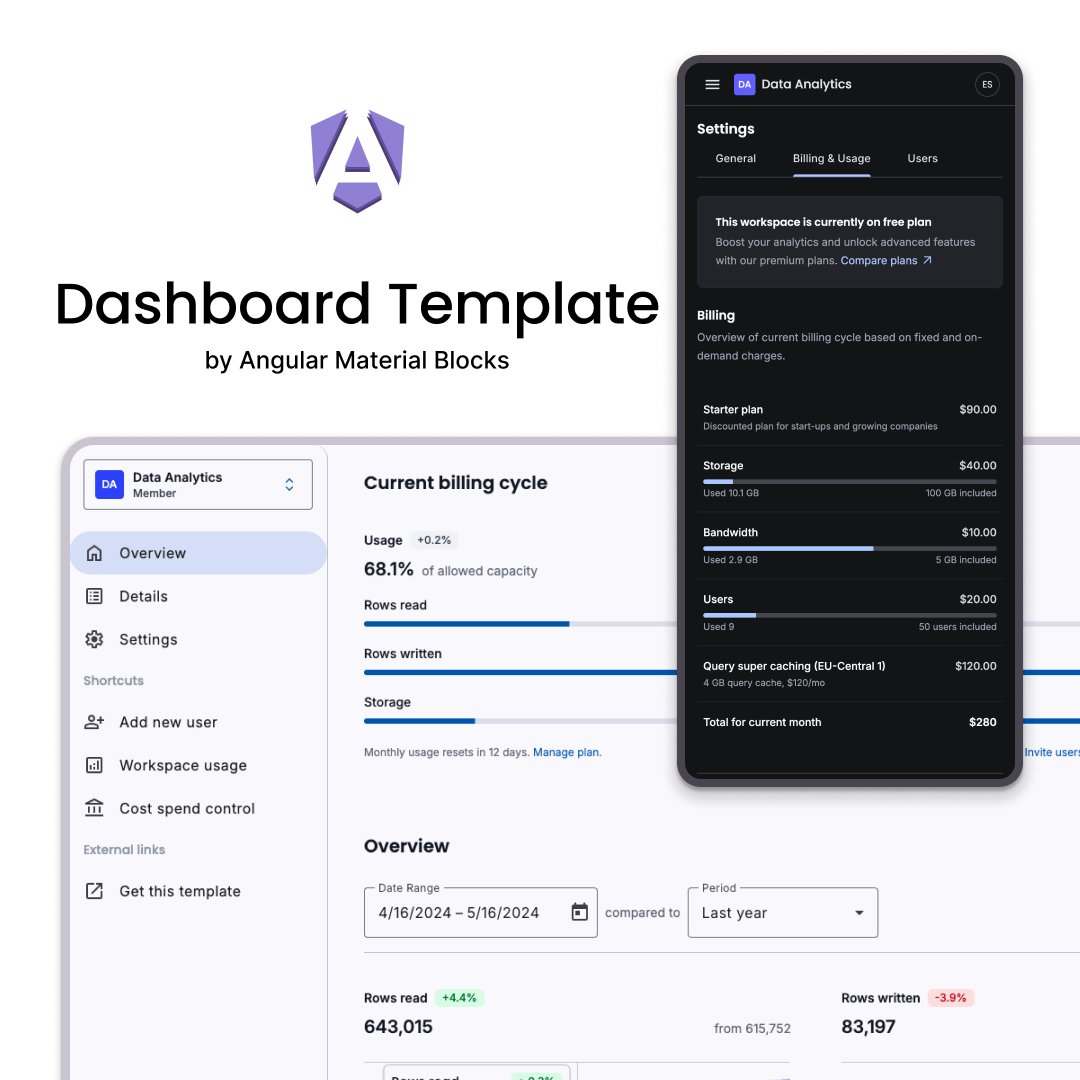
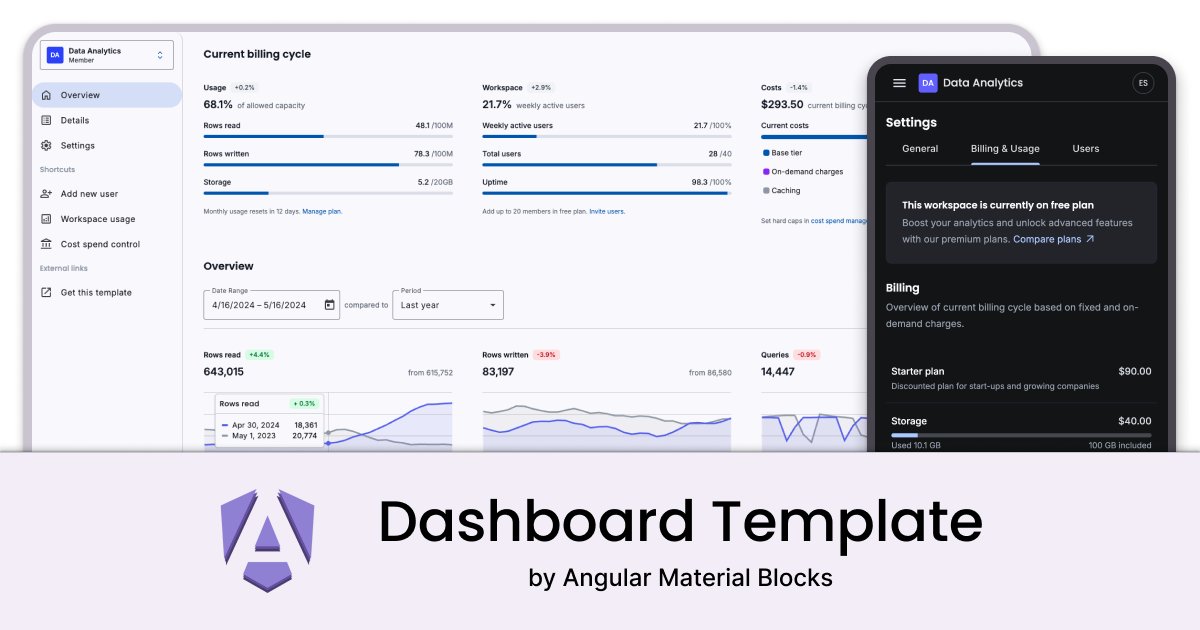
Zoneless is here. We just launched a full "Dashboard" template built with Angular 20 and a zoneless architecture for incredible performance. With: analytics, charts, filterable tables, user management, and billing pages. #Angular #Zoneless #Performance ui.angular-material.dev/templates#dash…

Build your SaaS dashboard in days, not months. Our new "Dashboard" template is live! 🚀 A20, Zoneless, TW4 📊 Charts, tables, filters ⚙️ Settings, Billing, Users 🌓 Light/Dark modes The complete analytics package. #AngularMaterial #SaaS #UIUX ui.angular-material.dev/templates#dash…

Published a small article: "Position icons at the end in Angular Material buttons" angular-material.dev/articles/mat-b… @angular #angular #angularmaterial #WebDevelopment
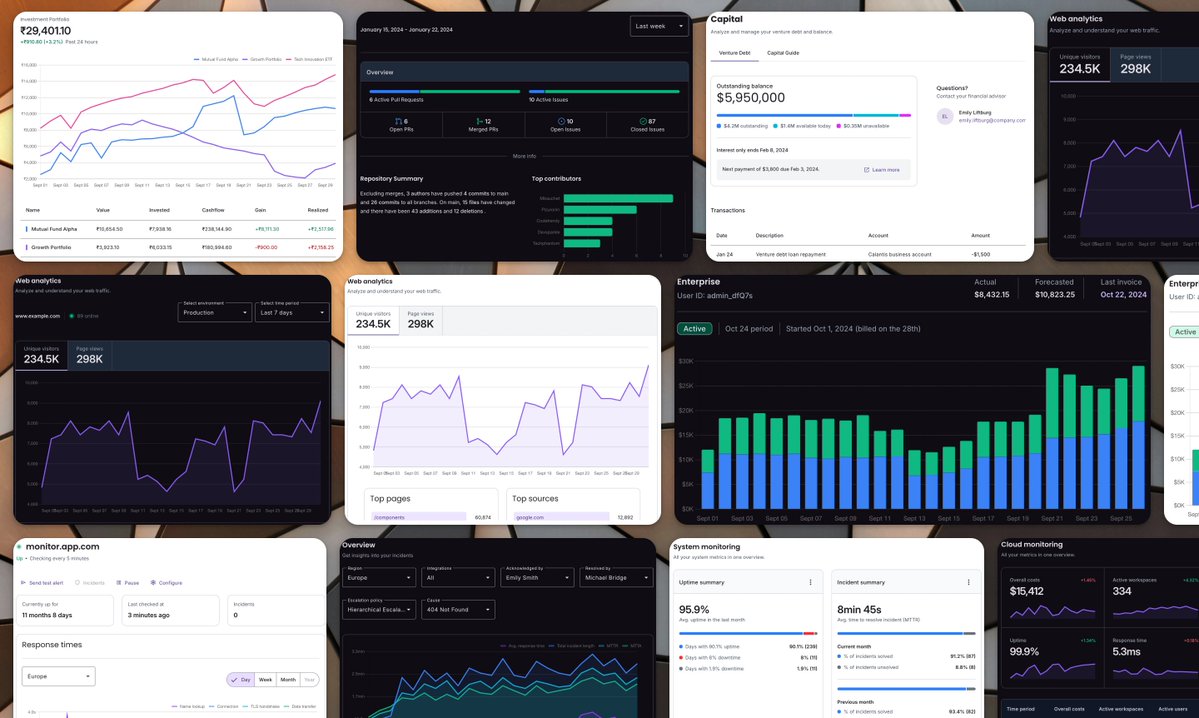
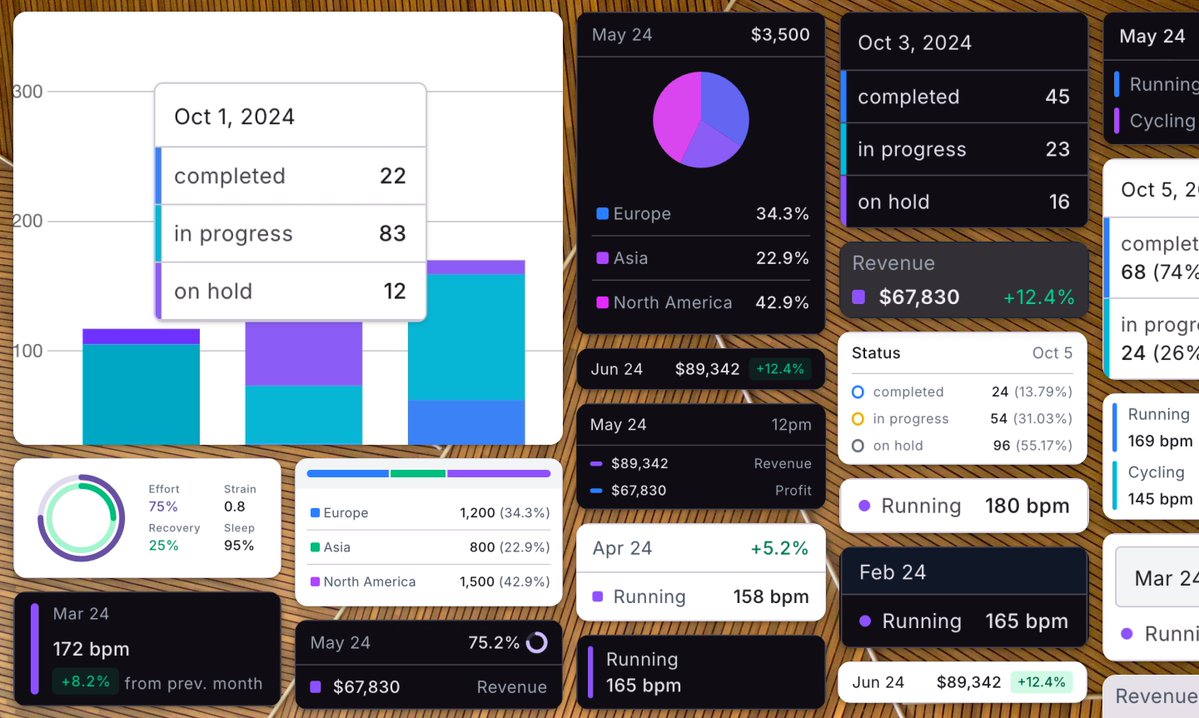
The final piece of the puzzle is here. We saved the best for last. ✨ Introducing Chart Compositions: complete, dashboard-ready layouts that bring all our chart blocks together with stats, tables, and filters. ui.angular-material.dev/blocks/applica… #Angular #DataViz

Our new Chart Compositions are here, combining charts, stats, and tables into powerful, ready-to-use dashboard layouts. See what you can build: ui.angular-material.dev/blocks/applica… #AngularDev #WebComponents #DataVisualization

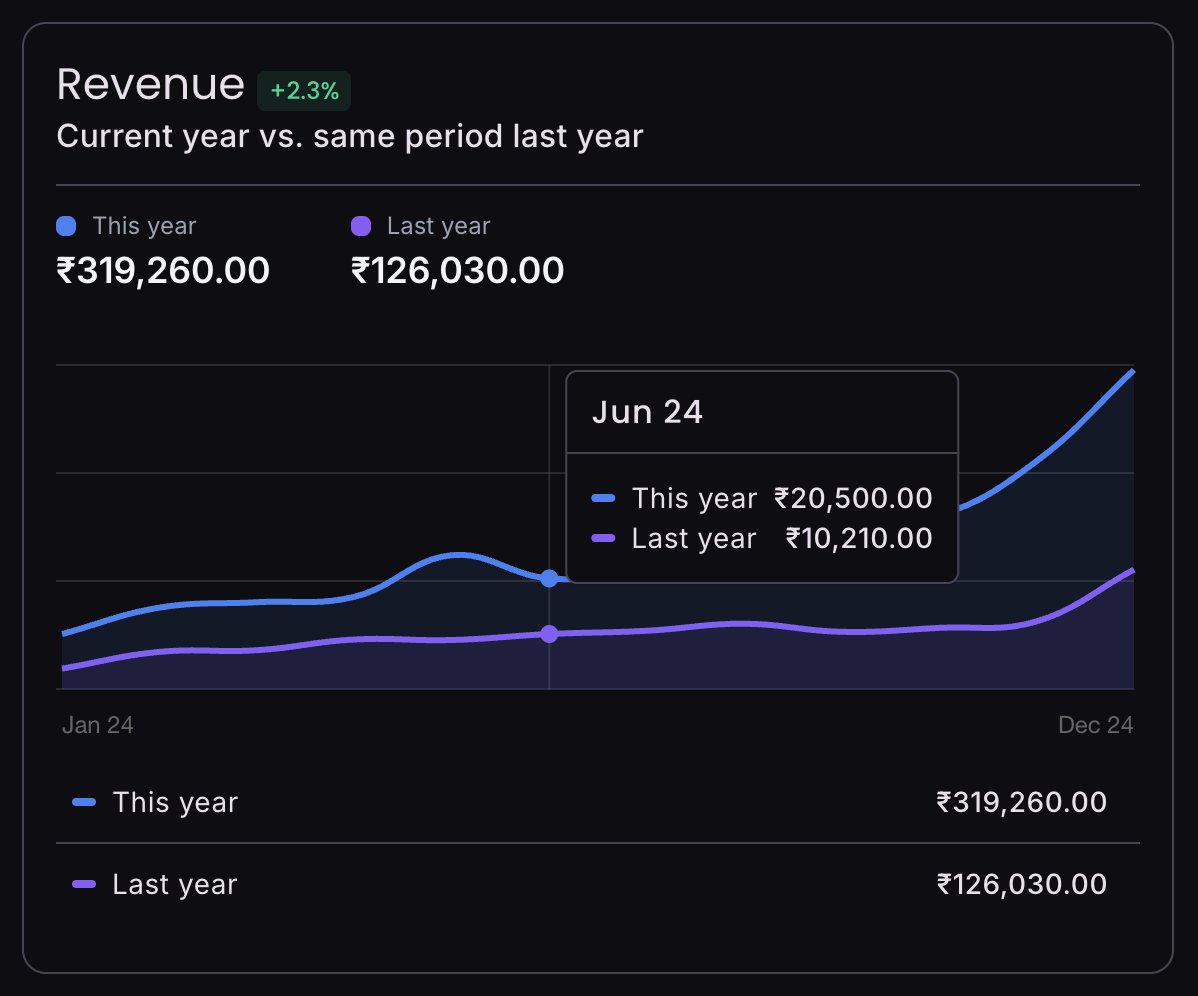
✨ Block of the Day: The Revenue Comparison Chart! Perfect for showing year-over-year performance. We love the details in this: ✅ Clean light-dark themes ✅ Vertical hover line for easy tracking ✅ Custom tooltip See it live: ui.angular-material.dev/blocks/applica… #Angular #DataViz #UIUX

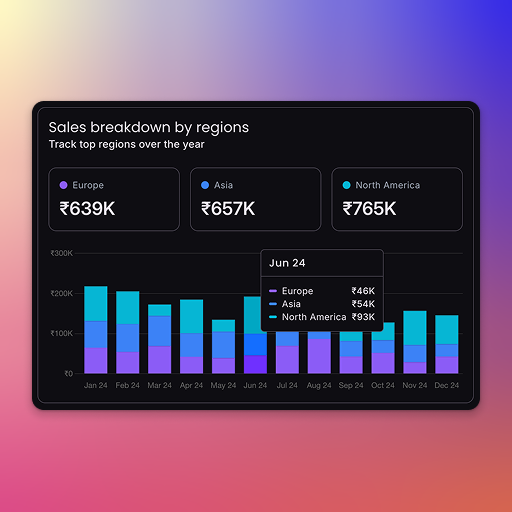
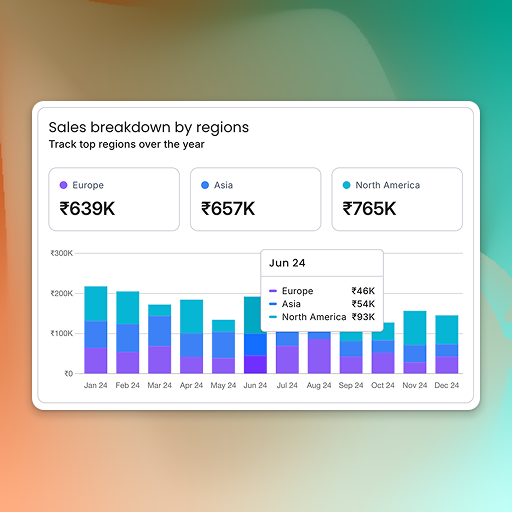
Today's Feature Block: A perfect "Sales Breakdown" chart. ✨ We love this design because it combines high-level KPI cards with a detailed stacked bar chart. It gives you the big picture and the deep dive, all in one view. ui.angular-material.dev/blocks/applica… #Angular #DataViz #Dashboard

Small interactions that make a chart great. Our Block of the Day is this Revenue Comparison Chart, featuring a smooth hover line and a custom tooltip that gives users the exact data they need, right when they need it. 👉 ui.angular-material.dev/blocks/applica… #AngularMaterial #Dashboard


✨ Block of the Day: The Revenue Comparison Chart! Perfect for showing year-over-year performance. We love the details in this: ✅ Clean light-dark themes ✅ Vertical hover line for easy tracking ✅ Custom tooltip See it live: ui.angular-material.dev/blocks/applica… #Angular #DataViz #UIUX
Looking for sales dashboard inspiration? Check out our "Sales Breakdown by Region" block. It features: ✅ Summary stat cards per region ✅ A stacked bar chart for monthly trends ✅ Interactive tooltips ui.angular-material.dev/blocks/applica… #AngularMaterial #UIUX

Today's Feature Block: A perfect "Sales Breakdown" chart. ✨ We love this design because it combines high-level KPI cards with a detailed stacked bar chart. It gives you the big picture and the deep dive, all in one view. ui.angular-material.dev/blocks/applica… #Angular #DataViz #Dashboard
Your sales dashboard, elevated. 🚀 This featured block combines key stats with a beautiful stacked bar chart to track regional performance over time. A masterclass in data visualization. #AngularDev #Charts ui.angular-material.dev/blocks/applica…


Don't just build charts. Build full dashboards 🚀 Our new Chart Composition blocks are live! These are complete, real-world layouts for analytics, monitoring, and financial UIs The fastest way to feature-rich dashboard: ui.angular-material.dev/blocks/applica… #AngularMaterial #UIUX #Dashboard
The final piece of the puzzle is here. We saved the best for last. ✨ Introducing Chart Compositions: complete, dashboard-ready layouts that bring all our chart blocks together with stats, tables, and filters. ui.angular-material.dev/blocks/applica… #Angular #DataViz
It's all in the details. ✨ We've just launched a new collection of Chart Tooltip blocks! A huge variety of designs to make your charts more interactive and informative. The perfect finishing touch for your dashboards: ui.angular-material.dev/blocks/applica… #Angular #UIUX #DataViz

New Blocks Alert! 🚀 A beautiful collection of Chart Tooltips is now live. From simple labels to detailed data breakdowns, we've got a tooltip style for every chart you build. See all the examples: ui.angular-material.dev/blocks/applica… #AngularMaterial #WebDev #Charts

It's all in the details. ✨ We've just launched a new collection of Chart Tooltip blocks! A huge variety of designs to make your charts more interactive and informative. The perfect finishing touch for your dashboards: ui.angular-material.dev/blocks/applica… #Angular #UIUX #DataViz
Don't just show the chart, explain the data. Our new Chart Tooltip blocks are here to make your data visualizations more insightful and interactive. Explore the collection: ui.angular-material.dev/blocks/applica… #AngularDev #DataVisualization #UI
Sometimes, the simplest chart is the most effective. Our new Bar List blocks are now live, making it incredibly easy to visualize your top-performing items at a glance. Perfect for any dashboard. See the demos: ui.angular-material.dev/blocks/applica… #AngularMaterial #UIUX #Dashboard

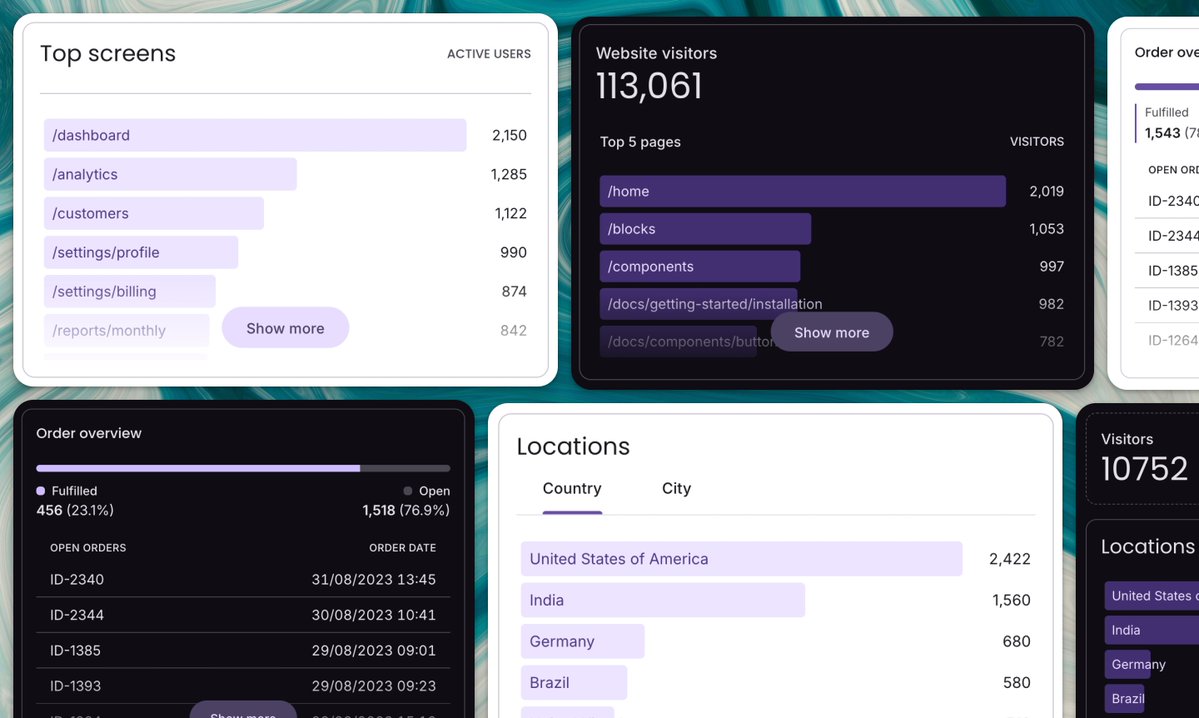
Rank your data beautifully. ✨ Introducing our new collection of Bar List blocks! The perfect way to show ranked data like top screens, locations, or order statuses in a clean, visual format. Explore them all: ui.angular-material.dev/blocks/applica… #Angular #DataViz #UI
✨ New blocks are coming to Angular Material Blocks → Area Charts powered by Chart.js + ng2-charts. ✅ Light/Dark mode ✅ Vertical hover lines ✅ Custom tooltips 💯 Fully customizable 👉 ui.angular-material.dev #Angular #AngularMaterial #Charts #Analytics #Dashboard

Sneak peek: ⚡ Customizable Area Charts → Chart.js + ng2-charts 🌞🌙 Theme ready 📍 Vertical hover lines 💬 Custom tooltips Available soon on 👉 ui.angular-material.dev

✨ New blocks are coming to Angular Material Blocks → Area Charts powered by Chart.js + ng2-charts. ✅ Light/Dark mode ✅ Vertical hover lines ✅ Custom tooltips 💯 Fully customizable 👉 ui.angular-material.dev #Angular #AngularMaterial #Charts #Analytics #Dashboard
It’s live! 🚀 Our new collection of Area Chart blocks is here. Visualize your data with a huge variety of styles for analytics, monitoring, financial dashboards, and more. Interactive, beautiful, and ready for your Angular app. ui.angular-material.dev/blocks/applica… #Angular #DataViz #Charts

Data visualization just got another major upgrade! 📊 Introducing our new collection of Bar Chart blocks. Includes stacked, grouped, and standard bar charts perfect for any dashboard. Explore all the new charts: ui.angular-material.dev/blocks/applica… #Angular #DataViz #Charts #UI


United States 趨勢
- 1. Jets 82.4K posts
- 2. Bengals 49.2K posts
- 3. Eagles 112K posts
- 4. Giants 93.9K posts
- 5. Caleb 37K posts
- 6. Falcons 38.3K posts
- 7. Zac Taylor 4,998 posts
- 8. Browns 47K posts
- 9. Bears 65.8K posts
- 10. Myles Garrett 8,302 posts
- 11. Ravens 50.2K posts
- 12. Dolphins 27.9K posts
- 13. Drake Maye 16.4K posts
- 14. 49ers 30.9K posts
- 15. Skattebo 43.5K posts
- 16. Andy Dalton 9,062 posts
- 17. Justin Fields 7,862 posts
- 18. Anthony Nelson 1,271 posts
- 19. Dylan Harper 4,720 posts
- 20. Dillon Gabriel 5,707 posts
Something went wrong.
Something went wrong.