
내가 좋아할 만한 콘텐츠


A great demonstration of why we need to plot the data and never trust statistics tables! autodeskresearch.com/publications/s…
Alicja Natalia Makarewicz gives a nice overview of her research: spoiler - there are over 2 million farm dams in Aus…lnkd.in/bX-KWP7
Just made an impromptu post on recent rain events: The River Torrens like you have never seen it before. ow.ly/AHoj100lczq
Thanks Graeme Riddell - I learnt a few things about scenario based planning from your post. lnkd.in/bCTvKD6
The most important questions to ask about climate change lnkd.in/bkcJ6Y3
Q: "Why Study Civil, Environmental & Mining Engineering @ UoA?" A: Let me tell you … 2pm Flentje Lecture Theatre. #UAOpenDay
Please check out my blogpost on extremes. It uses interactive apps to explain some of the basic concepts. lnkd.in/bp5meFG
Do it better: Seven reasons you should use optimisation waterdecisions.org/seven-reasons-… @jeffreynewmana1
The perils of innumeracy. SMBC comic: i.redd.it/suzkkojte25x.p…
This is why we need spatial rainfall models for flood studies, ow.ly/fm0N100cgd3
Nice lab experiment from Manly hydraulic, showing how easy it is for cars to get carried away at a flood crossing ab.co/1ru6tVw
abc.net.au
Car experiment shows extent of flood danger
How much floodwater does it take to carry a car away? A world-first experiment shows how even slow-moving water packs a powerful punch.
"A bit of numeracy can take the heat out of the asylum debate" theconversation.com/a-bit-of-numer…
A nice example of starting with informal ideas when teaching. "Blue Point Rule" blog.mrmeyer.com/2016/blue-poin…
Lisa Blinco has a great illustration on cross disciplinary research between pipe hydraulics and hydrology ow.ly/p9ln1005smw
"Students are using 'smart' spy technology to cheat in exams" theconversation.com/students-are-u…

"The Difference Between Pure And Applied Math" blog.mrmeyer.com/2016/the-diffe…
Extreme storms in a future climate: Warmer, and more intense ow.ly/4nm65i [doi: 10.1002/2016GL068509]
Hyperwall. You. are. so. beautiful... to me. #EGU16 svs.gsfc.nasa.gov/cgi-bin/detail…

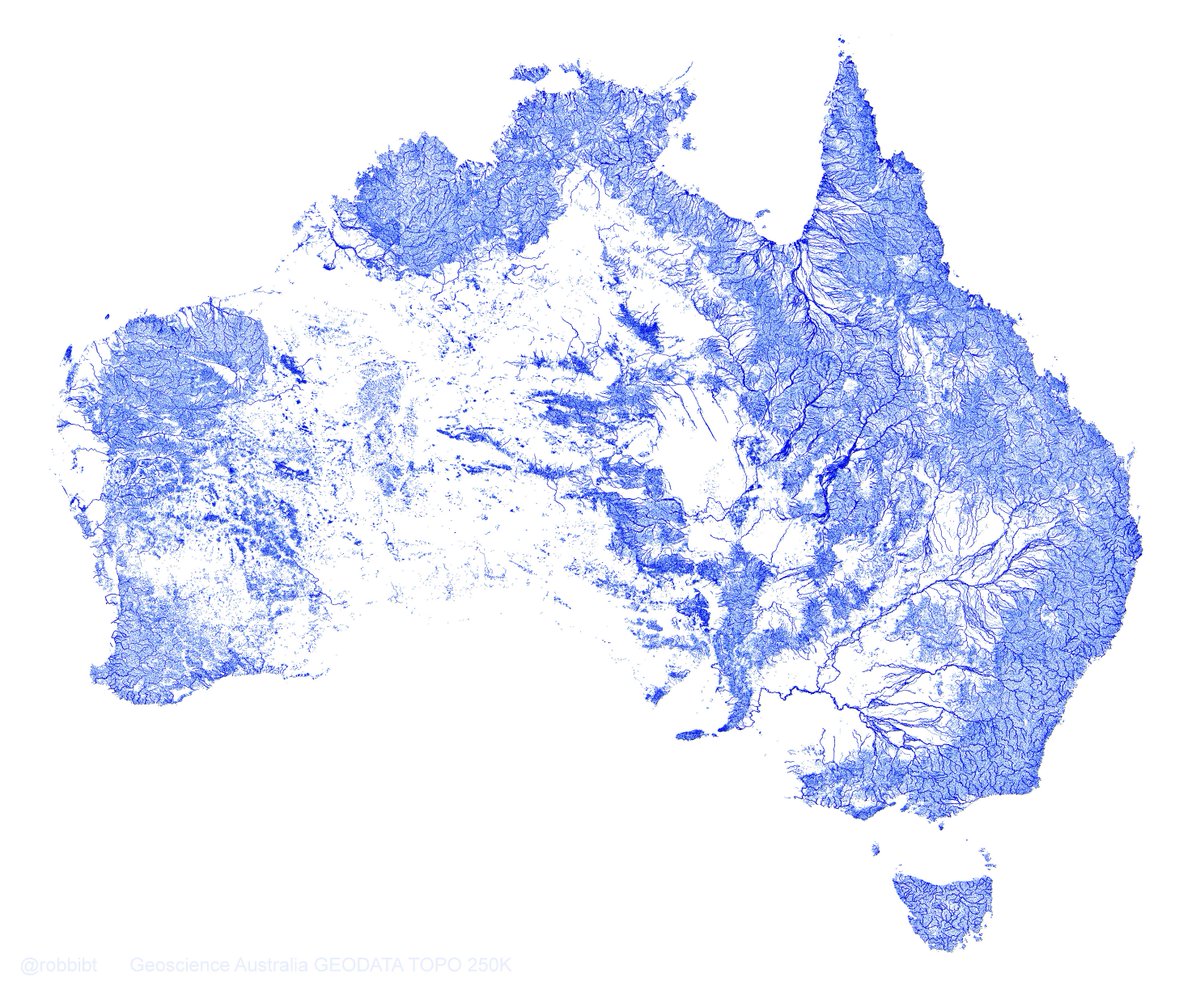
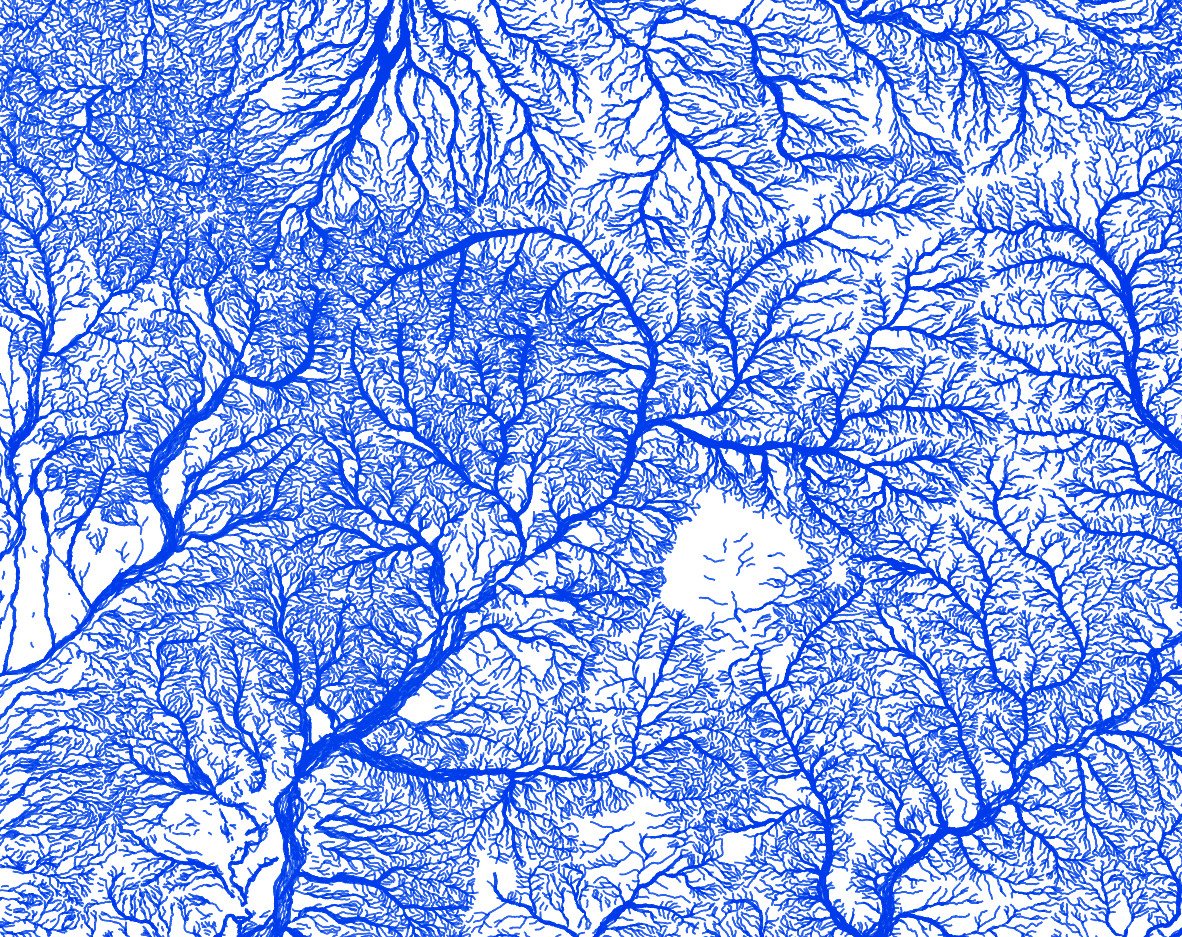
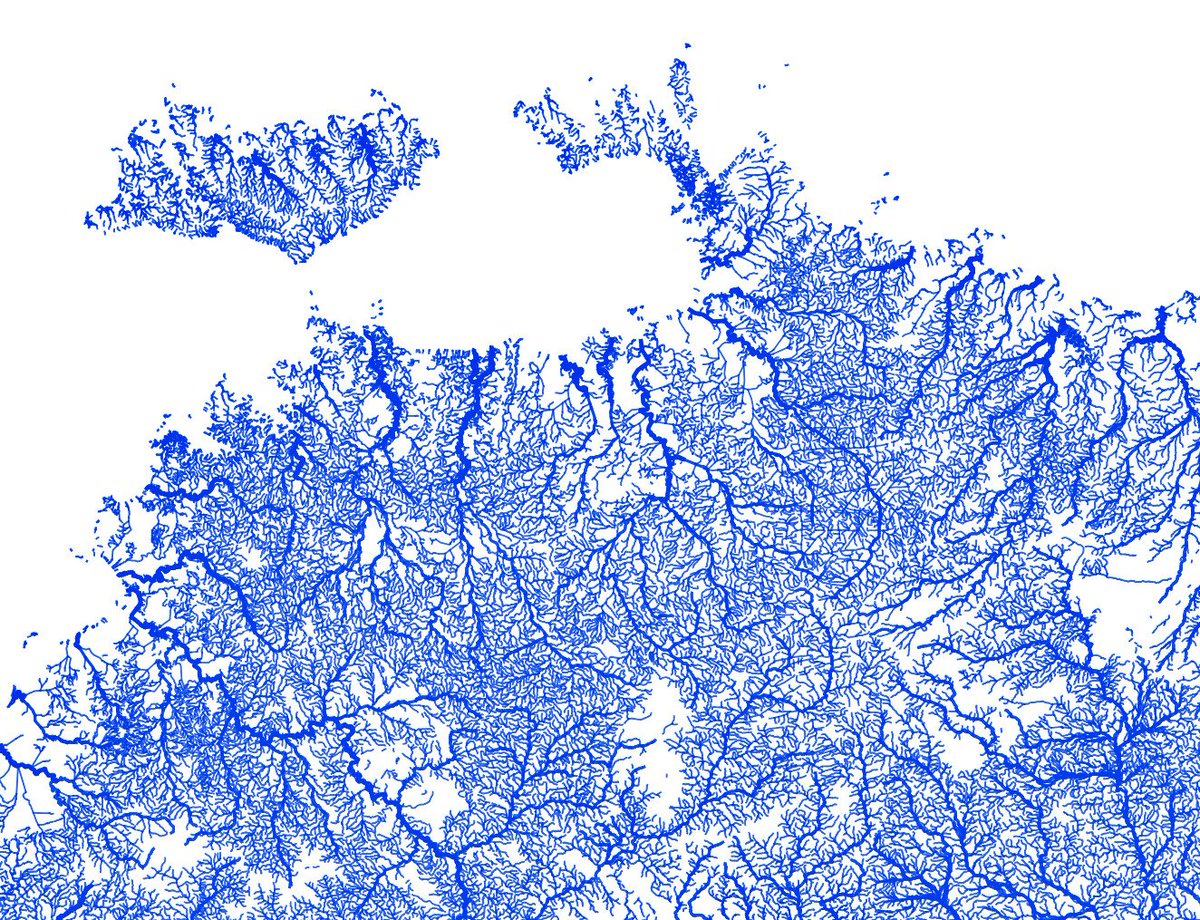
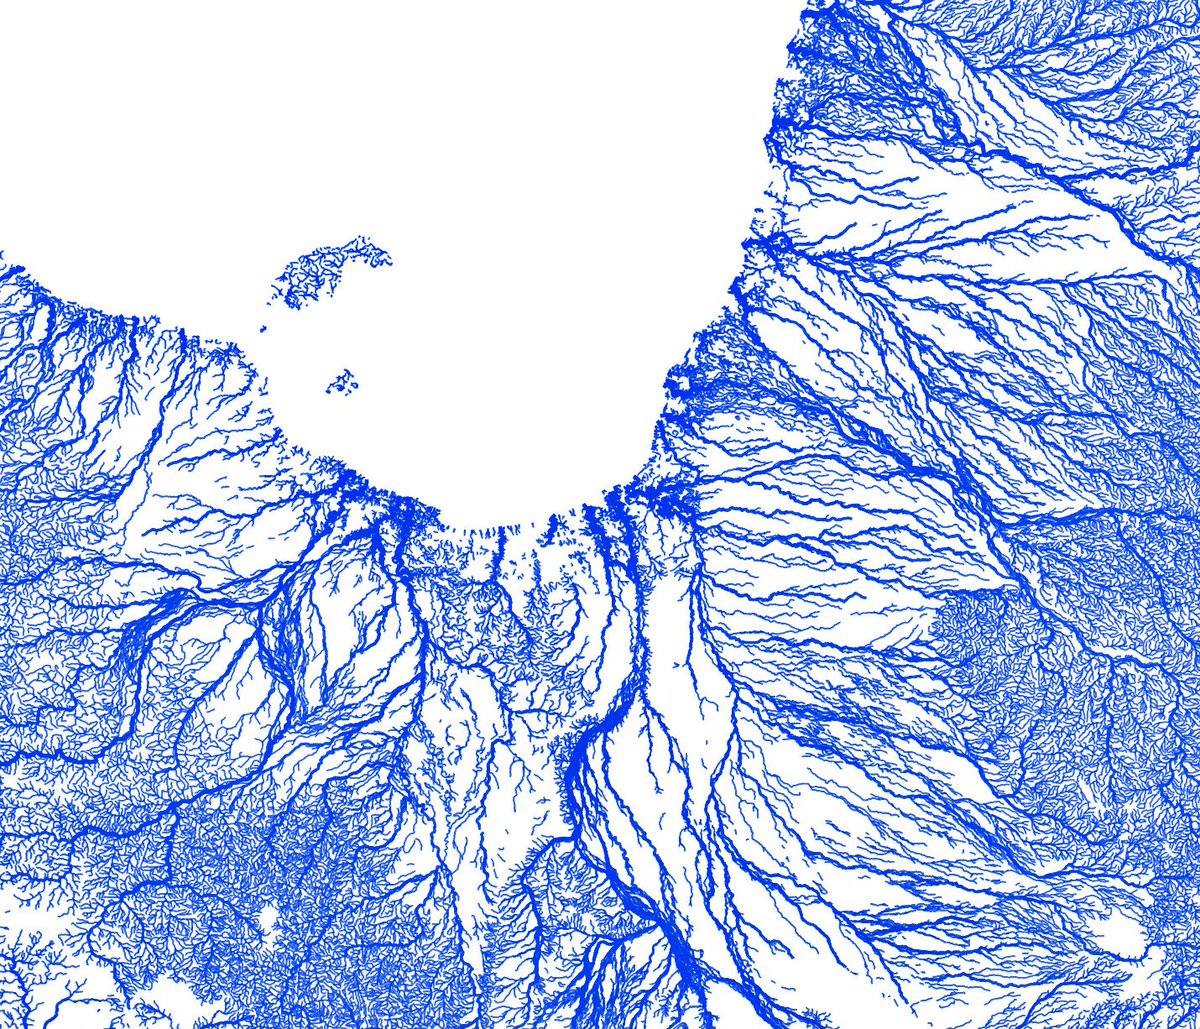
#Australia plotted by every mapped stream and river... all 1.3 million of them! github.com/robbibt/austra…


United States 트렌드
- 1. #JoyForum N/A
- 2. #2025MAMAVOTE 160K posts
- 3. Good Thursday 17.5K posts
- 4. #MC필릭스의_냉터뷰 10.9K posts
- 5. MC FELIX FRIDGE INTERVIEW 11.8K posts
- 6. #FridgeInterview_MCFelix 11.1K posts
- 7. Deport Harry Sisson 11.5K posts
- 8. Mila 18K posts
- 9. Brevis ZK 140K posts
- 10. BNB Chain 21.6K posts
- 11. Ninja Gaiden 9,712 posts
- 12. Deloitte 8,634 posts
- 13. DuPont 2,047 posts
- 14. #enhypen 135K posts
- 15. Pelosi 144K posts
- 16. Angel Reese 55.8K posts
- 17. John Fetterman 27.3K posts
- 18. Gabe Vincent 4,439 posts
- 19. Domain For Sale 19.7K posts
- 20. Mad Max 4,300 posts
내가 좋아할 만한 콘텐츠

Something went wrong.
Something went wrong.