
Mike Domenic
@armyguynyc
Pro options trader; Ex Merrill Lynch, Founder Pickaxe Capital; Retired US Army Special Ops officer; French speaker; Sky,SCUBA diver; Achieve the unachievable 😉
You might like


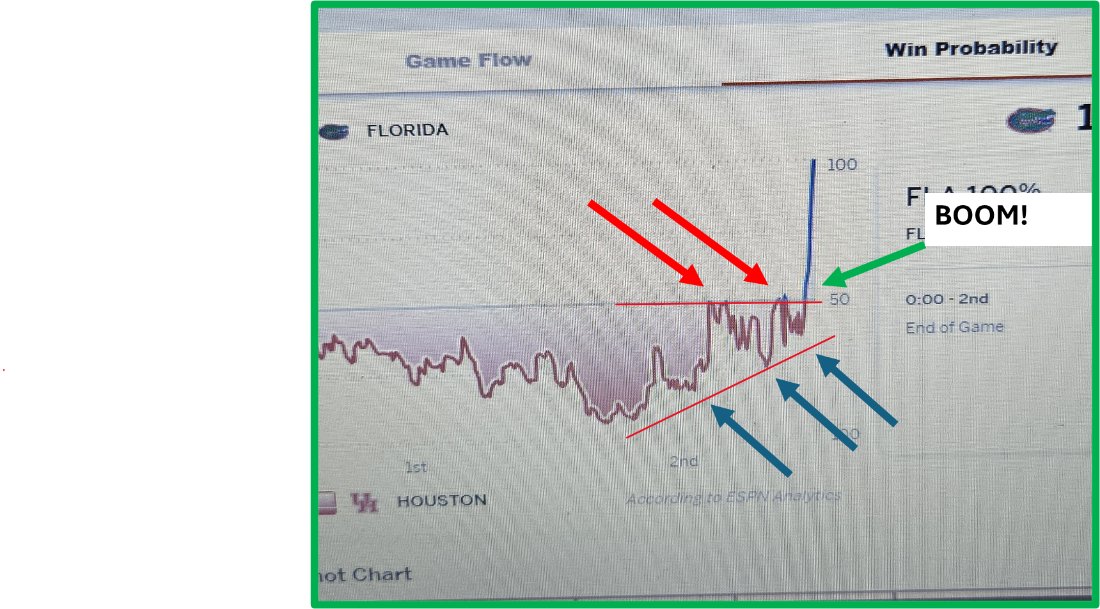
Checkout the ascending wedge B/O in the Gator’s win probability % last night. A series of higher lows (blue arrows) after challenging resistance at 50% (red arrows) then B/O. Whether a sport or a stock market, its group behavior. BOOM! $SPY $QQQ #Gators
6 times since 1980 when $SPX monthly ST (14), IT (28), and LT (56) RSI all diverged lower they were confirmed by lower $SPX price. 6 of 6 times led to a bear market (1990 20%) (2000 51%) (2007 57%) (2018 20%) (2020 precovid 35%) (2022 27%). Feb 2025 is the 7th time.


Our buddy @armyguynyc from the Alpha Team VTF® said this about $MSTR this morning. An interesting take:

$DJT Nov ATM options are 30%. If it continues to rally into or near 5 Nov, I’ll definitely sell upside calls. Justification: 1. Trump loses stock falls. 2. Trump wins stock drops already priced in. 3. Win or lose, the option premium will suck out b/c the risk event is over.
The “Hockey Stick” pattern. I self named this pattern. Refers to the pattern’s general shape. 1. A steep decline (sellers strong). 2. Then a southeasterly move (sellers getting weak, buyers getting strong). 3. Break higher (buyers strong). $SPY $SPX $QQQ, $CRUS

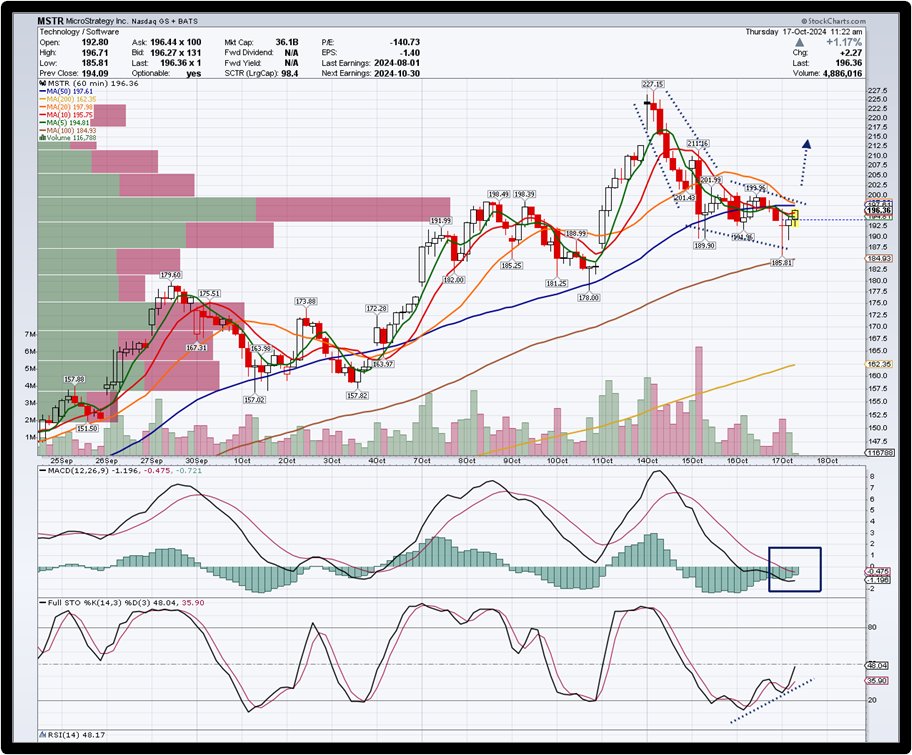
$MSTR. 1 hour “hockey stick” pattern with curling MACD and bullish diverging Stochs. Standby for a B/O > 198 to confirm. I'm long $MSTY and short $MSTR Nov 200/195 puts - yes, I'm short ITM puts

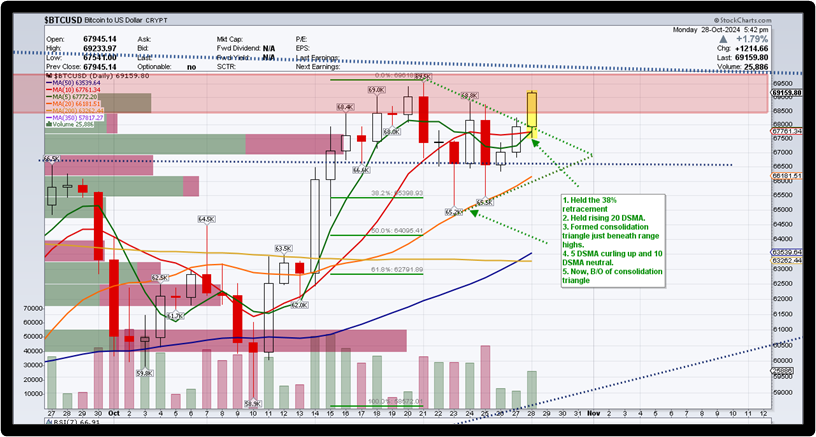
I’m not a fan of $MARA , but the chart is compelling. A bull flag > rising 5 DSMA within a triangle and RSI already B/O. Chart. $BTC $MSTR

The updated $SPX 5 and 10 DSMA Swing Trading Strategy. -A very simple and effective swing trading strategy. -Buy when 5 DSMA crosses > 10 DSMA and sell vice versa. Hold as long as 5 DSMA is rising. That’s it. -It can be fine tuned to buy/sell when 5 DSMA begins to curl or moves…

For swing traders, If you're not long $AAPL on this flag B/O you're wrong. Soooo many bullish indications.

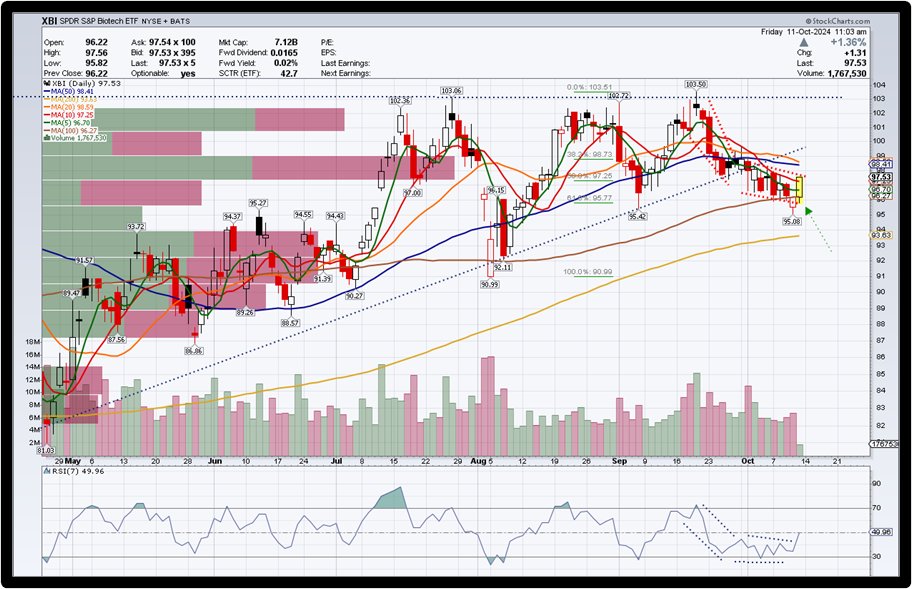
Add $XBI to your trade list. Its “hockey stick” pattern is likely to B/O soon. The RSI already has. Its 100 DSMA and .618 retracement both held. Chart.
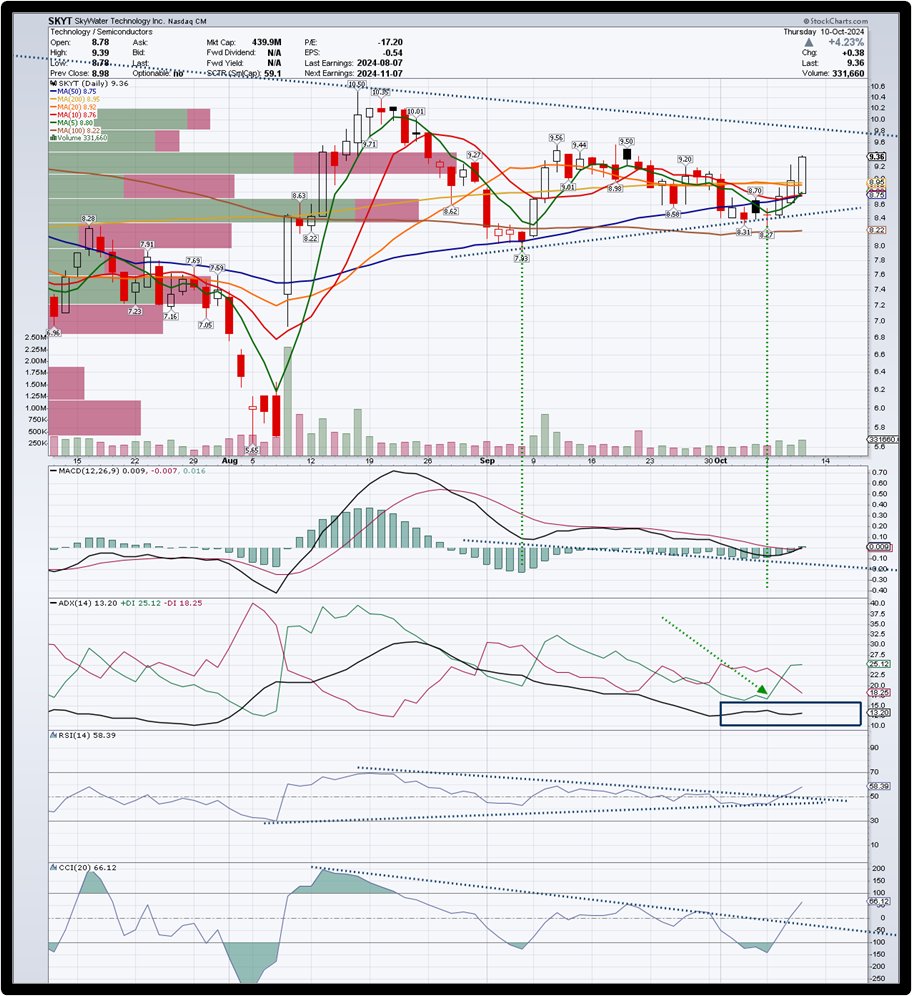
$SKYT popped up on my scan. $450Mn Mkt Cap. Pattern and technicals look great. Day 1 y’day, MACD trend confirmation signal with low ADX; RSI, CCI already B/O. ER 7 Nov. Chart.
$KRE. A little “something-something” may be brewing and with IHS in RSI and CCI. Whoa!! Chart $JPM, $BKW, $DPST


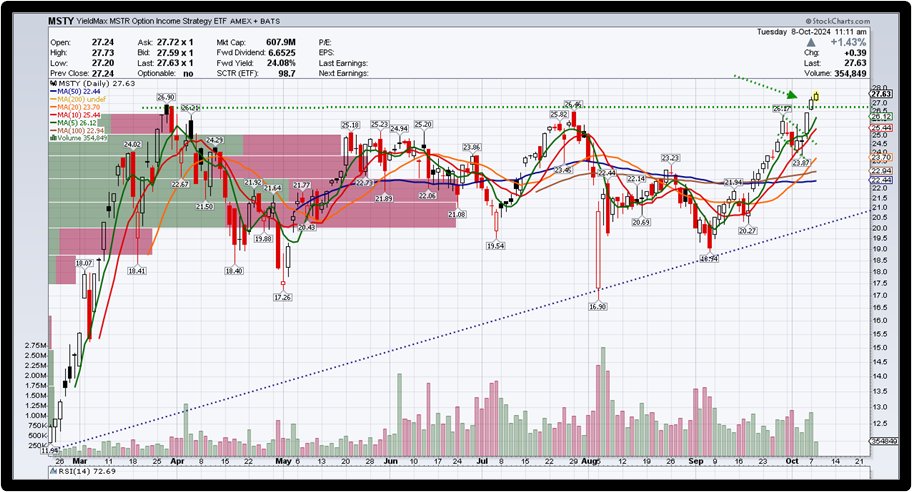
Yield Max $MSTY has led $MSTR proving a clue what would happen near term. $MSTY has already B/O to ATHs. Chart.


United States Trends
- 1. Good Monday 27.5K posts
- 2. TOP CALL 3,766 posts
- 3. AI Alert 1,404 posts
- 4. #centralwOrldXmasXFreenBecky 549K posts
- 5. SAROCHA REBECCA DISNEY AT CTW 569K posts
- 6. #BaddiesUSA 65.9K posts
- 7. #MondayMotivation 7,514 posts
- 8. Market Focus 2,530 posts
- 9. #LingOrmDiorAmbassador 292K posts
- 10. NAMJOON 55.6K posts
- 11. Check Analyze N/A
- 12. Token Signal 1,852 posts
- 13. Rams 30.4K posts
- 14. #LAShortnSweet 24.3K posts
- 15. DOGE 182K posts
- 16. Chip Kelly 9,277 posts
- 17. Vin Diesel 1,566 posts
- 18. Scotty 10.5K posts
- 19. Stacey 23.8K posts
- 20. Gilligan 4,070 posts
You might like


Something went wrong.
Something went wrong.