
Autometrics
@AutometricsDev
Autometrics Explorer is a tool for enhanced application observability. Tracking function performance, latency, and error rates in context.
You might like


Launching Autometrics Observability Stack! Get 0 to 1 application level performance out of the box. Auto-instrument your code, visualize your metrics and get context-rich alerts in Slack. autometrics.dev/blog/announcin…


🚀🔎Elevate your Django app’s performance with ease! Our latest blog post explains how to add observability in just 3 steps using @autometricsdev. Say goodbye to complex monitoring setups and hello to real-time insights. Dive in: bit.ly/4aGNFIG #Django #Observability
Exciting update! 🚀 We created detailed deployment guides for @AutometricsDev on @northflank ! Deploy the Microframework effortlessly, get detailed app metrics, and boost performance. autometrics.dev/blog/applicati…
Join us tomorrow at 11 am (CET) as we participate in a webinar hosted by @kunalstwt: 'Application 011Y with @AutometricsDev & beyond' Discover how metrics can elevate your application performance in just 45 minutes! Don't miss out! youtube.com/watch?v=roQX2H…

youtube.com
YouTube
Application observability with Autometrics & Beyond
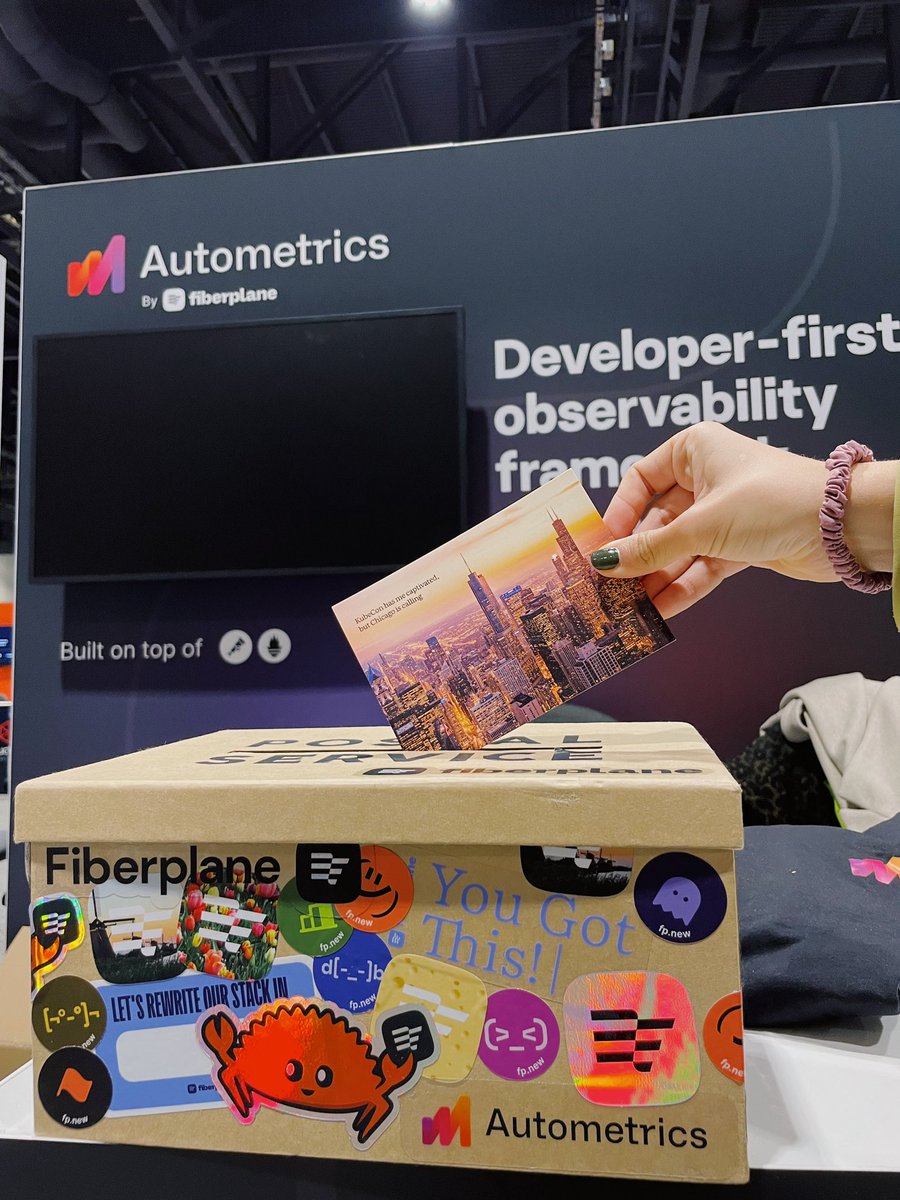
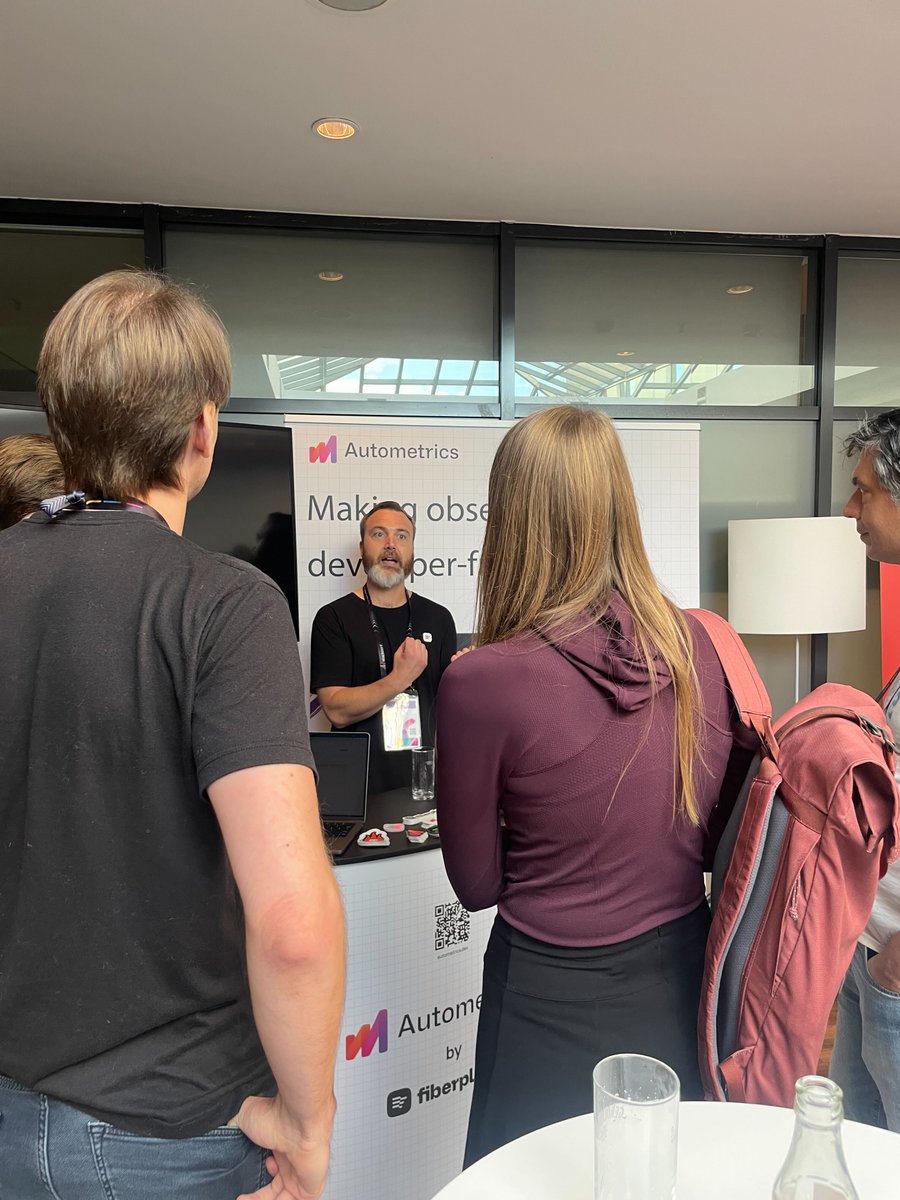
We are excited to be at #KubeConNA to talk more about our upcoming @AutometricsDev 1.0 launch! Make sure to stop by our booth and say hi and if you want to send a postcard to your friends and family we have you covered with our on-site post office

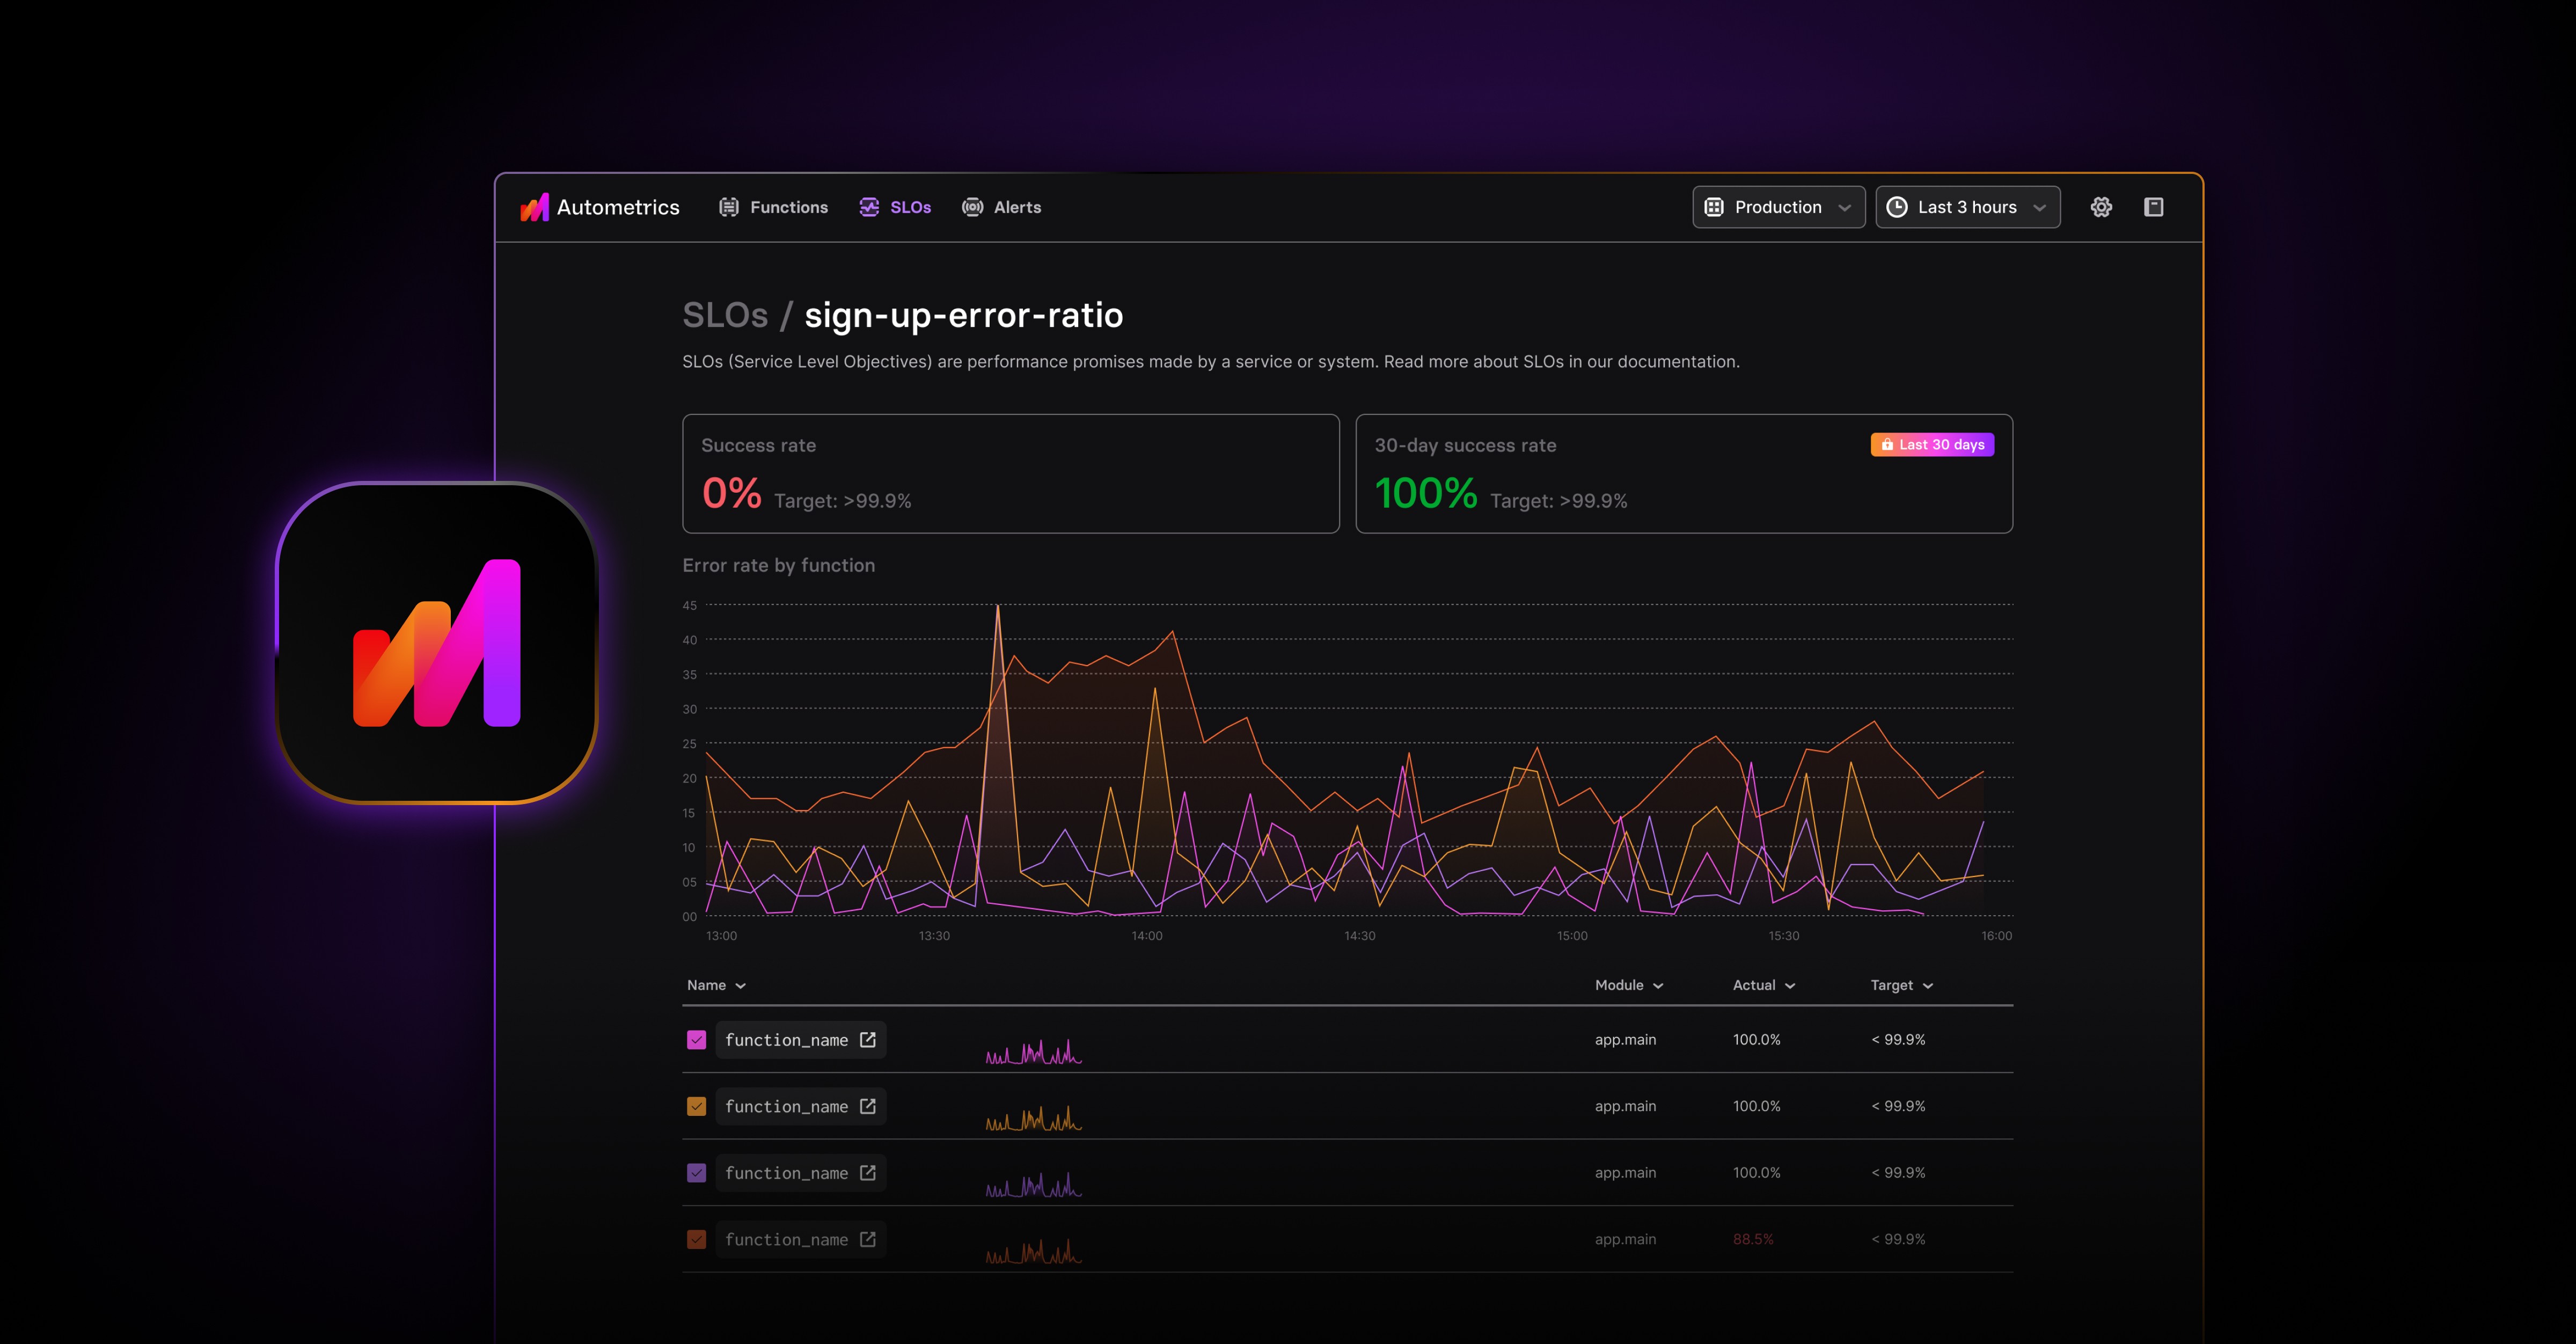
Another day, another @AutometricsDev release! Introducing the NEW Explorer Dashboard for #Autometrics! 📊 Our revamped start screen is here to enhance your operational intelligence with: 🎯 Improved SLO overview 🚨 Better alert monitoring 🕓 A history timeline for all your…
We wrote an in-depth guide on how to get @opentelemetry metrics on top of @render with @AutometricsDev autometrics.dev/blog/deploying…
autometrics.dev
Deploying a monitoring stack on Render - Blog
The case for pushing metrics rather than scraping and a blueprint combining OpenTelemetry collector with Prometheus
📊 Monthly PSA on why we like metrics and created @AutometricsDev. Metrics often fly under the radar, but they're the unsung heroes of system monitoring. While logs and traces provide valuable context, metrics offer the big picture, helping us spot trends, plan for scalability,…
Introducing Call Graph - a new visualization in Autometrics Explorer to help you gain trace-like insights only with more granular, function-level metrics. Read more: autometrics.dev/blog/announcin…


🌠 Community Highlights Advanced edge function observability made simple. By @AutometricsDev. youtube.com/watch?v=G99ToG…


Interesting tool of the week: autometrics.dev by @autometricsdev We like: Add metrics to existing code with simple annotations or macros. Supports Rust, Go, Python, TypeScript, C#. Alerts and SLOs defined in code next to each instructed method. Can run locally

Tired of Obscure Code Performance? Discover Autometrics! Join #OSMC and Ivan Merrill from @fiberplane to learn how this open-source framework simplifies observability for developers. Say hello to clear insights! osmc.de/talks/observab…

We just launched the @AutometricsDev explorer, your debugging companion featuring function-level metrics, service level objectives and alerts. @nele_lea wrote a tutorial on how get get started with a #python @FastAPI application: autometrics.dev/blog/using-aut…
We’re big fans of @grafana and right on the heels of #promcon we’re happy to publish our guide to zero-config dashboards and monitoring with @AutometricsDev autometrics.dev/blog/zero-conf…

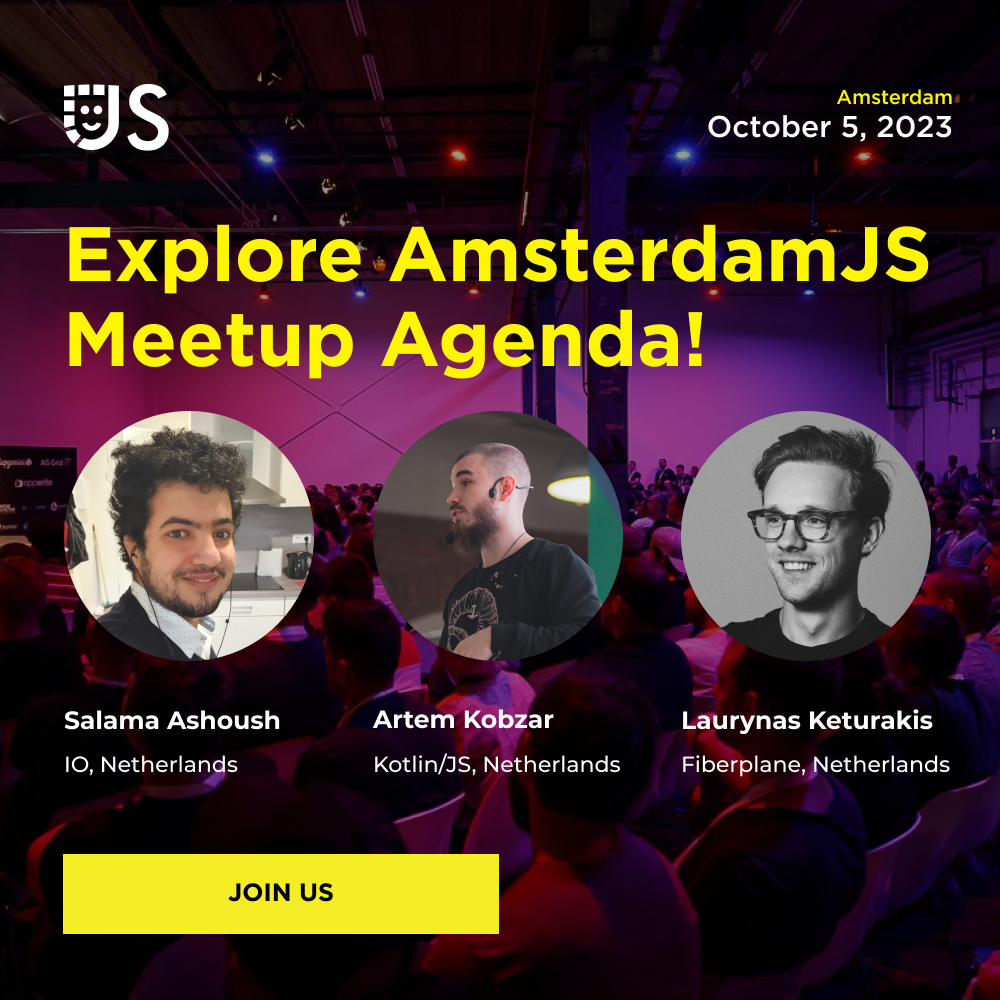
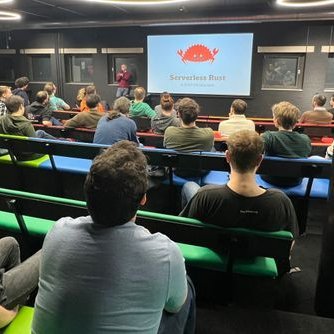
Amsterdam! I'll be giving a little talk about logs, metrics (and @AutometricsDev ofc) in a few weeks - come through!

Check out AmsterdamJS meetup agenda! @salamaashoush➡️Fine-Tuning Reactivity: Harnessing Power of Signals @rage_monk➡️How to Make Friends with Android & Backend Departments @_laurynas➡️TFW You can't Console.log Way out of Production Issues Join us👉shorturl.at/dOZ19
Wrapping up #stackconf. We had good conversations at our booth. Thanks for stopping by with your questions and thoughts.

Adding observability to your code isn't cluttering your business code. It's part of your business.
🚀Dive deep into debugging with Autometrics Explorer Monitor function-level metrics and swiftly debug alerts. Easily set up with the Autometrics micro framework, visualize your code's performance, and pinpoint issues. Learn more in @nele_lea's blog. autometrics.dev/blog/using-aut…
Set, monitor, and exceed your Service Level Objectives (#SLOs) using Autometrics Explorer. Gain unparalleled insights into your application's reliability. 📹 @senorbrt
🚀 @AlmightyGiraff introduces the #Autometrics Explorer UI. Enhance #observability, track function performance, and debug faster than ever. Address issues from root to resolution effortlessly. youtu.be/7ax3LwdTLqM


United States Trends
- 1. #BaddiesUSA 60.8K posts
- 2. Rams 29.4K posts
- 3. #LAShortnSweet 21.7K posts
- 4. TOP CALL 3,343 posts
- 5. Scotty 9,841 posts
- 6. Cowboys 101K posts
- 7. Eagles 141K posts
- 8. Chip Kelly 8,724 posts
- 9. #TROLLBOY 1,986 posts
- 10. sabrina 61.5K posts
- 11. #ITWelcomeToDerry 15.6K posts
- 12. Raiders 67.7K posts
- 13. #centralwOrldXmasXFreenBecky 245K posts
- 14. Stacey 24.4K posts
- 15. SAROCHA REBECCA DISNEY AT CTW 257K posts
- 16. Stafford 15.2K posts
- 17. Ahna 7,271 posts
- 18. Bucs 12.3K posts
- 19. Baker 20.8K posts
- 20. Market Focus 2,200 posts


Something went wrong.
Something went wrong.