
edgeful
@edgeful
stop guessing where price will go, we show you the odds. trade with data, not your emotions. technical analysis made simple. https://www.edgeful.com/disclaimer
daily updates by @edgeful founder and CEO, @andrearslanian follow for details on what's new & coming soon to edgeful


Advice to prop firm traders: If you’re going to use a prop firm, you need to treat it like that $2k drawdown is your real money. A lot people spend $50 on an eval and YOLO every trade to try to pass it — “it’s only $50” If you continue to treat an eval like “it’s only $50. I…

FIND YOUR DAILY BIAS IN 30 SECONDS Seasonal tendencies tell you where smart money is positioned before you even look at a chart. US equities tend to rally in October to November. That's your bias. Frame every daily/weekly trade around this edge.

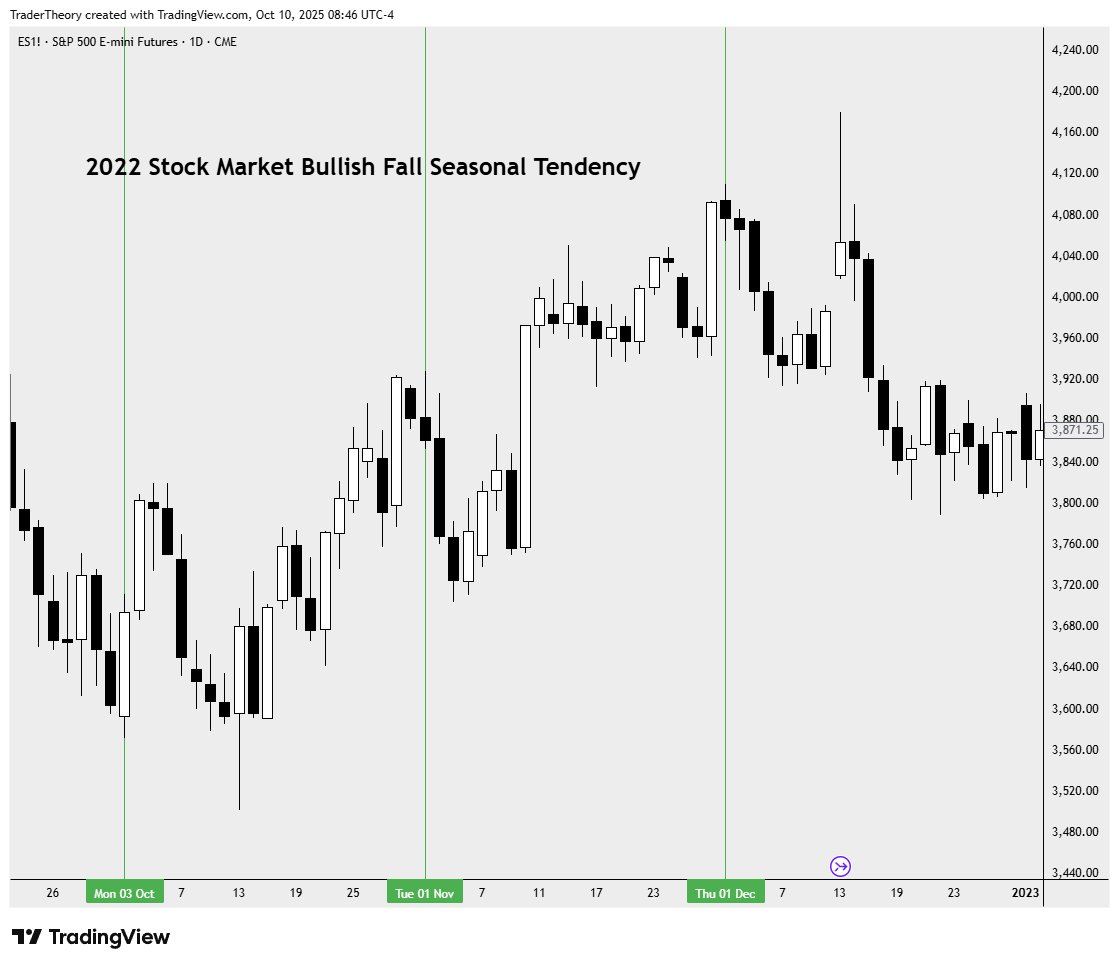

find your daily bias with the previous day's range report on @edgeful 🦅 !!
IMPORTANT NASDAQ FUTURES (NQ) STATISTIC If there's a break above the Previous Daily High (PDH): There's a 68% chance of the 1D candle closing bullish. Based on 1 year of data.


how to find your daily bias using the previous day's range report on @edgeful 🦅
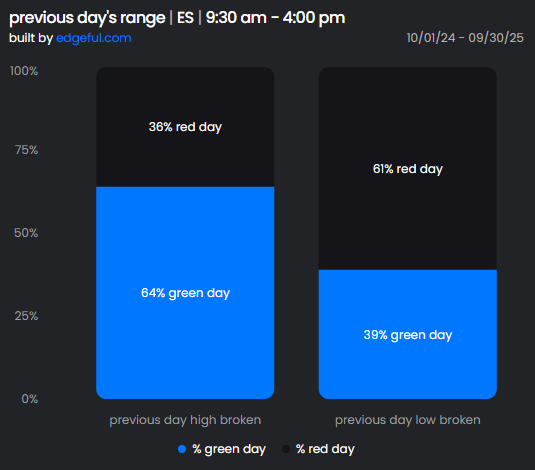
FOR ES TRADERS Over the past 1 year: When the Previous Daily High is broken there is a 64% chance of the daily candle closing bullish. Use this for determining your daily bias.


United States Tendencias
- 1. Auburn 21.2K posts
- 2. #UFCRio 43K posts
- 3. Penn State 25.4K posts
- 4. Indiana 46.8K posts
- 5. James Franklin 13K posts
- 6. Hugh Freeze N/A
- 7. Oregon 69.5K posts
- 8. Diane Keaton 207K posts
- 9. King Miller N/A
- 10. Andrew Vaughn 1,226 posts
- 11. Charles 98K posts
- 12. Michigan 55K posts
- 13. Nuss 4,324 posts
- 14. Do Bronx 6,780 posts
- 15. Makai Lemon 1,243 posts
- 16. Sherrone Moore N/A
- 17. #AEWCollision 7,793 posts
- 18. Mateer 12.9K posts
- 19. #iufb 8,052 posts
- 20. Drew Allar 6,093 posts
Something went wrong.
Something went wrong.