
Grid Status
@grid_status
Stay informed on the real-time status of the US Electric Grid with comprehensive monitoring and data
You might like


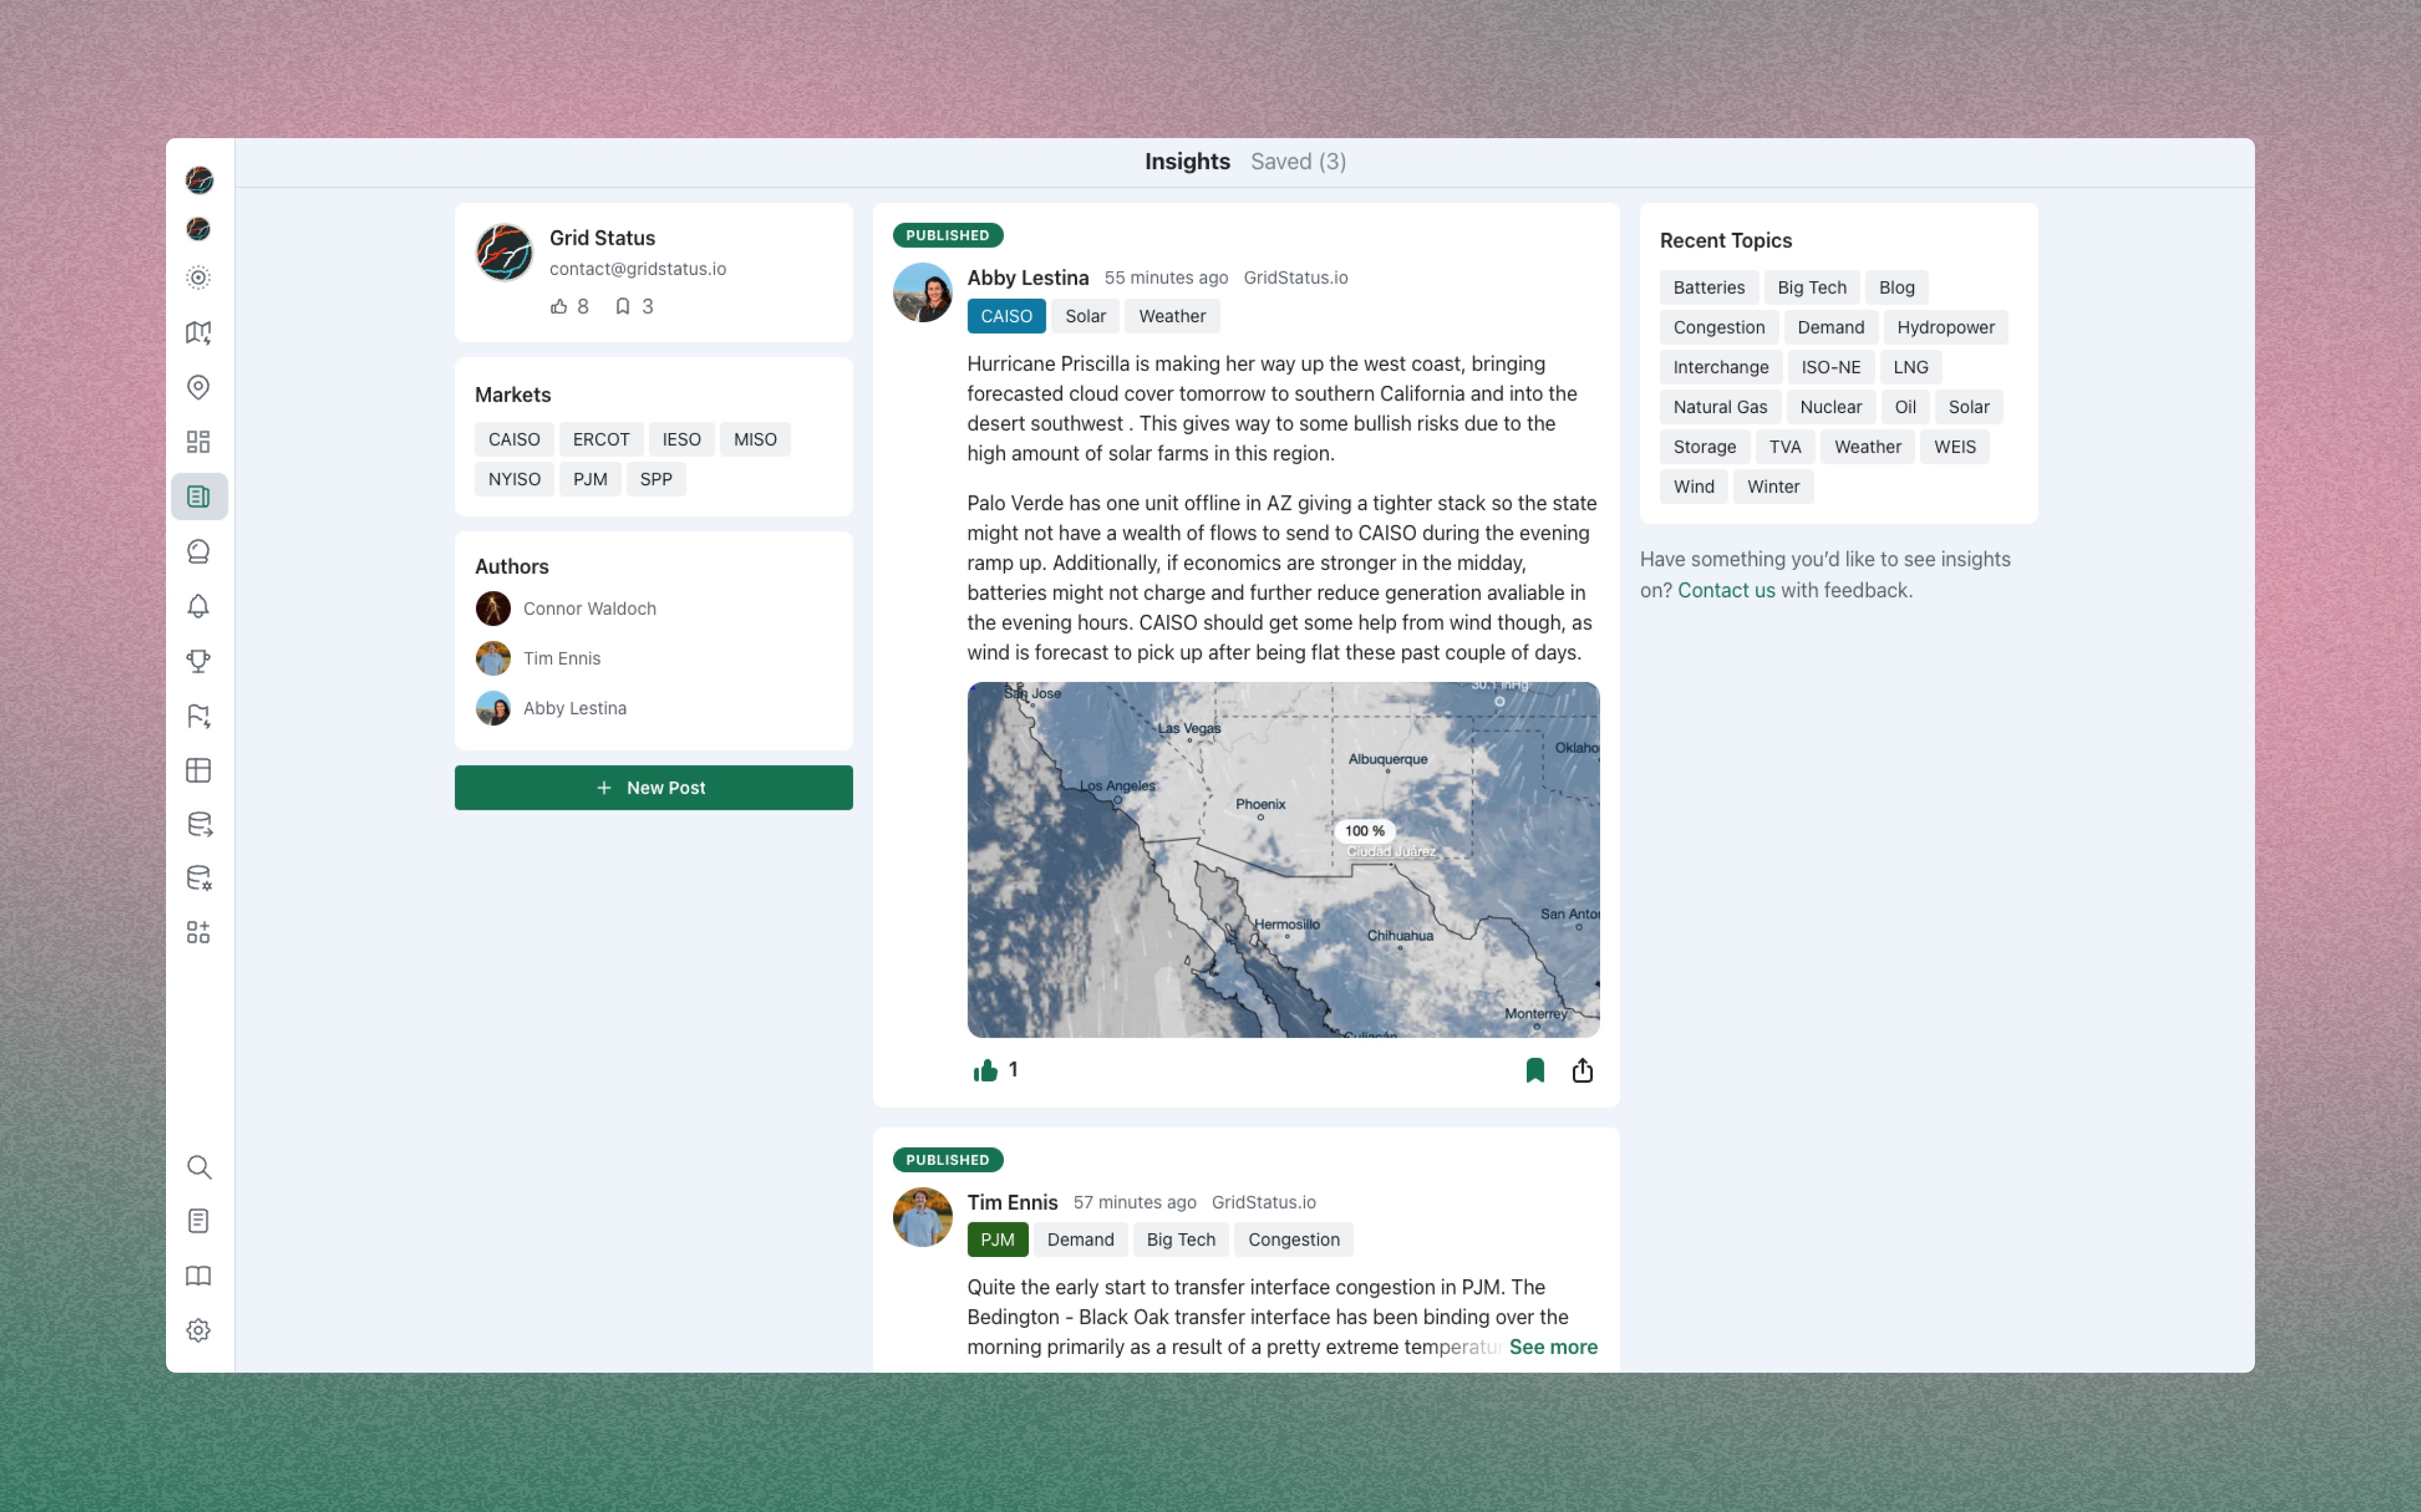
Check out our new real-time feed of expert commentary on energy markets and the electric grid gridstatus.io/insights
ERCOT's massive RTC+B cutover is still a few weeks away, but trial data is already flowing into Grid Status. Curious what it looks like? We just released an ERCOT RTC+B dashboard with a visual preview of trial data. You can check it out on the ERCOT Live Page here:…

We're not trying to trick you, but if you factor Halloween into your decision-making, you might be in for quite a treat. Over the past 9 years, real-time load has underperformed almost all of PJM’s forecasts over the evening peak, precisely during prime trick-or-treating hours.


A little teaser of our next product release: Grid Status Insights. Insights is a real-time feed of expert commentary on energy markets and the electric grid — straight from our team of talented analysts. If you’ve enjoyed our blogs or social posts, you’re going to love this!

Wildfire smoke complicated NYISO’s BTM solar forecast this week, overforecasting by over 500 MW on Monday and underforecasting by 1,000 MW on Tuesday This miss was not even with downstate zones staying close to the forecast, while upstate zones saw large swings


Good illustration of how much the Texas grid has changed in just 6 years. yellow = solar; purple = batteries; dark green = wind; blue = gas; brown = coal; light green = nuke via @grid_status

🔥This week saw 72 hours of extreme temps in the Eastern US — here’s how they impacted electricity prices in 60 seconds. It was a clear reminder: summer risk isn’t going anywhere, and cooling for those new demand centers only gets more difficult as temperatures rise.
This lines up perfectly with a clear drop in @California_ISO system load last night via @grid_status

ERCOT added 9 GW of peak renewables output in the past year. Just stunning numbers. h/t @douglewinenergy

About to release a new Forecast Analysis app on @grid_status , and I’m looking for users to test it. Not only does it make pretty visualizations, it helps you understand how forecast vintages evolve over time, compare their historical accuracy, and more. DM or reply for link!


United States Trends
- 1. #WWERaw 70.7K posts
- 2. Purdy 27.5K posts
- 3. Panthers 37.1K posts
- 4. Bryce 20.6K posts
- 5. Finch 14.6K posts
- 6. Timberwolves 3,553 posts
- 7. 49ers 40.7K posts
- 8. Canales 13.2K posts
- 9. Gonzaga 3,860 posts
- 10. Keegan Murray 1,221 posts
- 11. #FTTB 5,680 posts
- 12. Mac Jones 4,901 posts
- 13. Penta 10.3K posts
- 14. Niners 5,734 posts
- 15. Zags N/A
- 16. Amen Thompson 2,000 posts
- 17. #KeepPounding 5,344 posts
- 18. Malik Monk N/A
- 19. Gunther 15K posts
- 20. Streaming 2.0 2,220 posts
You might like
-
 Brian Bartholomew
@BPBartholomew -
 Joshua D. Rhodes
@joshdr83 -
 Max Kanter
@maxk -
 Doug Lewin
@douglewinenergy -
 Cody Hill
@cody_a_hill -
 Tim Latimer
@TimMLatimer -
 DER Task Force
@DER_Task_Force -
 Heatmap News
@heatmap_news -
 Rob Gramlich
@RobGramlichDC -
 Michael E. Webber
@MichaelEWebber -
 Industrious Labs
@industriouslabs -
 capacity
@capacitymarket8 -
 Ben Serrurier
@benserrurier -
 Julien Jomaux
@JomauxJulien -
 Travis Kavulla
@TKavulla
Something went wrong.
Something went wrong.