
Len Lardaro
@ladardo
Professor of Economics, University of Rhode Island
Talvez você curta


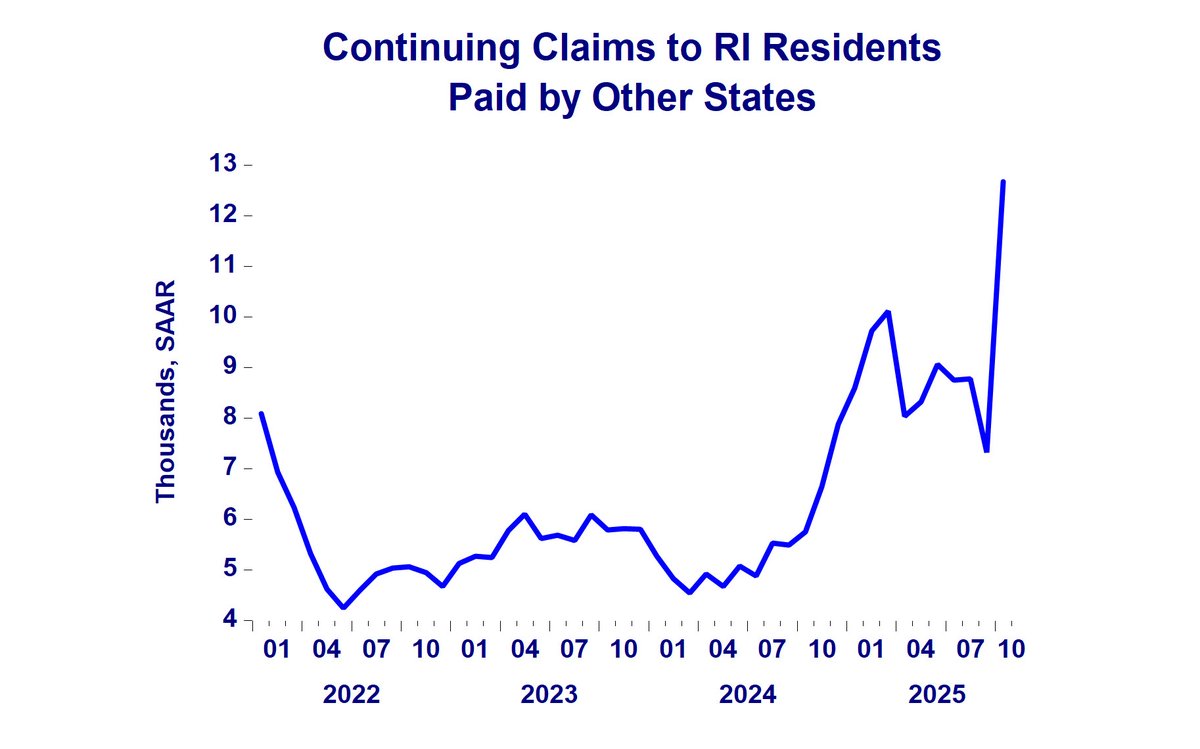
Here's a shocking and somewhat unexpected trend: RI residents receiving UI payments from other states is going parabolic.
It is ironic that while there is no RI employment data due to the shutdown, even if it were provided, we are currently in the least-accurate months - those most likely to be revised!
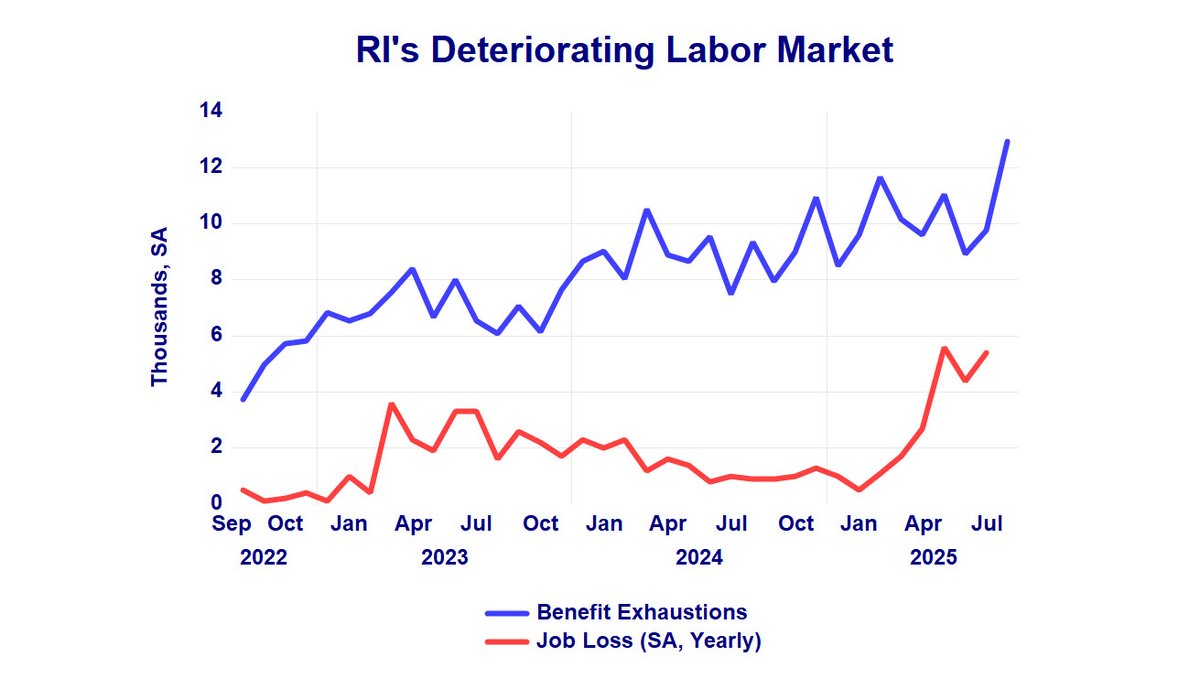
To see why RI's labor market is deteriorating, look at both benefit exhaustion (long-term unemployment) and job losses (annually). The link is readily apparent.
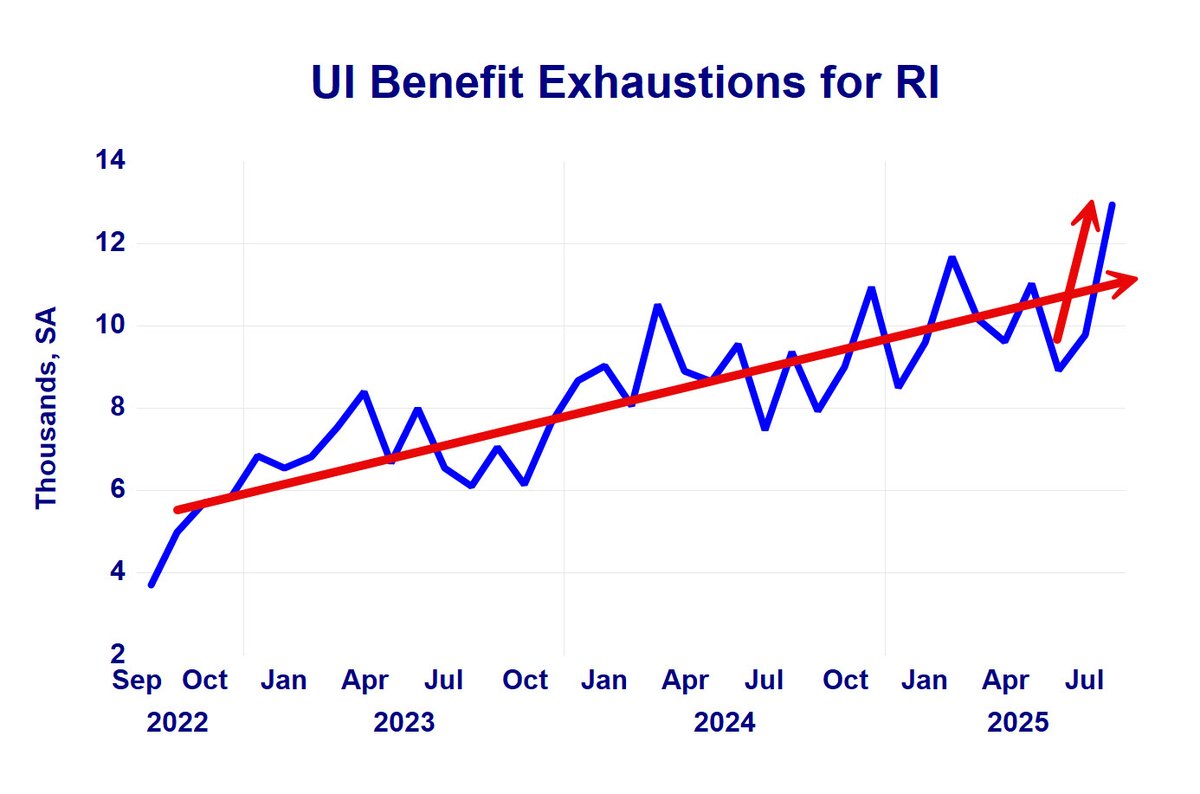
September UI benefit exhaustions for RI, which reflect long-term unemployment, are considerably less than encouraging. Not only do exhaustions continue to rise, but they are doing so at a more rapid rate.
While everyone here focuses on overall employment change (RI payroll employment), they overlook the distinction between job gain and job loss, which I include each month in my CCI report. Since January, losses have continually crept higher, a worrisome sign.

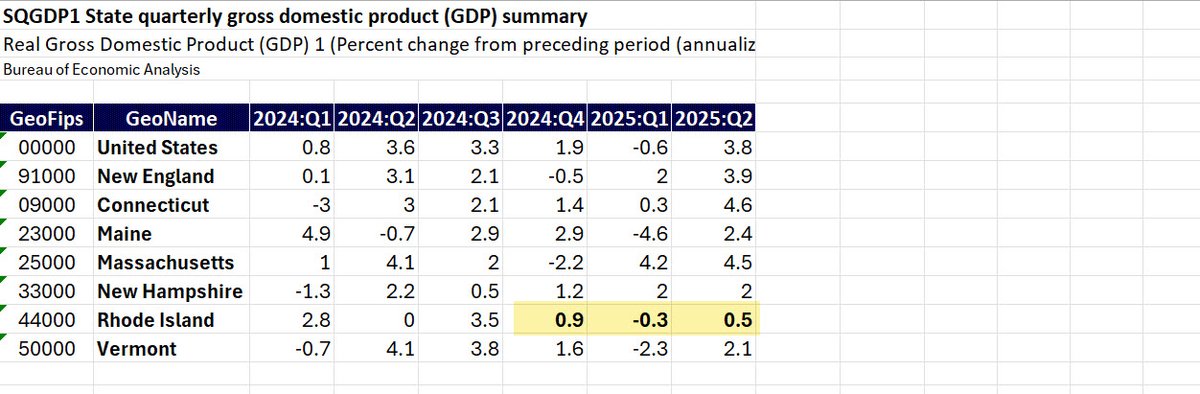
Rhode Island's economic growth since Q4 of last year has been very slow, bordering on recession, which is entirely consistent with what my Current Conditions Index has been showing. This was especially true for Q2 of this year - growth far below NENG states and the US.
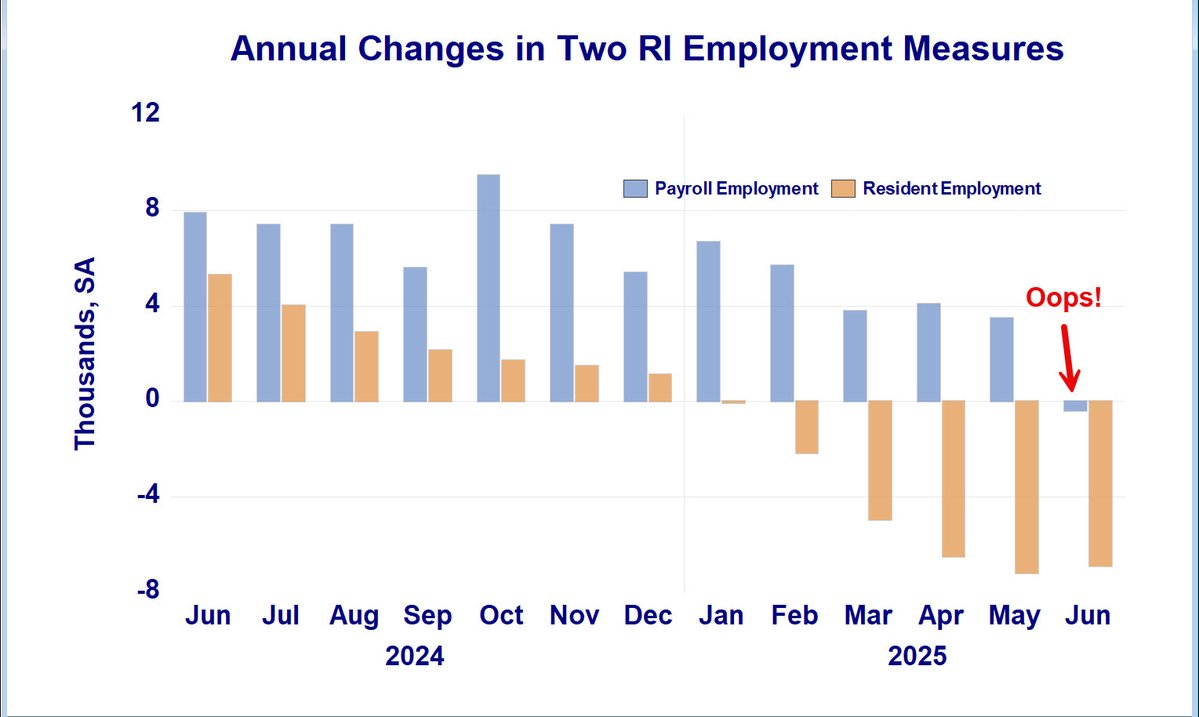
2/ A major divergence remains between the two RI August employment series. Annual changes (SA): Payroll employment change was +1,700, while resident employment change was -3,300. At turning points resident employment tends to be the more accurate. We'll see.
1/ August labor market data for RI paint an encouraging sign, consistent with what my CCI July data showed. While annual changes are still negative and problematic, the monthly change is very encouraging.

I just saw a report by ETQ noting that RI lost 43.9% of its manufacturing employment between 2000 and 2024, and manufacturing output was flat over that period. That was it. Ever heard of productivity? Therefore, productivity (output per worker) here rose by 43.9 percent.
3/ This suggests that, in addition to all the other potentially complicating factors with RI labor market data, seasonal adjustment is emerging as a potential concern. The "tea leaves" just got more opaque!
2/ Contrasting seasonally adjusted (SA) annual household data with not seasonally adjusted (NSA), a different picture emerges. For NSA, both employment loss and the change in the number of unemployed is smaller. And, drum roll please - the unemployment rate is unchanged annually.

1/ RI's July labor market data are somewhat confusing. Household survey shows annual weakness, but some monthly strength, perhaps a bottom. Payroll employment has resumed gains both monthly and annually. There is a complicating factor .....

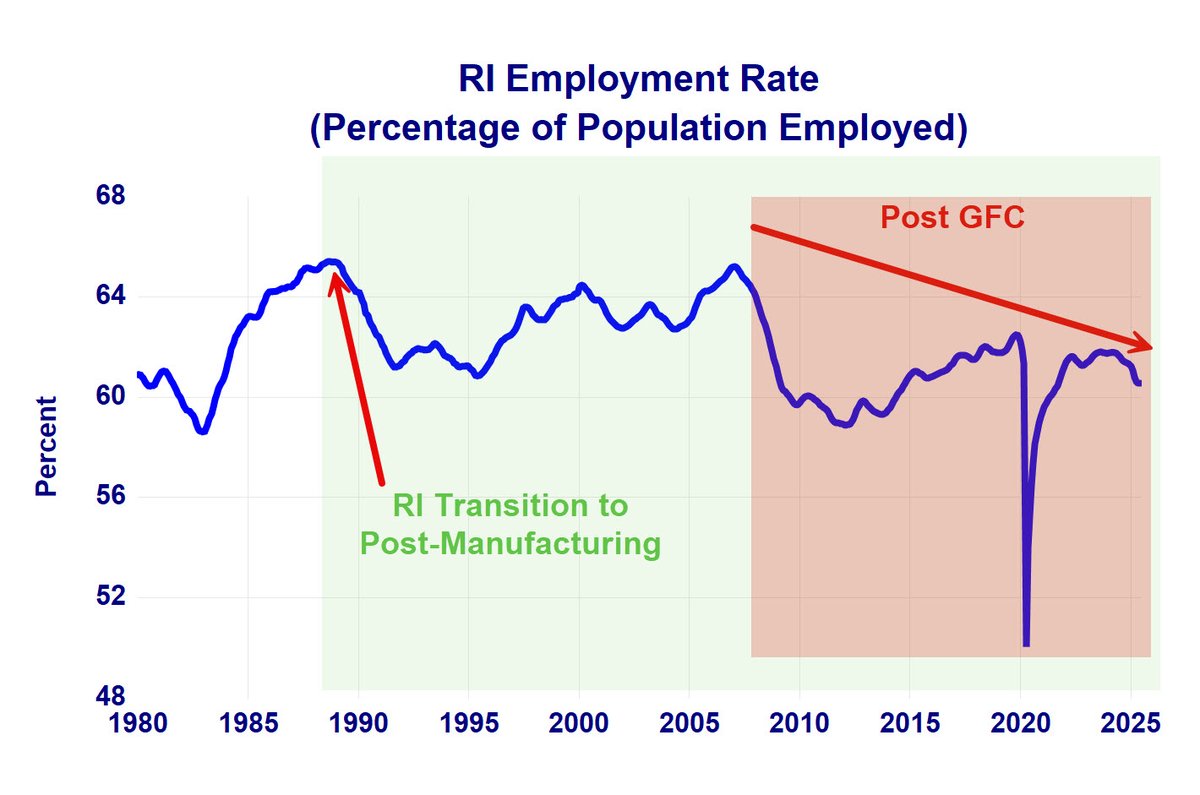
RI's employment rate (resident employment as a percent of population 16+) has not done well since the Great Financial Crisis (GFC), and recently has continued to weaken.
An interesting chart: Real average hourly earnings for the private sector in Rhode Island. Essentially flat since 2023. Consistent with moderating or slowing growth.

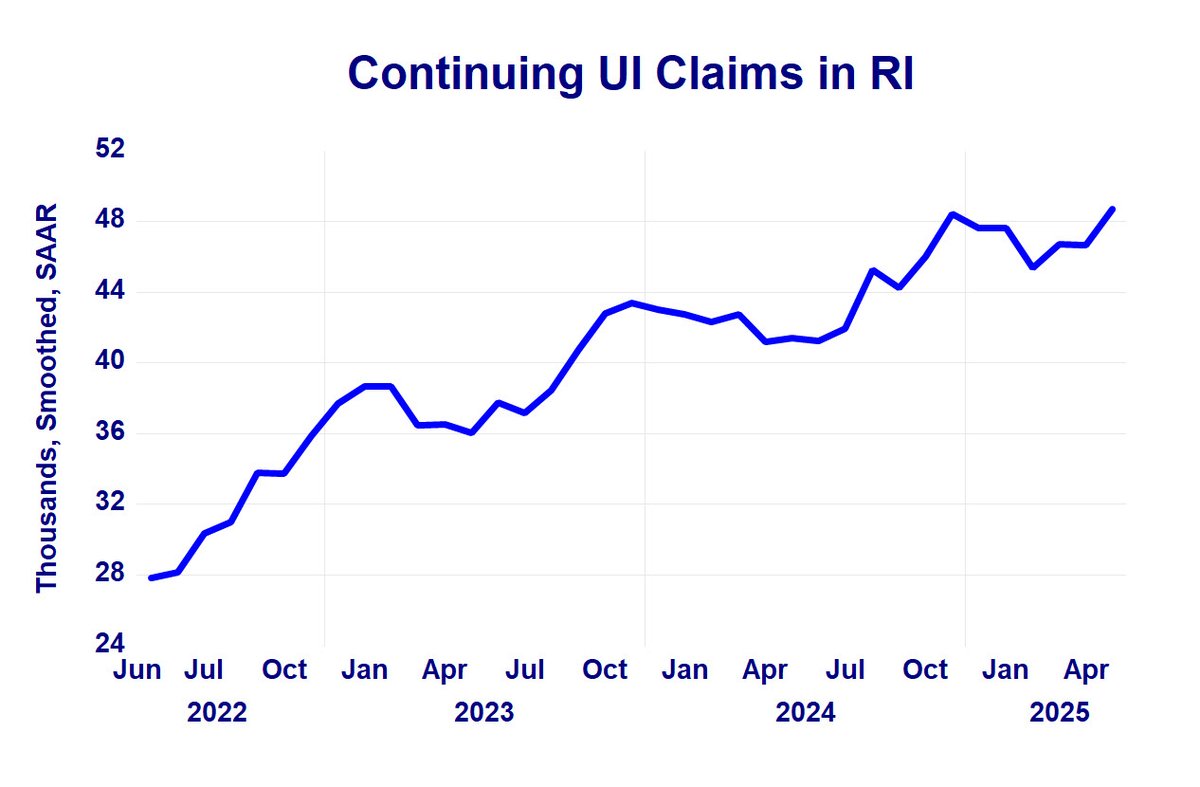
Another disturbing labor market trend in Rhode Island: Continuing UI claims continue to rise. It's getting increasingly difficult to find jobs here, as the similar uptrend in benefit exhaustions further illustrates.
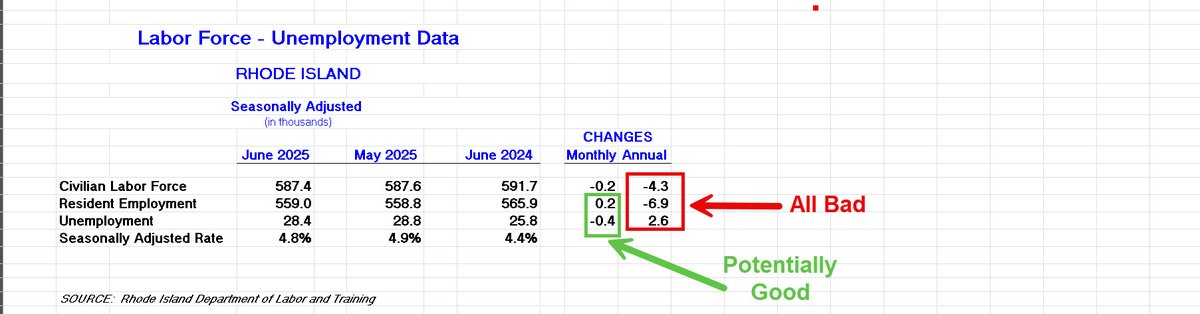
4/ FYI: The participation-adjusted unemployment rate for RI rose to 6.4 percent in June, as both the labor force participation rate and the employment rate fell (again!).
3/ Interestingly, RI payroll employment was revised slightly lower for May, so weakness in that employment measure might not just be a one-month phenomenon. But the cardinal rule: Never place too much weight on data for a single period.
2/ Changes in the two RI employment measures had diverged, with resident employment falling for several months while payroll employment rose. That changed in June as payroll fell. Again, one month only. Eventually, changes in the two series can be expected to converge.
1/ June labor data had a few interesting twists. On an annual basis, all household survey measures remained bad. Monthly, maybe a glimmer of hope, as resident employment squeaked out a slight gain (+200), while still falling annually. This bears watching.
2/ Couple this with the question of seasonal adjustment effects on the recent trend in RI payroll employment (recent post), and things aren't as rosy as a cursory examination of payroll employment data would suggest.


United States Tendências
- 1. Broncos 45.4K posts
- 2. Mariota 12.7K posts
- 3. Ertz 3,065 posts
- 4. Commanders 32.6K posts
- 5. Bo Nix 9,757 posts
- 6. #RaiseHail 5,677 posts
- 7. Riley Moss 2,249 posts
- 8. #BaddiesUSA 24.1K posts
- 9. #SNFonNBC N/A
- 10. Treylon Burks 11.9K posts
- 11. Bobby Wagner 1,039 posts
- 12. Terry 20.1K posts
- 13. #DENvsWAS 3,157 posts
- 14. Deebo 3,077 posts
- 15. Bonitto 5,528 posts
- 16. #RHOP 11.9K posts
- 17. Collinsworth 2,991 posts
- 18. Sean Payton 1,601 posts
- 19. Dan Quinn N/A
- 20. Zach Edey 2,958 posts
Talvez você curta
-
 Hummel Report
@hummel_report -
 Patrick Anderson
@PatrickAnderso_ -
 RIPEC
RIPEC
@RIPEC_ -
 RI Center for Freedom
@RICenterFreedom -
 Steve Klamkin is on Bluesky
@NewsProvidence -
 Anchor Rising
@AnchorRising -
 Ocean State Current
@TheCurrentRI -
 𝕂𝕖𝕟 𝔹𝕝𝕠𝕔𝕜
@KenBlockRI -
 gary sasse
@gssasse -
 David Preston
@DavidPreston_ -
 Rep Mike Chippendale
@MikeWChip -
 Kate Nagle
@NagleKate78 -
 Brian Daniels
@PurpleTieRI -
 Katie Mulvaney
@kmulvane -
 Paul Grimaldi
@PaulEGrimaldi
Something went wrong.
Something went wrong.